 IB Docs (2) Team

PED elasticity and sales revenue?
 Introduction
This lesson relates the concept of PED, learnt in the previous lesson, to a firm's sales revenue? A good way to introduce this concept is to refer back to the rubber band activity. When a firm raises price, i.e. applies upward pressure to the elastic band the firm wishes to see only a small change in quantity demanded. This can be demonstrated by a small stretch in the elastic. Similarly, when the firm applies downward pressure, through lower prices, the business hopes to see a much larger reaction.
Enquiry question
What is the role of PED for firms in making decisions regarding price changes and their effect on total revenue?
Lesson time: 1 hour
Lesson objectives:
Examine the role of PED for firms in making decisions regarding price changes and their effect on total revenue
Teacher notes:
1. Beginning activity - for the beginning activity show the first video which is 5 and half minutes long and then have your classes complete activities 1-3. In total the beginning activities should take around 20 minutes to complete.
2. Processes - technical Vocabulary - your classes can learn the required vocabulary from the short summary, contained on the handout, which summarises the key elements of the enquiry question. Allow 5 minutes for this activity, so that your classes can highlight / underline the key terms and ask questions.
3 Practise activities 4 and 5 - attached to the class handout are two practise activities, which should take your classes another 15 minutes to complete. Activity 5 is a paper three type, so you may decide to provide it to your HL students only.
4. Final reflection activity - allow 10 minutes for the reinforcement activity, which consists of a paper one style exam question on this topic. This can also be given as a homework exercise, with or without the essay template attached.
5. Homework activity - allow 10 minutes for the activity, if set as homework. I generally advise my classes to use the essay template attached, when completing the homework.
 Key points:
For PED elastic goods: The sales revenue for a firm will rise when the business producing the product reduces the price of the good or service. This is because the additional revenue gained from increased sales will be greater than the loss of revenue through lower prices. Equally when the firm raises the price of the product, revenue will fall because the additional revenue gained through higher prices will be lower than than the fall in quantity demanded at the new price level.
For PED inelastic goods: The sales revenue for a firm will rise when the business raises the price of the good or service. This is because the additional revenue gained from higher prices will be more than than the loss of revenue through lower sales. Equally when the firm reduces the price of the product revenue will fall, because the additional revenue gained through higher quantity demanded will be lower than the fall in revenue through lower prices.
For PED unitary goods: The sales revenue for a firm will be unaffected by a change in the price of the good or service because the additional revenue gained from the change in price will be proportional to the loss of revenue through changing sales.
 Activity 1
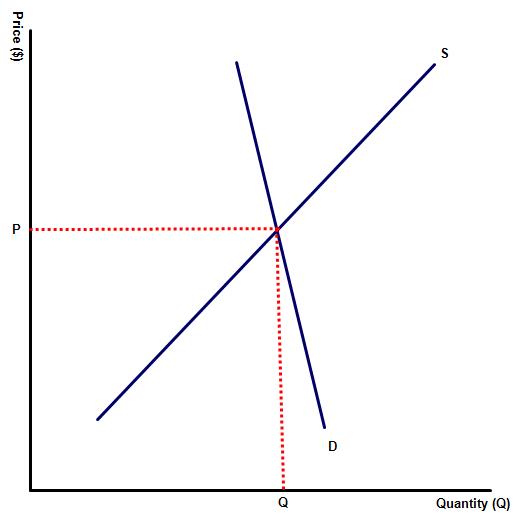
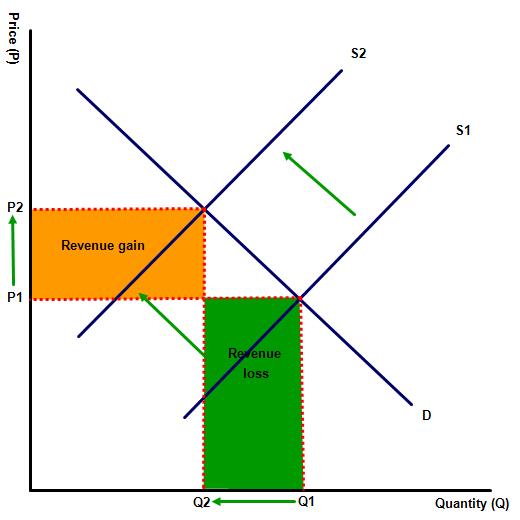
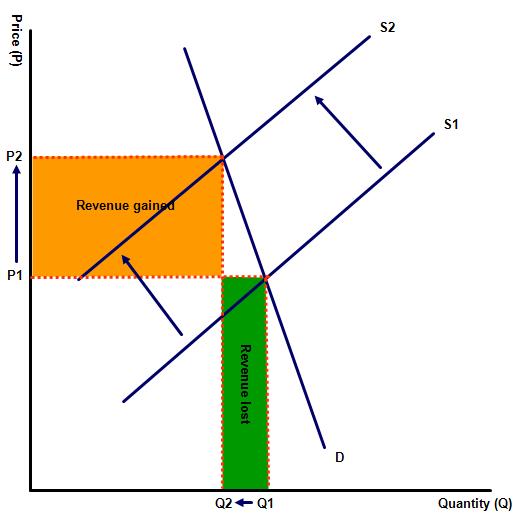
The following diagram illustrates the level of demand for a PED inelastic good. Illustrate the impact of a rise in price, resulting from a fall in supply (left shift in the supply curve).
(a) Indicate the new equilibrium for the product and shade in the revenue gained from the price rise as well as revenue lost.

(b) Does the sales revenue for this firm fall or rise following the price rise and why?
The company raises price from P1 to P2, which leads to a proportionately smaller fall in quantity demanded from Q1 to Q2. This means that the firm will see a rise in its sales revenue.
(c) What would be the impact on sales revenue if the same company reduced its price and why?
If the selling price falls from P2 to P1, then sales revenue will decrease because the rise in quantity demanded (Q2 - Q1) will be smaller than the fall in price.
 Activity 2
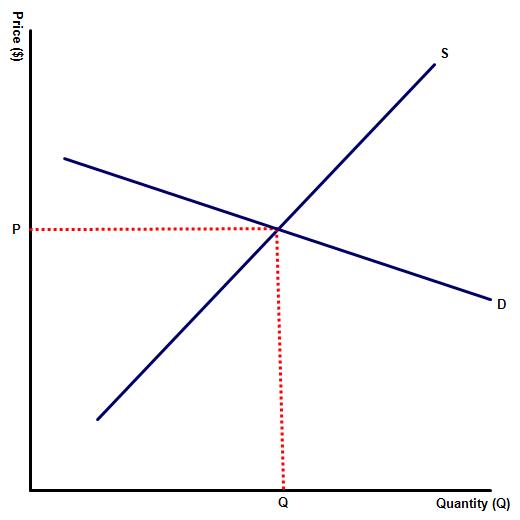
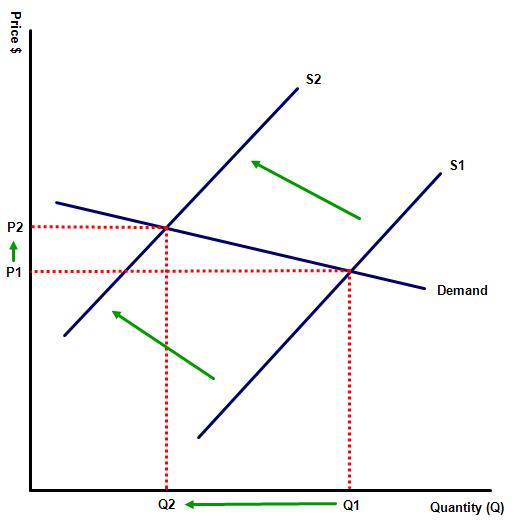
The following diagram illustrates the level of demand for a PED elastic good. Illustrate the impact of a rise in price, resulting from a fall in supply (left shift in the supply curve).
(a) Indicate the new equilibrium for the product and shade in the revenue gained from the price rise as well as revenue lost.
(b) Does the sales revenue for this firm fall or rise following the price rise and why?
The company raises price from P1 to P2, which leads to a proportionately larger fall in quantity demanded from Q1 to Q2. This means that the firm will see a fall in its sales revenue.
(c) What would be the impact on sales revenue if the same company reduced its price and why?
If the selling price falls from P2 to P1, then sales revenue will increase because the rise in quantity demanded (Q2 - Q1) will be larger than the fall in price.
 Activity 3
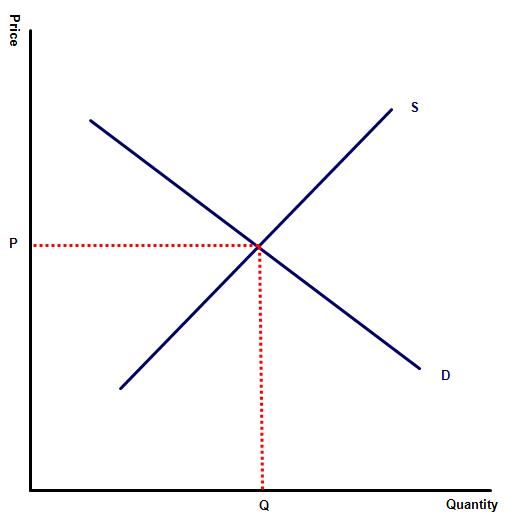
The following diagram illustrates the level of demand for a PED unitary good. Illustrate the impact of a rise in price, resulting from a fall in supply (left shift in the supply curve).
(a) Indicate the new equilibrium for the product and shade in the revenue gained from the price rise as well as revenue lost.
(b) Does the sales revenue for this firm fall or rise following the price rise and why?
The firm makes the decision to raise price from P1 to P2, in the hope of increasing their sales revenue through higher sales. The resulting quantity demanded falls from Q1 to Q2. In this example the price change is unsuccessful as the loss of revenue from the lower price is matched exactly by the gain in revenue from increased sales as the product is a unitary elastic good.
(c) What would be the impact on sales revenue if the same company reduced its price and why?
The same would also be the case had the firm tried to reduce price.
Activity 4
Start by watching the following short video on PED and sales revenue and use the information contained in the video to answer the questions that follow.
(a) Draw a PED elastic curve. Show the impact on revenue of a rise in price for the good or service? [2 marks]
(b) Draw a PED inelastic diagram and again show the impact on revenue of a rise in price for the good or service? [2 marks]
(c) How does the above impact on business pricing decisions? [4 marks]
 PED elasticity impacts on business decisions because firms will first need to consider the impact on sales revenue of any change in the selling price. Firms producing a PED elastic good or service will be very reluctant to raise prices for fear of losing revenue. Circumstances such as a significant rise in production costs may force their hand however. In such an instance they may first check on whether their competitors are likely to follow any price rise or not? They may look to reduce their prices and gain revenue but of course will be reluctant to do so if their competitors also reduce their prices, effectively nullifying any competitive advantage gained by reducing their price levels.
By contrast a firm producing a price inelastic product will be keen to raise prices and improve their sales revenue. However, before taking such a course of action they will need to ensure that other competing firms do not use this price rise to increase their market share. Firms producing price inelastic goods and services will not reduce prices as this will lead to a fall in revenue.
Activity 5
The following table represents a supply and demand function for two goods. Both products have the supply function of QS=100P, but different demand functions.
| Price ($) | Quantity supplied | Quantity demanded for good A | Quantity demanded for good B |
| 1 | 100 | 700 | 400 |
| 2 | 200 | 500 | 350 |
| 3 | 300 | 300 | 300 |
| 4 | 400 | 100 | 250 |
| 5 | 500 | 50 | 200 |
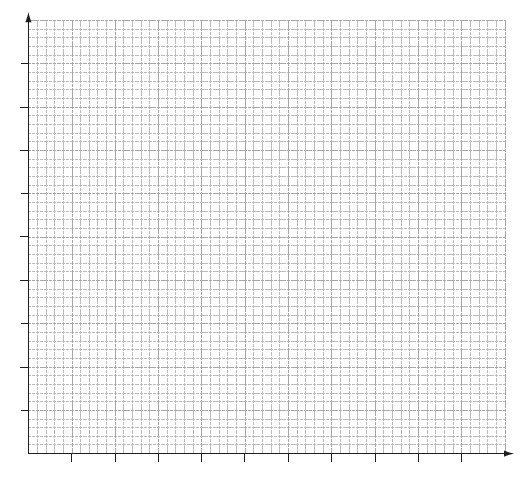
(a) illustrate the information contained in the table onto the graph paper included, using suitable axis. [2 marks]
(b) A fall in oil prices reduces the production costs of both products, leading to a new equilibrium price of $2. Illustrate this on both diagrams, shading in the area that represents the revenue gain for both products. [2 marks]
(c) Calculate the PED for both products at the equilibrium price level, following the fall. [4 marks]Good A - 67/33 = 2.03
Good B - 17/33 = 0.52
(d) Which of the two businesses is likely to benefit the most from the fall in production costs and why? [2 marks]
Good A due to its higher price elasticity and hence greater increase in quantity demanded, following the fall in selling price.
Class activities are available as a class handout at: ![]() PED and sales revenue
PED and sales revenue
6. Reflection activity - link to the assessment
The relationship between PED elasticity and sales revenue will typically be found on paper one. An example of a relevant paper one question includes:
a. Explain how firms can use the concept of price elasticity of demand to increase sales revenue. [10 marks]
 Command term: Explain
Explain means to provide reasons and causes - or in other words, explain how producers can use PED theory to increase their sales revenue.
Defining the key terms PED elasticity and even more importantly sales revenue is key to answering this question. By defining sales revenue as selling price x quantity sold, a response can be set up by an explanation that following a rise in price businesses will gain sales revenue if the fall in quantity demanded < than the initial rise in price (PED inelastic good).
Similarly a business will also gain revenue if following a fall in price the resulting increase in quantity demanded is proportionally greater than the initial reduction in price. (PED elastic good).
This should be illustrated by appropriate diagrams.
b. Using real world examples discuss the importance of price elasticity of demand for governments when intervening in different markets. [15 marks]
Command term: Discuss
 Discuss means to offer a considered and balanced review of the various arguments, factors or hypotheses. Governments may intervene in different markets but perhaps the most appropriate for this question is the policy of indirect taxes and subsidies. Before placing either a sales tax or subsidy on a product they must consider the PED of the good or service. When governments place a sales tax on demerit goods such as cigarettes, fuel or alcoholic drinks, in an attempt to reduce consumption rates, the impact of the tax is relatively small due to those product's PED inelasticity.
Similarly when placing a subsidy on a PED elastic good such as public transport the impact on overall passenger numbers is considerable.
Relevant real life examples might include examples of where governments have placed taxes on demerit goods which low levels of elasticity e.g. cigarettes, alcohol and car fuel. In each example the low PED for those products means that the level of tax revenue collected is considerable while the tax has a relatively small impact on quantity demanded.
Advice on answering questions on demand elasticity
It is important to use specific language when answering an examination style on any type of elasticity. Candidates are advised to be specific in their definitions. For example when describing a good or service as PED inelastic an appropriate definition might be a product where a change in its price causes a lower than proportional change in quantity demanded. A definition which describes the product as a good or service where a change in price causes only a small change in quantity demand would not be. Using figures can also help to illustrate an example.
6. Homework / classroom question (HL)
(a) Explain why the price elasticity of demand for primary products tends to be lower than the PED for manufactured goods? [10 marks]
Guidance in answering the homework question
 In answering this question responses should begin with a definition of price elasticity of demand, primary products and manufactured products. PED can be described as the change in quantity demanded for a product in response to a change in price levels. Primary products can be described as any product which is derived from the earth and is not normally consumed directly, instead being used as the basis for a manufactured product, which is a finished good or service, sold or consumed. Examples of primary goods include agricultural products and commodities.
Candidates should then begin their explanation of why the price elasticity of demand for primary commodities is normally lower than the PED for manufactured products.
This can be explained in terms of whether or not the good or service is a basic necessity or a luxury product, plus the availability of substitutes. Given the type of products produced it is more likely that primary commodities will have fewer substitutes and many may also qualify as basic necessities. Similarly many 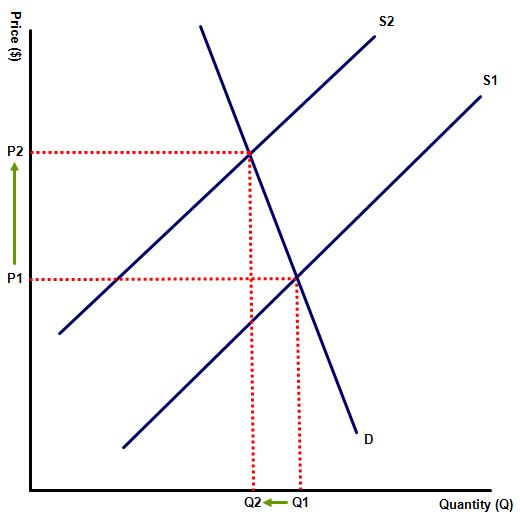 manufactured goods are luxury products, while in many fields such as automobiles and technology there are a range of similar products, each competing for the consumers attentions.
Responses would also be expected to illustrate their responses with diagrams to show examples of products which are PED inelastic (above and to the left) as well as goods which are PED elastic (below and to the right). Candidates should also provide examples of primary goods and manufactured products which are PED elastic / inelastic.
Responses should also provide examples of exceptions to the normal rule e.g. diamonds and precious jewels, which are PED elastic as well as cheap every day use manufactured goods which are PED inelastic.
Responses may also note that many farmers around the world are small in size and hence have little market power to change price.
An appropriate conclusion could state that while many primary products are PED inelastic in the short run only, in the long run the PED of many primary products will increase.
Responses for section (a) should be graded according to the following mark bands:
Maximum mark for this section 10.
| Level | Descriptor | Mark |
| 0 | The response is below the minimum standards described below. | 0 |
| 1 | The term PED elasticity is not defined or defined incorrectly. The response demonstrates a limited understanding of the demands of the question. Little relevant economic theory is included in the response. The response contains significant errors. | 1-3 |
| 2 | PED elasticity is defined but a basic definition only is provided. Some relevant economic theory is included in the response but any application is likely to be superficial. A diagram maybe included but contains some errors or omissions. There are some errors but these are relatively minor. | 4-6 |
| 3 | PED elasticity is defined correctly. Relevant economic theory is included and applied. Relevant diagrams are included, illustrating goods with different elasticities. Appropriate examples are used which helps support the rest of the response. These are applied to the demands of the question. There are minimal errors included in the response. | 7-8 |
| 4 | PED elasticity is defined correctly. Appropriate diagrams are included and the supporting explanations are full and clearly answer the question. Relevant economic theory is included and applied. Appropriate examples are used which support the rest of the response. These are skilfully applied to the demands of the question. Any errors are minor and do not detract from the overall quality of the response. |
(b) Using real world examples, discuss how a change in production costs impacts on the revenue of firms producing goods with different levels of price elasticity. [15 marks]
Command term: Discuss requires candidates to offer a considered and balanced review, including a range of arguments.
Responses should include the following:
 A definition of price elasticity of demand. Candidates that defined PED in the first part of the response do not need to redefine this term, but must make reference to it in order to earn credit for the definition.
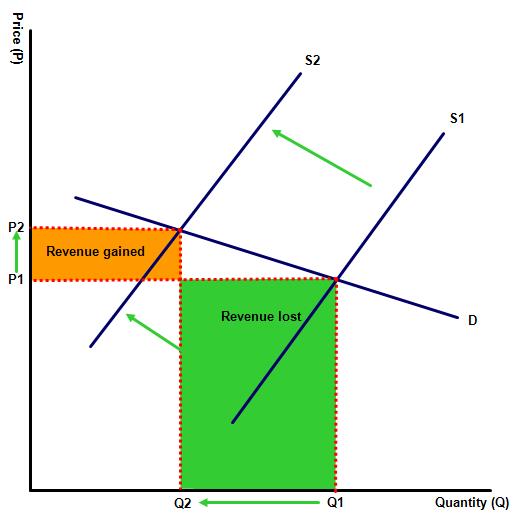
The response should contain relevant diagrams to illustrate goods with high / low PED elasticity. For example, the first diagram represents a good with low PED elasticity and the second (below) a product with low PED elasticity.
In diagram 1, there is a rise in production costs, a result of a rise in one or more of the costs of production e.g. a rise in energy or labour costs, or a rise in interest rates making loan repayments more expensive. In response the firm passes those additional costs on to the consumer, illustrated by a rise in price from P1 to P2. This in turn leads to a fall in quantity demanded falls from Q1 to Q2. The firm ends up benefiting from the price rise, because the additional revenue gained from selling each unit more than compensates for the relatively small fall in quantity demanded. The revenue gain is illustrated on diagram 1 by the orange shaded area, while the relatively small revenue loss is represented by the green rectangle.
By contrast, diagram 2 illustrates a good or service with high PED elasticity. Conscious of the low brand loyalty for this product, the seller is reluctant to increase their prices, but when forced, does so by a relatively small amount from P1 to P2. This leads to a greater than proportional fall in quantity demanded and a loss of revenue, illustrated on the diagram by the green shaded area. The gain in revenue is relatively small and is represented by the orange rectangle.
Lastly, a good or service with unitary PED elasticity, illustrated on the third diagram, will see no change in total revenue, following a rise in price, as the fall in quantity demanded will mirror exactly the rise in revenue per unit sold, making the firm indifferent to changes in price.
Responses should then discuss how this impacts on a firm's decision making process. For example a firm producing PES elastic products would be very particularly reluctant to pass on the additional costs to the consumer, in the form of higher prices. Instead the firm may choose to absorb the additional costs themselves or attempt to reduce other areas of the production costs, in order to avoid increasing prices.
By contrast, firms producing PED inelastic goods would feel more confident about passing on the additional costs to the consumer and may even raise prices further than necessary. An example of this might include the tobacco companies who continue to enjoy large profits despite significant rises in price as a result of indirect taxes placed on their production.
Responses should then illustrate the impact of a fall in production costs on businesses producing goods and services with different levels of price elasticity. For example a firm producing a PED elastic good, with a number of close substitutes, might be encouraged to engage in a price war. This is illustrated in the final diagram, where a firm producing a PED elastic product has benefited from lowering prices, potentially at the expense of its competitors.
Firms producing PED inelastic goods and services will not benefit from a price war, but might instead look to collude with other competing firms e.g. the oil companies.
Responses may conclude with a comparison of stakeholders, e.g. customers are more likely to benefit from PED products, while the producer will benefit most from the production of PED inelastic products, as well as a consideration of short run v long run elasticities.
Responses for section (b) should be graded according to the following mark bands:
Maximum mark for this section 15.
| Level | Descriptor | Mark |
| 0 | The response does not meet the standards as described below. | 0 |
| 1 | The term PED is not defined or is defined incorrectly. The response demonstrates only a basic understanding of the significance of the importance of PED to governments when making decisions. Little economic theory is included in the response. The response contains significant errors. | 1-4 |
| 2 | A basic definition of PED is provided. The response demonstrates some understanding of the importance of PED to governments when making decisions. Any examples used are likely to be applied superficially. Little relevant economic theory is included in the response. A diagram may be included but it is likely to contain some errors or omissions. The response contains some links to the real-world issue. There are some errors in the response but these are relatively minor. | 5-8 |
| 3 | A full definition of PED is provided. The response demonstrates a good understanding of the importance of PED to governments when making decisions. Examples are included and applied to the question. Relevant economic theory is included in the response though some of the examples and/or applications may be vague. The candidate includes balance in the response. At least one diagram is included which illustrates a PED elastic good. The response makes appropriate links to the real-world issue. There are minimal errors included in the response. | 9-12 |
| 4 | A full definition of PED is provided. The response demonstrates a clear understanding of the significant importance of PED to governments when making decisions. Examples are included and skilfully applied to the question. Relevant economic theory is included in the response and specific examples are provided and the response is both balanced and detailed. An appropriate diagram showing a PED elastic good. The response makes clear links to the real-world issue and applies them skilfully. Any errors are minor and do not detract from the quality of the work. | 13-15 |
The above question is available as a PDF file at: ![]() Elasticity question, and the mark scheme at:
Elasticity question, and the mark scheme at: ![]() Elasticity mark scheme
Elasticity mark scheme
Essay template for a paper one style essay question: ![]() Section A template
Section A template
 Twitter
 Facebook
 LinkedIn