 IB Docs (2) Team

Equilibrium in macroeconomics (neo-classical perspective)
 Introduction
While there is general consensus among economists concerning the shape of the aggregate demand curve as well as the short run aggregate supply curve, economists tend to disagree over the shape of the AS curve in the long run, with theorists divided into one of two camps - keynesian economists and on the other hand neo-classical economists, which includes monetarist, neo-monetarist, laissez faire as well as Chicago school economists. This page focuses on the equilibrium in macroeconomics from a neo-classical perspective.Enquiry question
Why using the monetarist / new classical model, is the long run aggregate supply curve (LRAS) vertical at the full employment output level.
 Lesson time: 70 minutes
Lesson objectives:
Explain, using a diagram, that the monetarist / new classical model of the long run aggregate supply curve (LRAS) is vertical at the level of potential output (full employment output) because aggregate supply in the long run is independent of the price level.
Explain, using a diagram, the determination of long-run equilibrium, according to the monetarist / new classical model, indicating that long-run equilibrium occurs at the full employment level of output.
Examine why, in the monetarist / new classical approach, while there may be short-term fluctuations in output, the economy will always return to the full employment level of output in the long run.
Teacher notes:
1. Beginning activity - begin with the opening video which takes 15 minutes and links directly to activities 1 and 2.
2. Processes - technical vocabulary - the students can learn the key concepts through the opening video and the handout containing the activities. Allow 20 minutes to go through activities 1 and 2 and discuss both.
3. Developing the argument - activity 3 and 4 start with a short video and your students can use the information contained in the video to consider whether governments can really trust the economies automatic stabilisers, or whether governments instead need to intervene. (15 minutes)
4. Short revision questions - activity 5 contains 5 short answer revision questions. (10 minutes)
5. Final reflection - complete this lesson by looking at the paper one examination style question. This can also be completed as a class or homework exercise. (10 minutes)
Key terms:
Macroeconomic equilibrium - where aggregate supply is equal to aggregate demand.
Inflationary gap - inflationary pressure created by the current (or SR) equilibrium being above the full employment (or LR) equilibrium.
Contractionary / recessionary gap - where the level of national output is operating below the full employment level of output.
Output gap - when the economy is experiencing either an inflationary or contractionary gap.
Recession - a period of time when there is a fall in GDP for two consecutive three-month periods.
Crowding out (HL) - a situation where too much government spending drives down or eliminates private sector spending, through bidding up the price of resources and factors of production.
The activities on this page are available as a PDF file at: ![]() Macroequilibrium
Macroequilibrium
Beginning exercise: Macroeconomic equilibrium
Begin by showing the following short video and then have your classes complete activity 1.
Activity 1: Inflationary gap
(a) Using information from the video draw a diagram illustrating an economy in its long run equilibrium from the neo-classical perspective.
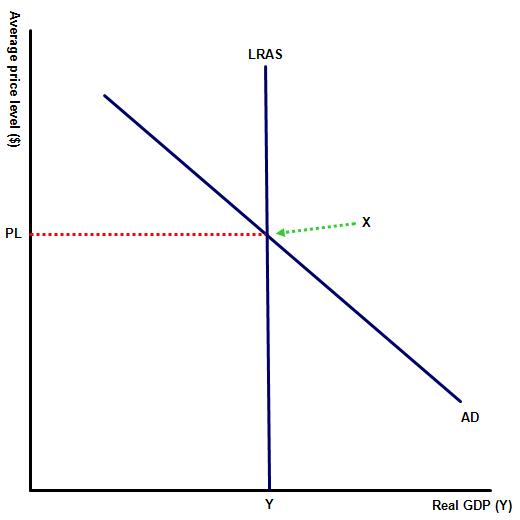 From a neoclassical / monetarist perspective the curve is perfectly inelastic - i.e. average price levels and real national income are independent of each other. Any changes in aggregate demand therefore will ultimately impact on average price levels rather than the level of real income in the economy.
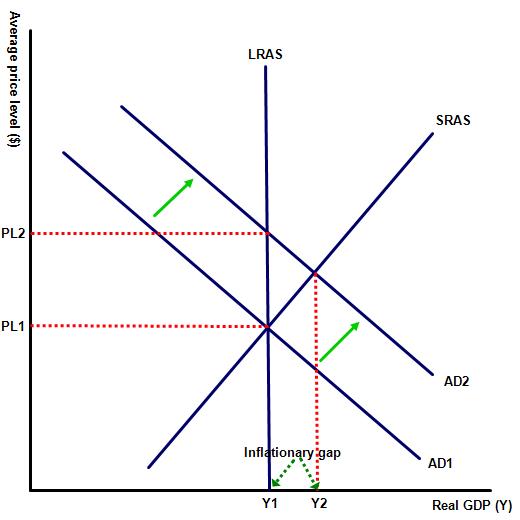
(b) Illustrate the initial short run effect of a rise in AD and label the inflationary gap created.
(c) Explain why the growth in real GDP disappears in the long run?
 In the long run the video claims that the economy is self correcting. This means that in the long run the economy will automatically settle at its long run equilibrium, represented on the diagram to the left by point X, where AD intersects with the LRAS curve.
This is because in any economy there are a fixed number of factors of production factors - land, labour e.t.c. and if government chooses to employ those resources in the public sector then this will cause 'crowding out' in the private sector, with scarce resources rising in price.
Once this happens the motivation for firms to continue operating at Y2 diminishes as the additional profit earned from the increased selling price is cancelled out by the higher production costs. With firms receiving no benefit from the short term rise in output, the short run aggregate supply curve falls from SRAS1 to SRAS2 and the new equilibrium level of output remains at Y1, but at the higher average price level of P3. This is represented by a change in the equilibrium from A to B.
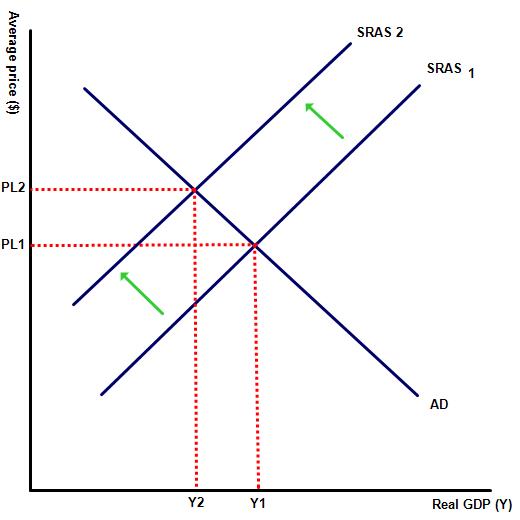
Activity 2: Closing a deflationary gap
The diagram to the right illustrates the economy in equilibrium.
(a) Illustrate the impact of a fall in AD on the diagram and label the size of the recessionary gap.
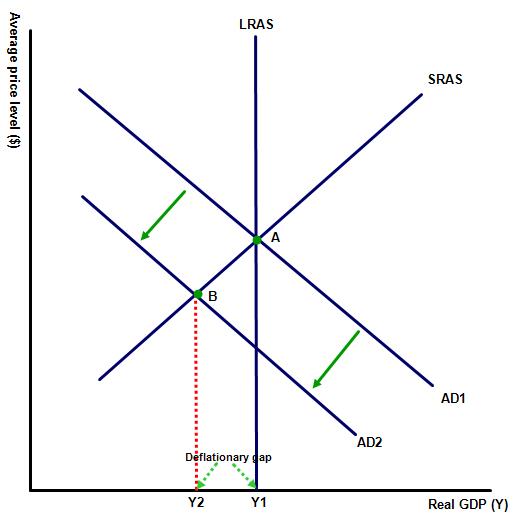
(b) Explain why neoclassical economists believe that the deflationary gap will not last and the economy will eventually return to its long run equilibrium.
 Overtime unemployed workers will begin to accept lower wages and the price of other factors of production, as well as key raw materials will fall, forcing up profit levels within firms.
As businesses start to feel the benefit from lower production costs those firms will gradually raise output levels, illustrated by the rise in aggregate supply from AS1 to AS2, until the deflationary gap disappears. Output level returns to its full employment level of Y1 and at the new macro economic equilibrium level the new price level is represented by PL3. This is represented by diagram 2, to the left.
Activity 3: Automatic stabilisers
Show the following short video on the same topic and then answer the questions which follow:
(a) Why according to the video might the automatic stabilisers in the economy take several years to correct?
(b) Does this mean that governments should intervene in the economy, by stimulating demand themselves, rather than relying on the economy's natural stabilisers?
(c) What measures might a government take to stimulate demand in the economy, rather than wait for the economy to correct itself?
Examples include rises in public spending (G), a reduction in income taxes to help stimulate (C) and (I) as measures such as quantitative easing of money, e.t.c.
Activity 4: Sticky wages / prices
Do sticky wages and prices make it more difficult for the economy to come out of recession? Study the following table and then decide.
| Year | GDP growth % | Unemployment % | Rise in average prices % | Real wage growth % |
| 2008 | (0.3) | 5.3 | 0.1 | 4.1 |
| 2009 | (2.8) | 8 | 2.7 | (6.8) |
| 2010 | 2.5 | 9.8 | 1.5 | (1.8) |
| 2011 | 1.6 | 9.2 | 3 | 2.1 |
| 2012 | 2.2 | 8.2 | 1.7 | 4.3 |
| 2013 | 1.7 | 8 | 1.5 | 5 |
| 2014 | 2.4 | 6.5 | 0.8 | 4.2 |
| 2015 | 2.6 | 5.6 | 0.7 | 5.1 |
| 2016 | 2.1 | 5 | 2.1 | 4 |
Figures accessed from ![]() Trading economics
Trading economics
To what extent does the data in the above table suggest that prices and wages respond to changes in economic activity?
The above data suggests that wages and general prices do respond to changes in economic activity. For instance during the recession of 2007 - 2010 real wages fell as unemployment rose and national income fell. Similarly as the economy gathered pace wages and average prices rose, thus supporting the neoclassical economic perspective. That said during this period, the USA government did use aggressive stimulus measures to boost the economy, rather than simply trust the economy to correct itself.
Activity 5: Short answer revision questions
Select the correct response:
1. Which of the following statements is correct?
A. Wages do not adjust to changes in the price level
B. Wages fall when the price level falls and rise when the price level rises
C. Wages fall when the price level rises and rise when the price level falls
D. Wages do not change when the price level increases and wages fall when the price level decreases
E. Wages do not change when the price level falls and rise when the price level rises.
B
 2. At point Y on the diagram, the economy has
A. A positive output gap
B. An unemployment rate equal to the natural rate of unemployment
C. An output on its long-run equilibrium
D. A recession
E. A negative output gap
C
 3. The diagram to the left indicates an economy:
A. At a peak in its business cycle
B. Where the current unemployment rate is lower than the natural rate of unemployment
C. Where the economy is in short-run equilibrium, but not in long-run equilibrium
D. Which has cyclical unemployment but no structural unemployment
E. Where the economy is in short-run and long-run equilibrium.
E
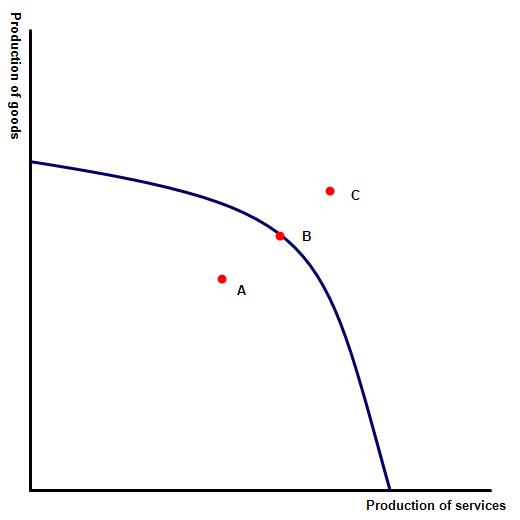 4. Which point on the PPF diagram represents the economy at its long run equilibrium?
A
B
C
B and C
A, B and C.
B
5. Which point on the PPF diagram represents the economy experiencing a recessionary gap?
A
B
C
B and C
A, B and C.
A
Activity 6: Link to the assessment in paper one
Examples of typical paper one questions on macroeconomic equilibrium policies include:
Part (a)
Explain possible reasons why an economy might go into recession. [10 marks]
Command term: Explain
Key term to define: recession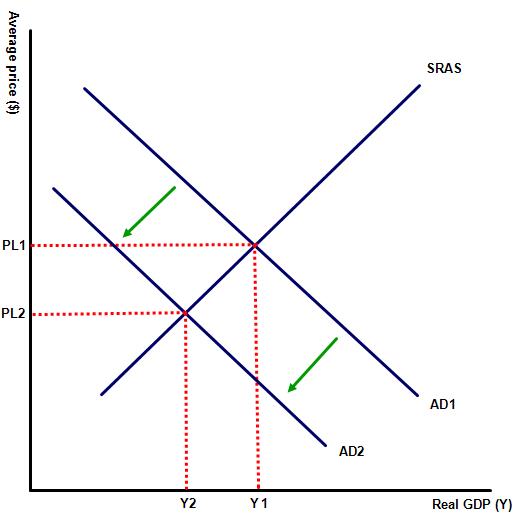
A definition of recession as a period when there is a fall in GDP for two consecutive three month periods. This should be followed by an explanation of how a fall in any one of the components of AD could lead to a fall in national income: consumption, investment, government expenditure or net exports. If national income then falls for two consecutive periods then this is a technical recession. This is illustrated by the following diagram, showing a decline in aggregate demand, represented by a left shift in AD and a fall in output equal to Y1, Y2.
 An explanation that a recession can also be caused by supply factors rather than demand side factors. For example, a rise in production costs, e.g. an increase in the price of oil or minimum wage, may cause a fall in GDP through reductions in SRAS, illustrated on diagram 2 by a fall in SRAS to SRAS2 and a reduction in real output from Y1 to Y2.
A recognition that in some cases a recession may stem from external events e.g. recessions in other countries leading to a fall in export revenues.
Part (b)
Using real world examples, discuss the view that in the long run an economy will inevitably return to the full employment level of output. [15 marks]
 Command term: Discuss
Key term to define: Full employment level of output
This question requires a discussion of the validity of this claim and centres on two distinct economic schools of thought.
Real world examples that might be used could include Germany and USA which took very different approaches to the recent financial crisis but both finally returned to the full employment level of national output.
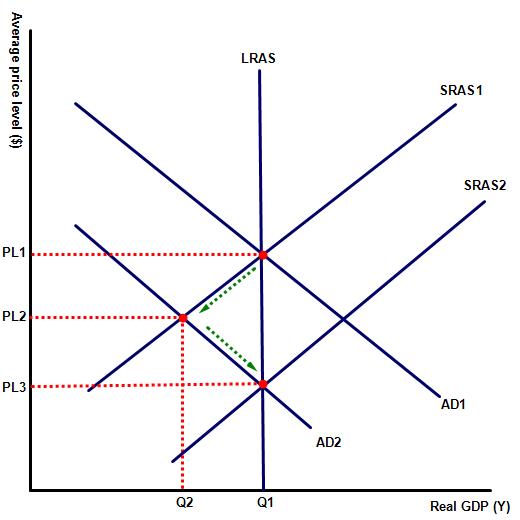
On one hand is the neo-classical economists who support the above statement, believing that an economy will automatically correct itself.
On the LRAS / AD diagram aggregate demand initially falls from AD1 to AD2 and a deflationary gap is created from Q1, Q2. However, neo-classical economists state that over time, as unemployment in the economy rises the price of factor resources will fall. This will create the ideal business climate for firms to raise production levels, with the lower production costs represented by a rise in aggregate supply from SRAS1 to SRAS2. A new long run equilibrium is created and the the economy clears at Q1.
On the other hand keynesian economists do not support this view, claiming instead that without direct government intervention an economy will remain stuck in a permanent deflationary gap. This deflationary gap would be characterised by low wages, high unemployment, low levels of aggregate demand, leading to lower company profits and low levels of investment and employment growth and reducing real wages.
Real world examples that might be used could include Germany and USA which took very different approaches to the recent financial crisis. The USA adopted very aggressive expansionary demand side policies and the economy benefited as a result. By contrast Germany left its economy largely untouched and market forces appear to have brought its economy back into equilibrium - though this process took longer than in the USA which saw almost instant results.
The impact of either policy should also be considered in terms of whether the government is prioritising a short term fix, in which case they are likely to employ keynesian stimulus policies, or whether the government is looking for long term sustainable improvements in growth and are therefore able to wait for the economy's natural stabilisers to be effective.
 Twitter
 Facebook
 LinkedIn