 IB Docs (2) Team

Unit 2.3: Competitive market equilibrium
 Introduction
When you combine the two variables of supply and demand, for any good or service, you arrive at the market equilibrium. This page also contains a number of examination style questions, as well as short answer activities.
Enquiry question
How changes to either supply and / or demand result in changes to the market equilibrium
Calculate and illustrate market equilibrium using linear equations
 Lesson notes
Lesson time: 70 minutes
Lesson objectives:
Develop an understanding of how demand and supply interact to produce market equilibrium.
Analyse, using diagrams and with reference to excess demand or excess supply, how changes in the determinants of demand and/or supply result in a new market equilibrium.
Teacher notes:
1. Opening activity - watch the beginning video which discussed the concepts of market equilibrium and allocate efficiency. The video is 14 minutes long and complements the handout which follows.
2. Processes - technical Vocabulary - your classes can learn the required vocabulary watching the video and studying the class handout which follows. Allow 15 minutes for this activity.
3. Reinforcement activity - attached to the class handout are six short questions on market equilibrium. The questions are designed to be completed after the short video which describes changes in the market for pet snakes, through the Indiana Jones films. This activity also emphasises the point that any market equilibrium is subject to constant change when market conditions dictate. (20 minutes)
4. Link to the assessment - this page includes a relevant section A question, which you can project onto the whiteboard for your classes to read and discuss. (10 minutes)
5. Final reflective activity - project the final activity, the search for market equilibrium onto the whiteboard and have your classes read the exert. The information contained in this activity is also included in the class handout. The aim of this is to emphasise that finding the correct level of price and output is not automatic, regardless of how much prior market research a firm makes. Instead it is only painstakingly found using trial and error and subject to constant change when market conditions dictate. (10 minutes)
Key terms:
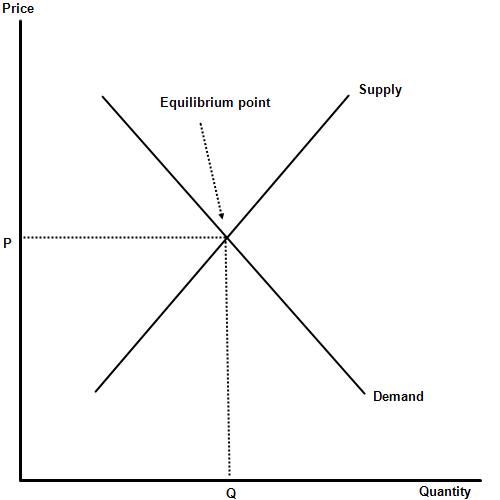
Market equilibrium occurs where supply = demand, in other words the resources employed by firms to produce a good or service is exactly equal to the number of units that consumers are willing and able to purchase. The output level at the equilibrium is said to be allocatively efficient.
Allocative efficiency - exists when price is equal marginal cost (or marginal social cost) and the resources are allocated in such a way that the resources employed to produce a good or service are equal to the consumers willingness and ability to purchase it.
Market disequilibrium - when the market is not allocatively efficient because the market has either too few or too many of the goods and services being produced, from society's point of view.
Class notes can be accessed at: ![]() Equilibrium
Equilibrium
 Activities
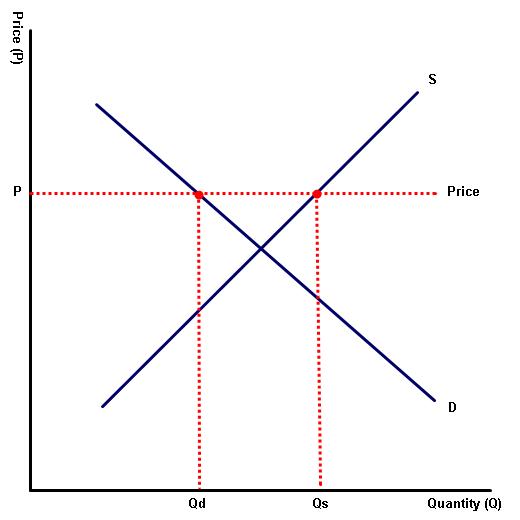
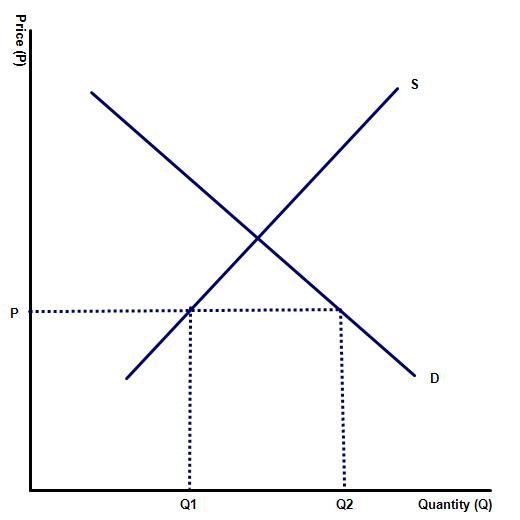
1. What happens when the price of a good or service lies above the equilibrium
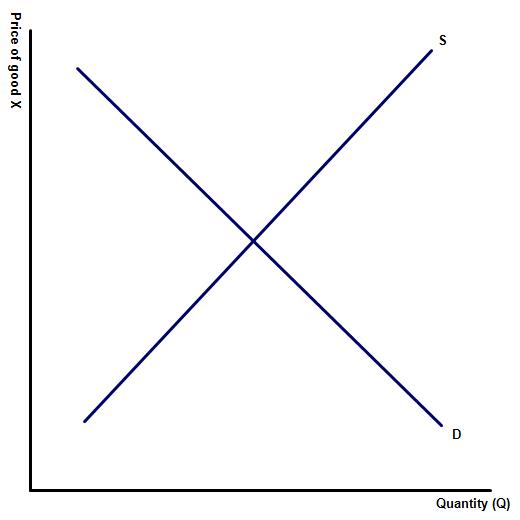
(a) On the blank diagram to the left, illustrate the market for good X when the price of the good or service lies above the equilibrium.(b) Complete the blanks:
In this example, there will be excess ____________ as many producers will want to __________ the product but relatively few consumers will want to _____________ it.
supply, produce, demand
(c) Illustrate the level of excess supply on the diagram.
Activity 2
What happens when the price of a good or service lies below the equilibrium
(a) On the blank diagram to the left, illustrate the market for good X when the price of the good or service lies below the equilibrium.
(b) Complete the blanks:
In this example, there will be excess ____________ as many consumers will want to __________ the product but relatively few producers will want to _____________ it.
demand, purchase, supply
(c) Illustrate the level of excess demand on the diagram.
Activity 3
Start by watching the following video and then answer the 6 short questions that follow, based on the market for pet snakes illustrated through the Indiana Jones films.
1. A fall in the price of pet monkeys
Following a fall in the price of a substitute good pet snakes are likely to see a fall in demand. This is also mentioned in the video.
2. An increase in the number of rat infestations in a local area
An increase in demand for the pet
3. A rare disease which reduces the fertility of female snakes
A fall in supply for the pet, as less are hatched
4. Britain (a large purchaser of pet snakes) introduces tougher quarantine rules for imported reptiles
Britain introducing tougher quarantine rules for imported reptiles would be bad news for the snake market as it may become more difficult to sell the pet in the UK. This will mean a fall in supply.
5. A much publicised celebrity falls ill after being bitten by their own pet snake
A simple one to finish, demand will fall following the recent bad publicity.
6. A rise in the price of snake food
A question that many students get wrong thinking that this will effect only demand for snakes. It will also effect the supply of the pet because the cost of rearing them will rise, reducing the incentive for pet shops to sell them.
4. Link to the examination
Paper one (part A) question.
Explain using appropriate diagrams how a change in one of the determinants of demand and one determinate of supply can result in a change the price for coffee. [10 marks]
 This question requires students to define demand and supply. Demand is the quantity of goods and services that consumers are willing and able to purchase at a given price, in a given time, ceteris parabus. Supply is the quantity of goods and services that producers are willing and able to produce at a given price, in a given time, ceteris parabus.
Responses would also be expected to include diagrams which illustrate the impact of a change to both demand and supply and an illustration of how this will bring about a new equilibrium price for coffee.
Responses should also include two factors that might change demand or supply. Examples of factors include a fall in income, a change in the popularity of the drink or a change in the production costs of coffee. In each example chosen the diagram must match the example provided. For instance if a candidate identifies that a fall in income will reduce demand for coffee then this should be illustrated a left shift in the demand curve.
Responses may also note that a shift in the supply for a product causes a movement in demand and that a shift in the demand for a good or service causes a movement along the supply line.
5. Reflection activity - the search for market equilibrium
 You decide to open a business on your school campus with a friend and so you start to bake homemade cup cakes, which you produce at home. The school has agreed to let you sell these in your lunchtimes, which is 40 minutes long. You open for business on the first day of the school year and initially you sell these cakes for $3 each and find that all are sold within 10 minutes of opening. The next day, learning from your mistake you produce more cakes (though your capacity is limited) and raise the price to $5 each. This time a number of cakes are left unsold and the money is wasted. Eventually, after a number of days, using trial and error you finally come up with an equilibrium price of $4 per cake. This is the situation facing all businesses as they search for that elusive equilibrium price and output level, which ensures that all of their produce is sold, without leaving any consumers unable to purchase the produce they need.
 Twitter
 Facebook
 LinkedIn