 IB Docs (2) Team

Unit 2.1: Demand
 Introduction
Having completed the introductory units you will now be ready to begin the main part of the microeconomics course, with an understanding of markets. Start by explaining to your students that the market for any good or service ultimately comes down to two variables, supply and demand.
This page will introduce the first of those demand. The key term here is derived demand, which means that the demand for any good or service is derived from other variables - the income available of consumers to purchase the product, its popularity as well as rival and complimentary products.
A very important note about demand and one that will be very confusing for your classes is that price is not a determinate of demand. To understand why your students will need to understand the difference between demand and quantity demanded which is explained in this section. Students will also confuse supply with demand and it is very difficult for many IB students to understand. I will start by saying that it is entirely possible for someone to demand something when when there is no supply. Start with the introductory exercise before providing your classes with the handout.
Enquiry question
Why is there an inverse relationship between the price and quantity demanded of a product, ceteris paribus.
Lesson notes
Lesson time: 1 hour
 Lesson objectives:
An understanding of the causal inverse relationship between price and quantity demanded, represented by the demand curve.
The relationship between an individual consumer’s demand and market demand.
Teacher notes:
1. Beginning activity - watch the short video which introduces the concept of demand. (5 minutes)
2. Processes - technical Vocabulary - the students can learn the key concepts through the class handout and power point presentation. Available at: ![]() Demand
Demand
The handout also contains short answer questions. (15 minutes)
3. TOK connection - this activity includes relevant TOK essay titles, which may form the basis for a suitable discussion. (5 minutes)
4. Assessment - activity 4 includes some short answer responses on demand. (10 minutes)
5. Final reflective activity - water market activity, asking students to reflect on the difficulty of buying and selling water in the market place. (25 minutes)
Beginning activity
Watch the following short video which introduces the concept of individual and market demand.
Key terms:
 Demand - the quantity of goods and services that consumers are willing and able to purchase at a given time, ceteris paribus.
Ceteris paribus - means that all other variables remain the same.
HL only
Income effect – the effect of a change in the price of a good or service on real incomes. As the price of a good or service falls, then the real income levels of consumers rise. This means that consumers will be able to purchase more good and services than they were before and quantity demanded for the product will rise.
Substitution effect – the effect of a change in the price of a good or service on the relative price of the product. As a product falls in price then the good will be relatively cheap, compared to its substitutes and so some consumers will switch their demand to the good raising demand.
Available as class notes at: ![]() Demand
Demand
.png(1).jpg) Activity 1
Activity 1
Ask the students how many drink either Coke or Pepsi? Then have those students complete the following table, outlining their consumption of the drink at various prices. Rather than use $ as a reference point you may wish to substitute for a local currency if this is easier for students to provide a response to.
At the end of this exercise your students should each have drawn a table sloping down from left to right. Ask them to apply a line of best fit to plot the points. Students may substitute Coke / Pepsi with another product of their choice if they wish. Once they have drawn a downward sloping demand curve you can lead a short discussion on the reasons for the shape of the curve.
 Activity 2
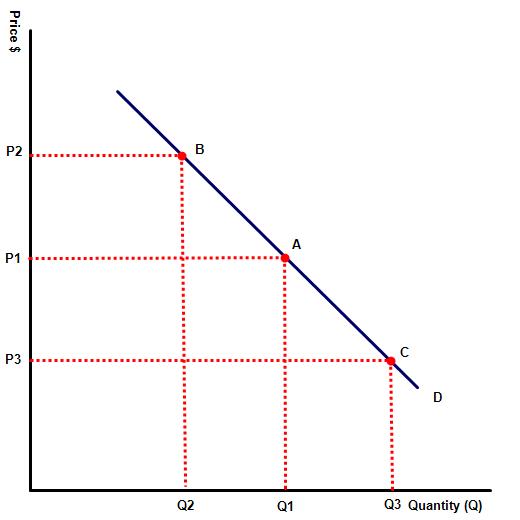
(a) The diagram to the right illustrates a demand curve for a normal good or service. Explain why the demand curve slopes downwards from left to right.
There is an inverse relationship between price and quantity demanded, because of the substitution and income effect.
(b) Why does the demand for a product require consumers to be willing and able to purchase them at each given price?
Because both are required for a transaction to take place. A consumer, for example, may be willing to purchase a brand new Ferrari for $ 100,000 but are they able to do so - as they may not have the required funds.
 Activity 3: Connection with TOK
What are the implications of the assumption of ceteris paribus? Do other areas of knowledge make a similar assumption?
To what extent is it true to say that a demand curve is a fictional entity?
What assumptions underlie the law of demand? Are these assumptions likely to be true? Does it matter if these assumptions are actually false?
Activity 4
Describe the relationship between the following variables:
- the time of the year and demand for sun cream and beach wear?
- the income levels in a nation and demand for electronic and technology products?
- the income levels in an economy and the demand for basic necessities such as bread and rice?
- the demand for sports equipment and the price of pay per view sports channels
- the demand for second hand cars and the price of new cars.
Hint:
An extensive knowledge of elasticity theory is not required at this point but students should understand the relationship between variables.
5. Link to the assessment
There are a number of paper one questions on the concept of demand. In many cases the response requires students to discuss or describe the determinants of demand.
It is important to note that price is not a determinate of demand, because the definition of demand is of course the quantity of goods and services that consumers are willing and able to purchase in a given time, at a given price. Instead determinants include income levels, the popularity of the product and the availability and popularity / price of available substitutes and complimentary goods and services.
6. Final reflective activity
Provide half of your students with four bottles of water (each), who will become the suppliers. The other half of the class will each be  given four $1 bills and these students will become the buyers.
The rules of the water market are as follows:
Students selling the water may charge whatever price they wish and students purchasing the water may shop around to obtain the best price. They will have 10 minutes to buy and sell water and may buy or sell as much as they wish.
Once the activity is complete students should open up their journals and write "Supply and Demand" in the centre, before answering the following questions:
1. How many bottles of water do they currently have?
2. How much money do they have left?
3. What was difficult about buying or selling?
Explain your answer.
The activities on this page link to the following textbook page: Unit 2.1 Demand theory
 Twitter
 Facebook
 LinkedIn