 IB Docs (2) Team

PED and the burden of tax (HL only)
 Introduction
When an indirect tax is placed on a good or service there is an impact on consumers, producers as well as the government. The impact on each stakeholder depends on the PED for a product. Start this lesson with a TOK exercise. Firstly, ask your classes to write down the goods and services, in their country, which are currently subject to a specific consumption tax. Examples might include petrol, alcohol and tobacco products. Next ask your class to provide the reasons why a government places a tax on those specific goods? The two most likely responses are so that the government can raise tax revenue and reduce consumption of demerit goods.
Enquiry question
How does the price elasticity of demand and supply for a good or service impact on the incidence of taxation paid by consumers and producers?
Teacher notes
Lesson time: 90 minutes
Lesson objectives:
Understanding how to explain, using diagrams, how the incidence of indirect taxes on consumers and firms differs, depending on the price elasticity of demand and on the price elasticity of supply.
Plot demand and supply curves for a product from linear functions and then illustrate and/or calculate the effects of the imposition of a specific tax on the market (on price, quantity, consumer expenditure, producer revenue, government revenue,
consumer surplus and producer surplus) - (HL only).
Teacher notes:
1. Beginning activity, what do you your students know already about this topic? Have them complete this question, listing some of the products that are subject to a specific tax in their country. How does this effect both the selling price of the good / service as well as consumption levels? 15 minutes for this important activity.
2. Processes - technical vocabulary - The students learn the content reading the class handout, which you can print off and activities 1-2, which relate to the specific vocabulary required. Allow 15 minutes for this activity.
3. Reinforcement processes - the handout includes 5 activities (3 - 7) where students can test their mathematical skills, calculating PED for example, given a set of data provided, as well as short answer responses where they can apply their knowledge. (30 minutes) It is worth stopping your classes for a moment on activity three and draw attention to the fact that many products which are subject to high levels of taxation - cigarettes and alcohol e.t.c. are PED inelastic. What does this mean for the government in terms of the level of tax revenue collected?
4. Reflection activity - this activity starts with a video and students should then make notes under the headings provided. The aim of this exercise is for your classes to consider how the effectiveness of a sales tax can be judged. (10 minutes)
5. Link to the assessment - this page contains a relevant paper one style question on this topic, which your students can read and draw a plan for completion. Time allowed for this activity could be anything between 10 minutes and 20.
6. Homework exercise - the included homework / revision exercise is a part (a) paper one style question. A mark scheme is included.
1. Beginning question
What goods and services are subject to a specific tax in your country? Why does the government choose to tax these particular products? What happens to the price that consumers pay when a tax is placed on a good or service and how will this impact on demand for the product?
Governments collect tax for two primary reasons. The first is to reduce consumption of undesirable goods and services. Examples of this include petrol for personal cars, alcohol and tobacco products. However, they also wish to collect as much tax revenue as possible. In this scenario governments may be more inclined to place an indirect tax on a good or service with inelastic PED as the revenue collected will be greater. This is illustrated by the observation that many of the products typically taxed by governments e.g. petrol, cigarettes and alcohol are also PED inelastic. The level of tax revenue collected is surely a factor in any decision.
Key terms:
Price elasticity of demand (PED) - A measure of the responsiveness of quantity demanded to changes in price.
Price elasticity of supply (PES) - A measure of the responsiveness of quantity supplied to changes in price.
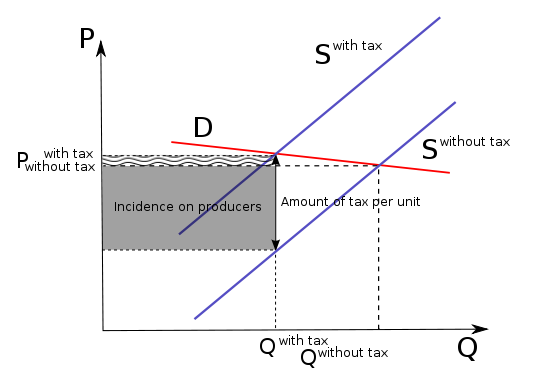
Incidence of taxation - the share of tax paid paid by both the consumer, in the form of higher prices / lower consumer surplus and the share paid by the producer in the form of lost sales and lower producer surplus.
Important note about PES elasticity and the burden of tax
While it is quite normal to focus on the importance of PED in determining the burden of tax paid by both consumers and producers, PES is also relevant. The relationship can be summarised as follows:
When the PES of a good or service is more elastic than demand, it is the consumer that has the greater tax burden.
In incidences where the PED of a product is more elastic than supply, producers have the greater tax burden.
The handout and activities can be accessed as a PDF file at: ![]() PED and tax activities
PED and tax activities
 Activity 1: Understanding the relationship between PED and the burden of taxation
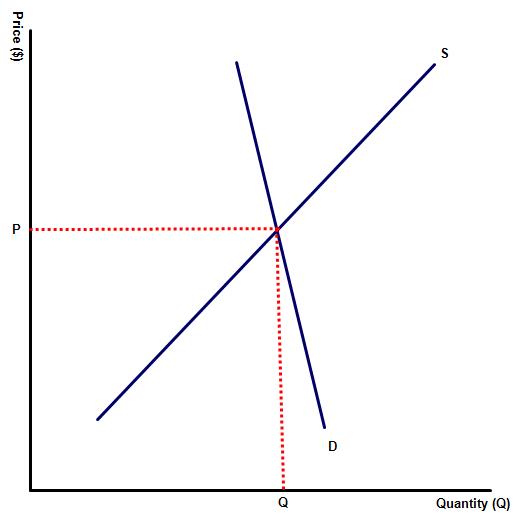
Diagram one illustrates the market for a product with unitary PES and inelastic PED - PES > PED.
(a) Illustrate the impact of a specific (flat rate) tax on the good, indicating the size of the indirect tax.
(b) Draw the new equilibrium price and quantity.
(c) Illustrate the burden of tax paid by both the producer and the consumer.
(d) Which stakeholder pays the higher tax burden - the producer or the consumer? Explain your answer.
Diagram 1 represents a PED inelastic good, meaning that any initial change in price has a smaller than proportional impact on quantity demanded. Here the burden of the tax falls primarily on the consumer, because very few consumers stop purchasing the good and simply, reluctantly, pay the extra cost of the good.
After all everyone needs to eat, drive their car and heat their homes to a comfortable level.
 Activity 2
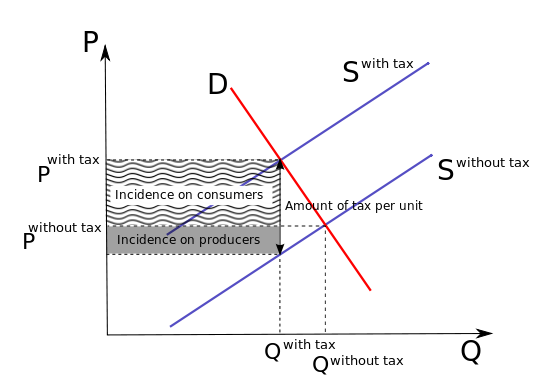
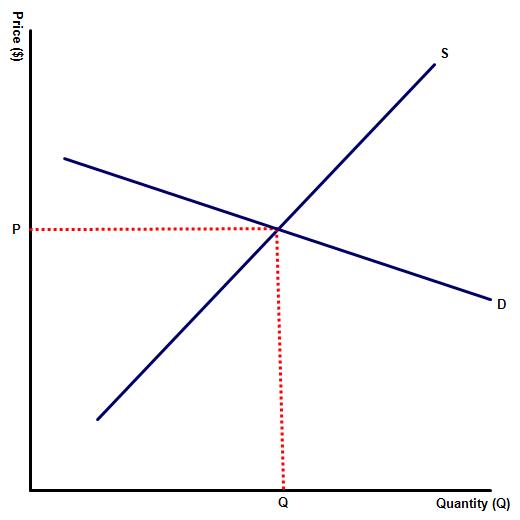
Diagram two illustrates the market for a product with unitary PES and elastic PED - PES < PED.
(a) Illustrate the impact of a specific (flat rate) tax on the good, indicating the size of the indirect tax.
(b) Draw the new equilibrium price and quantity.
(c) Illustrate the burden of tax paid by both the producer and the consumer.
(d) Which stakeholder pays the higher tax burden - the producer or the consumer? Explain your answer.
In this example, most of the burden of taxation falls on the producer, as many consumers will simply respond to the higher price by not purchasing it. Unlike our good in diagram one the producer cannot simply pass the majority of the additional production cost onto the consumer.
Activity 3
(a) The table below includes a list of products that many government apply specific taxes to. Complete the table, describing whether the product is PED elastic, PED inelastic or has unitary elasticity? What do you notice about the PEDs of the products that you have identified?
| Good or service | PES | PED | Tax primarily paid by the producer or consumer |
| Cigarettes / tobacco products | Elastic | Inelastic | Consumer in the form of higher prices and lost consumer surplus |
| Alcoholic beverages | Elastic | Inelastic | Consumer in the form of higher prices and lost consumer surplus |
| Petrol / fuel | Relatively inelastic | Inelastic | Consumer in the form of higher prices and lost consumer surplus |
| Concert tickets | Perfectly inelastic | elastic | Only the producer through lost sales |
| Sugary drinks / fast foods | Elastic | Inelastic | Consumer in the form of higher prices and lost consumer surplus |
(b) Draw a flat rate tax on the diagrams below, shifting the supply curves to the left (the new supply should be drawn parallel to the original supply curve).
(c) Indicate the tax revenue collected for each product. What do you notice about the two diagrams? If you have draw each correctly then the level of tax collected should be greater for the PED inelastic diagram?
Hint:
While governments will regularly comment that the high level of sales tax on products such as tobacco, alcohol and petrol is in the public interest as the tax is important to regulate and restrict sales of those products, many of you should have also noted that these products are highly price inelastic, meaning that the government receives significant revenue from taxing those goods.
Activity 4
Watch the following short video before answering the questions that follow:
1. Calculate the level of tax paid (per unit) at the following prices: $ 40, $ 60, $ 90, $ 135, $ 195, $ 270 when the rate of sales tax is 17.5%.
$ 40 - $7
$ 60 - $ 10.50
$ 90 - % 15.75
$ 135 - $ 23.63
$ 195 - $ 34.13
$ 270 - $ 42.75
Activity 5
(a) Use the information contained in the diagram below to calculate the values in questions i-iv
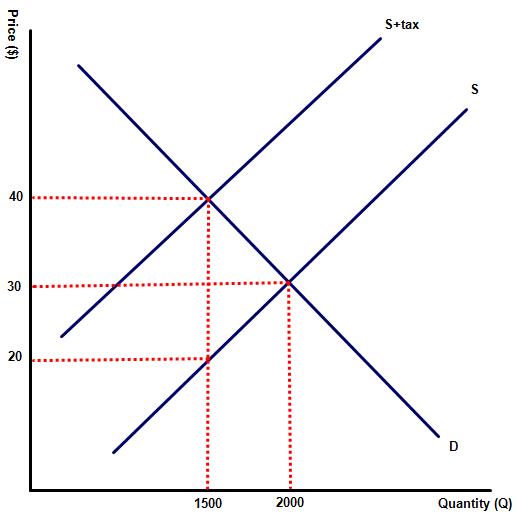
- Government revenue
(40-20) x 1,500 = $30,000
- Producer Revenue
20 x 1,500 = $ 30,000
- Revenue Loss
(30 x 2,000) - 30,000 = $ 30,000
- Deadweight welfare loss
((40-20) x (2,000-1,500)) / 2 = $ 5,000
(b) Use the information contained in the diagram below to calculate the values in questions i-iv
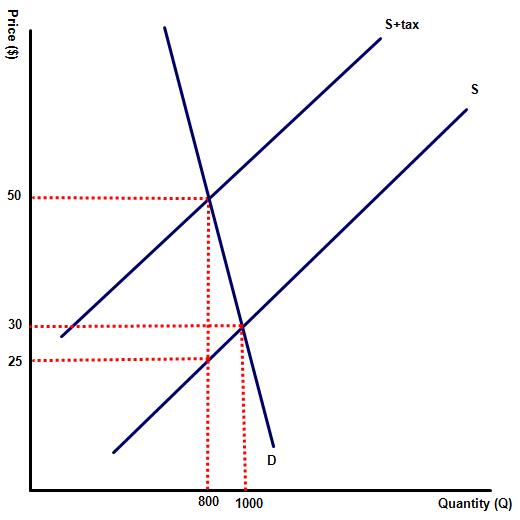 Government revenue
(50-25) x 800 = $ 20,000
- Producer Revenue
25 x 800 = $ 20,000
- Revenue Loss
(30 x 1,000) - (25 x 800) = $ 10,000
- Deadweight welfare loss
 Activity 6
In the EU, as in other parts of the world, governments have used indirect taxes as part of an overall policy to reduce the number of car journeys. This forms part of an overall strategy to reduce traffic congestion and reduce the number of people involved in road accidents. Interestingly the amount of tax revenue collected from taxes on fuel is between 3 to 4 times higher than the tax revenue collected from a sales tax on new car sales. Suggest possible reasons for this?
There may be a number of reasons but a significant one is surely the relative price elasticity of the two products. Cars are a luxury good and so are PED elastic. A tax on cars would raise very little tax revenue but would have a significant impact on the car industry. By contrast a tax on fuel generates a lot of tax revenue as fuel is PED inelastic (a necessity good for all car owners).
Activity 7
The UK has one of the highest prices of tobacco in Europe, as highlighted by the following table:
Fiscal year | Price of cigarettes £ (pack of 20) | Total cigarette sales (b) | PED of cigarettes |
2012 - 13 | 7.72 | 38.5 | - |
2013 - 14 | 8.23 | 37 | 3.9 / 6.6 = 0.59 |
2014 - 15 | 9.16 | 35.3 | 4.6 / 11.3 = 0.41 |
2015 - 16 | 9.40 | 35.1 | 0.57 / 2.62 = 0.22 |
2016 - 17 | 9.91 | 34.2 | 2.56 / 5.42 = 0.47 |
2017 - 18 | 10.7 | 32.6 | 4.68 / 7.97 = 0.59 |
(a) Calculate the PED for cigarettes from the information provided above and comment on your findings.
Unsurprisingly, cigarette consumption in the UK appears to be PED inelastic, reducing the effectiveness of the governments attempts to cut consumption rates.
Fiscal year | Revenue generated (£b) | Lost revenue from illegal tobacco sales (£b) |
2012 - 13 | 9.7 | 2.8 |
2013 - 14 | 9.5 | 3.0 |
2014 - 15 | 9.5 | 2.3 |
2015 - 16 | 9.5 | 3.0 |
2016 - 17 | 8.9 | 3.1 |
(b) Highlight the challenges faced by illegal cigarette sales to governments trying to collect sales revenue as well as reduce the consumption of tobacco sales.
Activity 8: Reflection
Start by watching the following short video before making notes under the headings which follow.
Factors to consider when considering the effectiveness of a tax on tobacco:
- What are the potential unintended consequences of the tax?
Impacts on third parties, sellers of tobacco products and bars, consumption habits e.t.c
- How much tax revenue will be generated and what it will be used for?
Taxing a PED inelastic good such as tobacco raises sufficient funds to provide public services e.g. taxing cars to pay for improvements in public transport or taxing tobacco and junk food to pay for improved health care.
- What is the impact of the tax on businesses?
A tax imposes additional costs on businesses and higher costs on the consumer. The % burden depends on the relative PES and PED elasticity of the product.
- What are the consequences for income equality / income distribution?
Sales taxes are generally regressive and hurt families on low incomes more than the wealthy.
 Activity 9: Link to the assessment
Part (a)
Explain how the incidence of an indirect tax depends on the relative price elasticity of demand and price elasticity of supply for the product. [10 marks]
Command term: Explain
Key terms: PED, PES, incidence of tax
The relationship can be explained as follows:
When the PES of a good or service is more elastic than its PED, it is the consumer that has the greater tax burden.
In incidences where the PED of a product is more elastic than the PES, producers have the greater tax burden.
Part (b)
Using real world examples, discuss the consequences of a government imposing an indirect sugar tax on unhealthy food and beverages. [15 marks]
 Command term: Discuss
The command term is discuss which means that responses must address all sides of this argument, for example both the short and long term impact on consumption of the sugar tax. Many unhealthy foods and beverages are addictive and so PED inelastic in the short run. Supporters of this policy hoping to see an immediate fall in consumption rates will be disappointed. However, it is more likely to be effective in the long run as consumer habits change over time. Sugar taxes have been applied in a small number of countries including UK, Mexico, France and Norway.
Another advantage of the tax is that the tax revenue can be used to fund healthy eating programmes or community sport as is the case in some of those nations that have implemented the tax.
However, a sugar tax has its critics, for instance some have called the tax a tax on the poor - sales taxes are regressive. There are also critics who argue that such a policy is an infringement on a consumer's right to choose what to consume.Governments collect tax for two primary reasons. The first is to reduce consumption of undesirable goods and services. Examples of this include petrol for personal cars, alcohol and tobacco products. However, they also wish to collect as much tax revenue as possible. In this scenario governments may be more inclined to place an indirect tax on a good or service with inelastic PED as the revenue collected will be greater.
10. Homework / revision exercise
Using appropriate diagrams, explain how the relative PED and PES for a product determines the burden of indirect taxation on producers and consumers. [10 marks]
Key terms to define: indirect tax, price elasticity of demand and price elasticity of supply.
Responses should also include:
Diagrams showing products with different PED elasticity and an explanation of how this impacts on the proportion of sales tax paid by both consumers and producers - in incidences where the PED elasticity for a good is higher than PES, the incidence of the tax falls primarily on the producer.
When a good has a lower PED than PES, the incidence of the tax falls primarily on the consumer.
An explanation that a sales tax will raise the selling price of a good or service and the producer will try to pass on the burden of the tax towards the consumer in the form of higher prices. Firms producing goods and services where the PED is greater than the PES will find this difficult as the consumer reduces their consumption significantly in response to a rise in price. This should be illustrated with a diagram (above and to the right), showing a left shift in the supply curve and a significant reduction in quantity demanded. Responses should also show on their diagram that the burden paid by the producer is greater than that paid by the consumer.
Sales will also fall for goods and services where the PED is smaller than the PES but by a smaller amount, forcing consumers to pay most of the burden through higher prices. Illustrated by the diagram below and to the left.
Responses should then describe how the burden of tax paid by both producers and consumers is equal for goods and services where the PED of the product = it's PES - diagram below and to the right.
Responses should also include examples of goods with different price elasticity of demand.
Responses for section (a) should be graded according to the following mark bands:
Maximum mark for this section 10.
Level | Description | Mark |
0 | The response is below the minimum standards described below. | 0 |
1 | Demerit goods, externalities and specific sales taxes are not defined or are defined incorrectly. The response fails to include a relevant diagram, illustrating the welfare loss resulting from over consumption of car journeys in the city, or the diagram is unclear / inaccurate. The response provides only a basic understanding of how the imposition of a specific tax can reduce the number of car journeys. The concepts of MSC, MPC or socially optimum output are not included in the response or are explained poorly. The response contains significant errors. | 1 - 3 |
2 | At least two of demerit goods, externalities or specific sales taxes are defined correctly. The response includes a relevant diagram, showing that a specific sales tax will reduce supply but the area of welfare loss or socially optimum output level is missing or unclear. The response provides a limited understanding of how the imposition of a specific tax reduces the number of car journeys. For example the response might state that increasing taxes will reduce the supply of cars in the city but not use economic terminology. The response contains some minor errors. | 4 - 6 |
3 | Demerit goods, externalities and specific sales taxes are accurately defined. The response includes a relevant diagram, with MSC, MPC, welfare loss and the socially optimum output level included. The diagram is dynamic, illustrating a left shift in supply and illustrates how the imposition of a specific tax can reduce the number of car journeys made in a city. The diagram is explained and answers the specific requirements of the question. The response contains some minor errors. | 7 - 8 |
4 | Demerit goods, externalities and specific sales taxes are accurately defined. The response includes a correctly labelled diagram, showing a left shift in supply and includes MSC, MPC, welfare loss and the socially optimum output level. The diagram and following explanation clearly illustrates how the imposition of a specific tax can reduce the number of car journeys made in a city. The response skilfully applies relevant economic theory to the question. The response includes alternative policies that a government may employ to reduce pollution e.g. legislation or improved public transport links. Any errors are minor and do not detract from the overall quality of the response. | 9 - 10 |
The question can be accessed at: ![]() Question on tax and PED
Question on tax and PED
The question and mark scheme are available as a PDF at: ![]() Revision exercise on tax and PED
Revision exercise on tax and PED
 Twitter
 Facebook
 LinkedIn