 IB Docs (2) Team

Unit 4.2/4.3 Trade protectionism
Whilst most economists see a very strong case for free trade between countries, most countries use trade barriers to restrict free trade. The following types of trade barriers are covered in this chapter: tariffs, quotas, subsidies and administrative barriers.
Types of trade protection:
- Tariffs
- Quotas
- Subsidies
- Administrative barriers
Diagrams showing the effects of tariffs, quotas and subsidies on different stakeholders
Arguments for trade protectionism:
- Infant (sunrise) industries
- National security
- Health and safety
- Environmental standards
- Anti-dumping and unfair competition
- Balance of payments deficit
- Government revenue
- Protect employment
- Economically least developed country (ELDC) diversification
Revision material
![]() The link to the attached pdf is revision material from Unit 4.2/4.3 Trade protectionism. The revision material can be downloaded as a student handout.
The link to the attached pdf is revision material from Unit 4.2/4.3 Trade protectionism. The revision material can be downloaded as a student handout.
Types of trade barriers
Whilst most economists see a very strong case for free trade between countries, most countries use trade barriers to restrict free trade. The following types of trade barriers are covered in this chapter:
- Tariffs
- Quotas
- Subsidies
- Administrative barriers
Tariffs
Nature of tariffs
Tariffs are taxes put on imported goods as they enter the domestic economy and have to be paid by the individual or organisation importing the good. For example, the European Union charges a 10 per cent tariff on cars. This means a $25,000 Japanese Toyota car would have a $2,500 tariff levied on it, which would be paid by the car dealing business that imported the car. The car dealer will try to pass on some or all the $2,500 tariff to the buyer of the car, but their ability to do this will depend on the price elasticity of demand for the good. Tariffs can be a significant form of government tax revenue and last year $75 billion of tariff revenue was paid on goods entering the US economy.
Graphical analysis of a tariff
Import tariffs can be a percentage ad valorem tax or they can be levied at a specific amount. In this example, we are going to use the US government putting a specific tariff on imported solar panels. The level of tariff the US government has imposed is a $40 per unit tariff on each imported solar panel.
 The market for imported goods
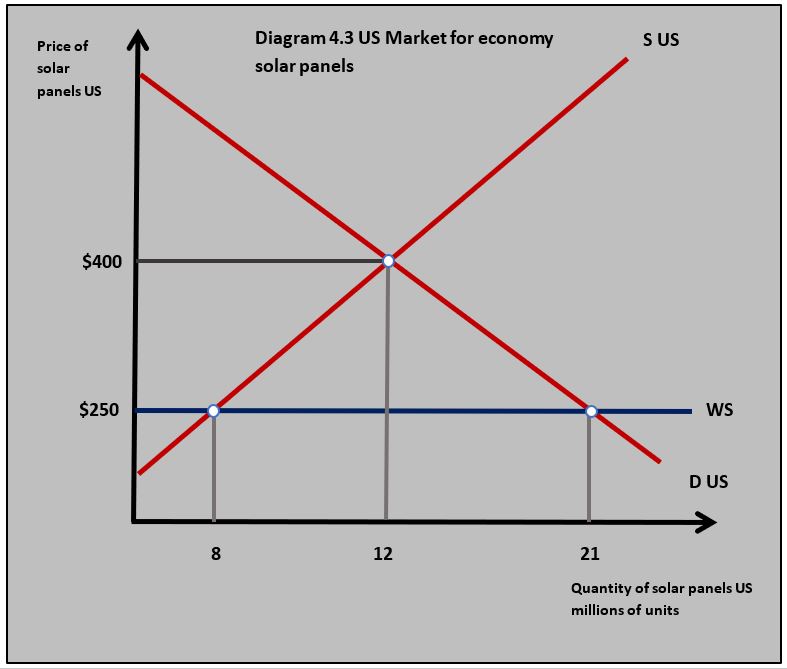
In diagram 4.3 the domestic demand and supply for solar panels would give a market price for solar panels of $400. By importing solar panels, consumers can buy them at $250 which is the world price. The world price is determined by the global demand and supply for solar panels. The world supply is shown by WS in diagram 4.3.
At the world price for solar panels quantity demanded for solar panels in the US is 21 million units. US suppliers of solar panels who can sell at the world price of $250 will supply the US domestic market with 8 million units. This means the US economy will import 13 million units of solar panels (21m – 8m = 13m)
Adding the tariff
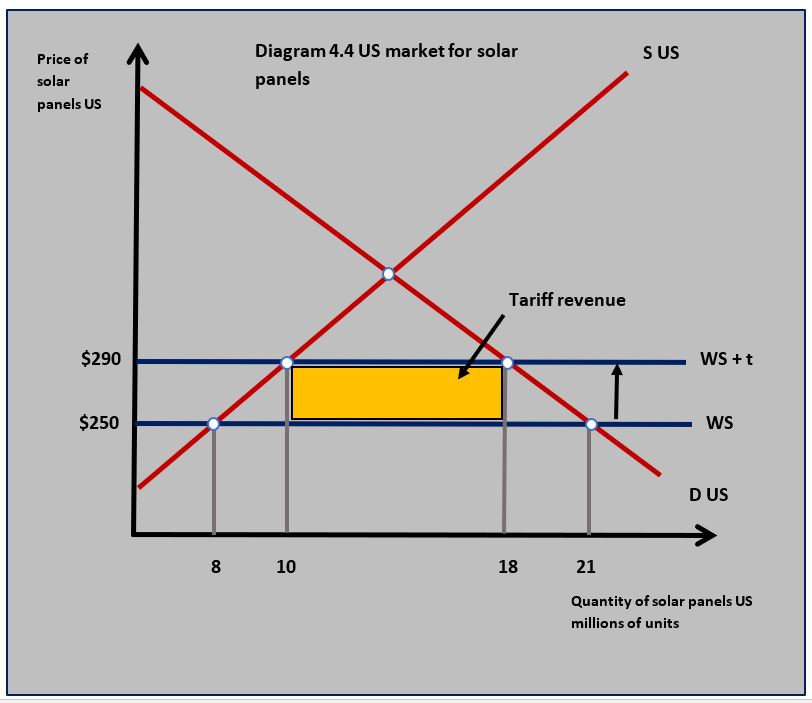 Adding a $40 tariff per unit to solar panels increases the world supply price and shifts WS up to WS + t to a price of $290. At the higher price of $290 US quantity demanded will fall to 18 million units and the domestic US quantity supplied increases to 10 million units. The increase in price to $290 means more US solar panel suppliers can make a profit and cover their costs. As US solar panel quantity demanded falls and quantity supplied rises, the quantity imported falls to 8 million units (18m – 10m = 8m).
As well as reducing the quantity of imports, one of the key benefits of tariffs is they raise revenue for the government. This is calculated by multiplying the quantity imported by the value of the tariff. In diagram 4.4 this is shown by the yellow shaded area and is calculated as:
8m x $40 = $320m
The problem with tariffs is they do not necessarily reduce the volume of imports as much as the government would like if the demand and supply for the imported good are price inelastic, although the tariff revenue earned may be significant.
Impact on stakeholders
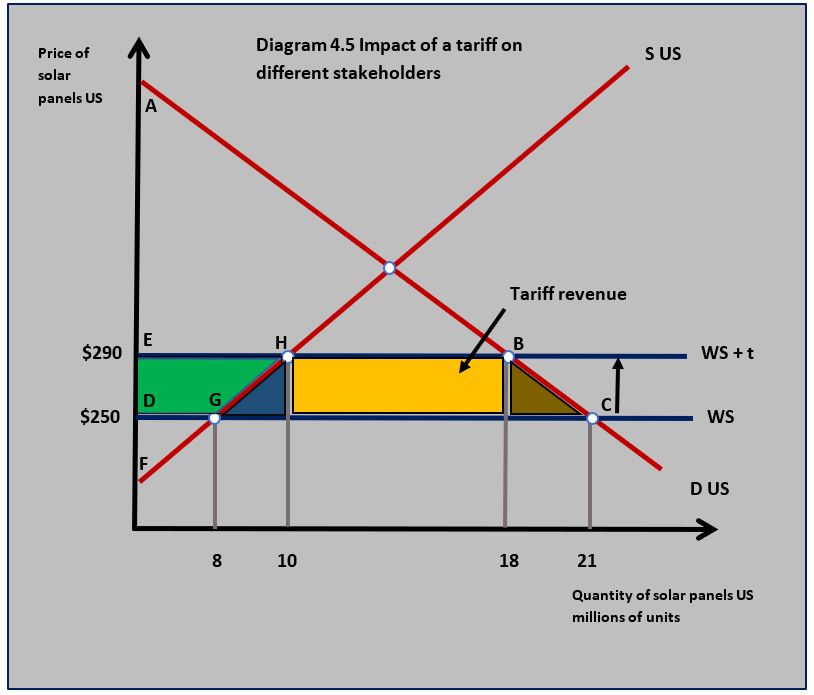 When a government puts a tariff on a good it impacts domestic consumers, domestic producers and the government. There will also be an impact on foreign producers and overall social welfare. In our US solar panel example, we can examine the impact of the tariff on the different stakeholders by using diagram 4.5.
The impacts on the different stakeholders are:
- There is a fall in the consumer surplus from area ACD before the tariff to area ABE after the tariff is imposed. This means the loss of consumer surplus caused by the increase in the price of the solar panels is area EBCD. Domestic US consumers lose surplus and are worse off because of higher prices.
- Domestic producers gain as their surplus increases from area DGF to area FEH. This gain is shown by the green shaded area in diagram 4.5. Some of this gain will be existing producers earning a great surplus and some will be new producers entering the solar panel market.
- The yellow shaded rectangle will be the gain in US government revenue resulting from the tariff.
- The blue shaded triangle is called a welfare loss. This is the cost of inefficient domestic producers who enter the market for solar panels, but who are only in the market because of the tariff and would not be competitive enough to supply solar panels under normal market conditions.
- The brown shaded triangle is also a welfare loss. This is the loss of consumer surplus from people who no longer buy solar panels. Their loss of surplus is not gained by domestic producers or by the government as tariff revenue.
- Overall, the US economy would suffer a net welfare loss as a result of the tariff.
- The price elasticity of demand and supply of solar panels will determine the size of the changes in consumer and producer surplus, as well as the government tariff revenue and respective welfare losses.
- The advantage of using tariffs is they can reduce imports and also raise government tax revenue.
 The Bahamas is the Caribbean’s richest country and it also has the world’s highest import tariffs. This is despite the fact the Bahamas is very dependent on imports with a trade deficit of $7.781bn. The average rate of import tax in the Bahamas is an ‘eye-watering’ 35% and the Government raises 60% of its tax income from import taxes. Interestingly the Bahamas has zero income tax which makes it a haven for rich tax exiles who enjoy the beach and sunshine lifestyle of the island. The Bahamas also has a flourishing market for luxury Yachts and beach-front mansions.
Import tariffs are a regressive tax and high rates make it tough for the local residents on the island who have to live on modest incomes. As one resident said 'imported food is just so expensive.'
Questions
a. Define the term tariff. [2]
Tariffs are taxes put on imported goods as they enter the domestic economy and have to be paid by the individual or organisation importing the good.
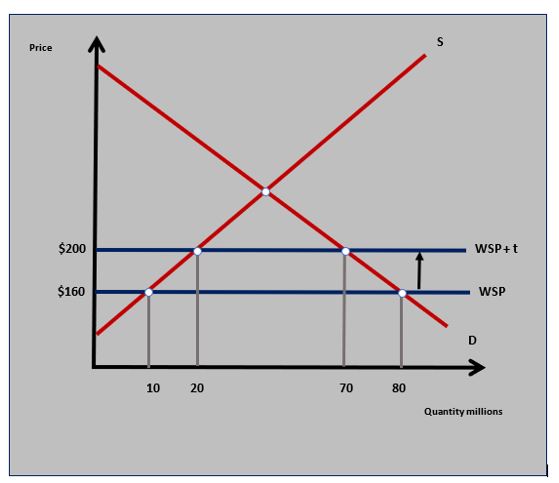
 b. The diagram shows the domestic market for bicycles in the Bahamas. The government has imposed a tariff on imported bicycles.
(i) Change in quantity of bicycles imported as a result of the tariff. [2]
10,000 (14,000 – 4,000) – (11,000 – 6,000) 5,000 = 5,000 units
(ii) Value of the tariff revenue. [2]
5,000 x $15 = $75,000
(iii) Value of the fall in consumer surplus resulting from the tariff. [2]
(11,000 x $15) + (3,000 x $15/2) = $187,500
(iv) Value of the gain in domestic producer surplus resulting from the tariff. [2]
(4,000 x $15) + (2,000 x $15/2) = $75,000
(v) Value of the total welfare loss resulting from the tariff. [2]
(2,000 x $15/2) + (3,000 x $15/2) = $37,500
b. Explain the two welfare loss triangles associated with the imposition of a tariff on bicycles in the Bahamas. [4]
- The yellow triangle is a welfare loss associated with the cost of inefficient domestic producers in the market for bicycles who could not compete in the market when there were no tariffs. These costs occur because of the tariff and are therefore a welfare loss.
- The green triangle is a welfare loss because it represents the loss of consumer surplus of bicycle buyers who no longer buy them because the tariff increases the price of the bicycles above the level the buyers are prepared to pay.
c. Explain why a tariff might be considered to be a regressive tax. [4]
A regressive tax means households on lower incomes pay a higher proportion of their income in tax than those on higher incomes. The tariffs on bicycles in the Bahamas are a regressive tax because the $15 tariff on a bike would be a higher proportion of someone's income who is earning $10,000 per year than it would be on someone earning $100,000 per year.
Investigation
Research the import tariffs on three goods the Bahamas imports.
Quotas
A quota is a method of trade protection where a domestic government sets either a value or a quantity limit on imported goods into the domestic economy. The benefit of quotas over tariffs is that effective quotas will reduce the value or quantity of imports by a set amount and do not rely on an increase in price decreasing the domestic quantity demanded.
Adding a quota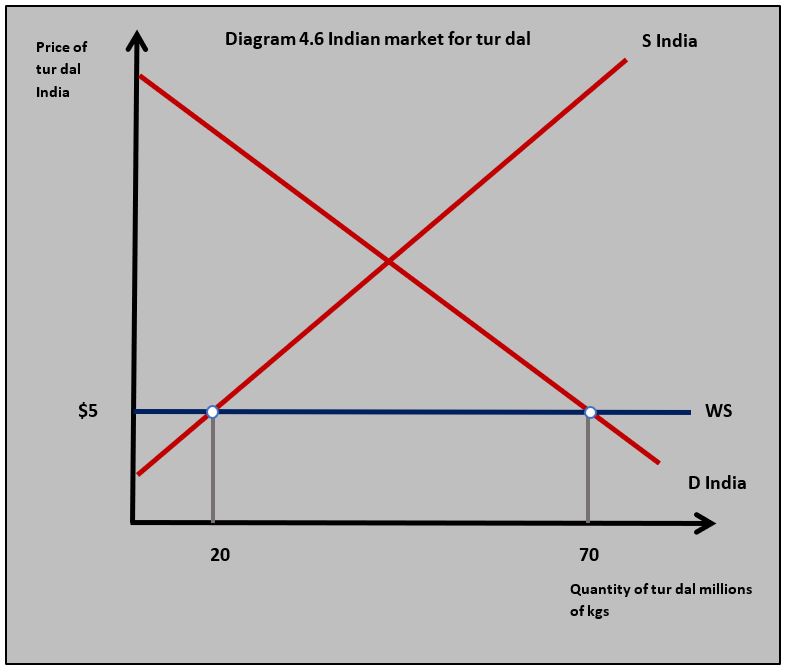
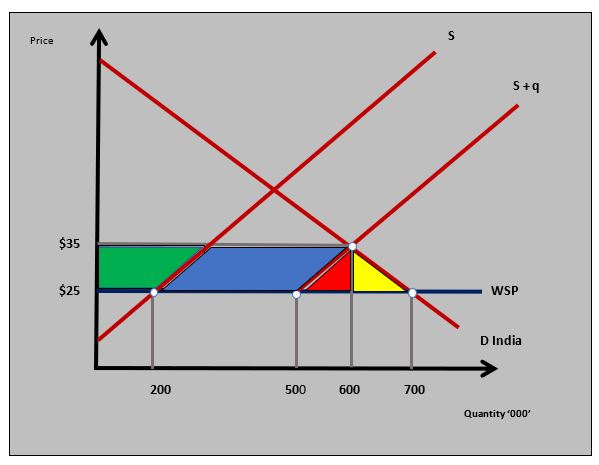
An example of the use of a quota is tur dal quotas imposed by the Indian government. Tur dal is a lentil used in cooking and is a basic staple food. Diagram 4.6 shows the market for tur dal in India. The world price is $5 per kg which means India’s domestic supply is 20 million kgs and domestic demand is 70 million kgs. This results in 50 million kgs of tur dal being imported into India.
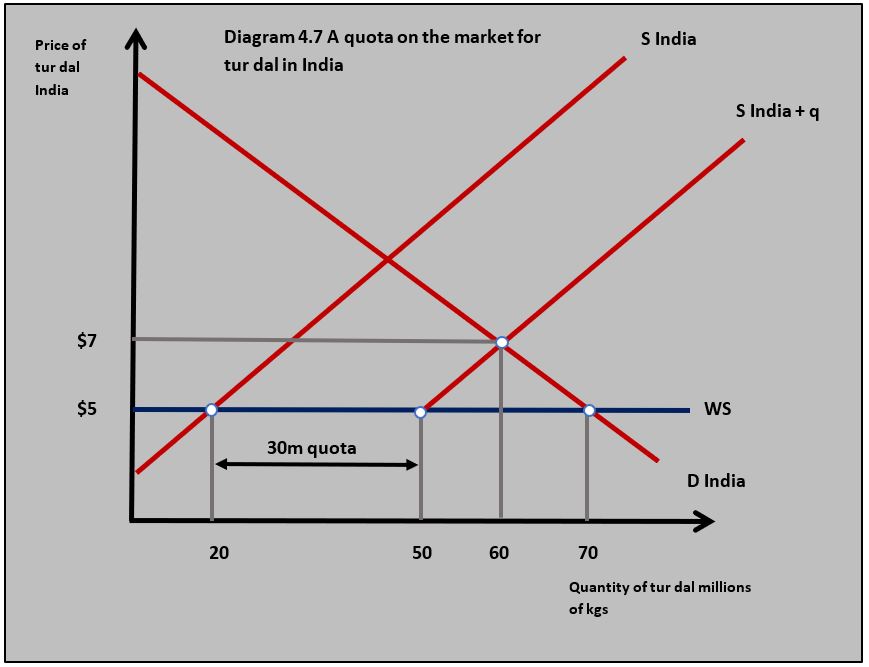 If the Indian government set a quota on tur dal of 30 million kgs to reduce the quantity imported from 50 million kgs to 30 million kgs. Diagram 4.7 illustrates the impact of the quota on the market for tur dal in India. The 30 million tur dal quota is added to India’s domestic supply to give the domestic market supply for tur dal, S India + q. The market equilibrium for tur dal in India is where D India = S India + q at a price of $7 and a quantity of 60 million kgs. This means that domestic supply from India is 30 million kgs with 30 million kgs imported.
Impact on stakeholders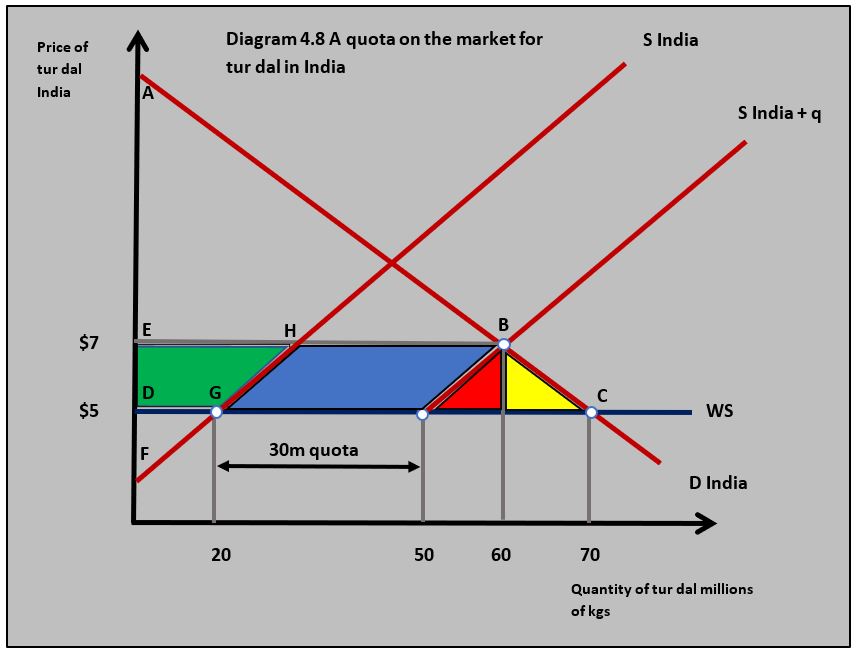
The imposition of the quota has an impact on domestic consumers, producers and the government. It will also affect foreign producers and overall welfare in society.
Diagram 4.8 examines the impact of the quota on different stakeholders:
- There is a fall in the consumer surplus when the quota is imposed from area ACD to area ABE. This means the loss of consumer surplus caused by the increase in the price of the tar dal is area EBCD. The domestic Indian consumer loses surplus and is worse off because of the increase in the price of tur dal.
- Domestic producers gain as their surplus increases from area DGF to area FEH. This gain is shown by the green shaded area on the diagram. Some of this will be existing producers gaining an increase in surplus and some will be new producers gaining surplus as they enter the tur dal market.
- The blue shaded area is the increase in producer surplus of foreign suppliers of tur dal.
- The red shaded triangle is a welfare loss. This is the cost of inefficient domestic tur dal producers who enter the market and would not be competitive enough under normal market conditions without the quota.
- The yellow shaded triangle is also a welfare loss. This is the loss of the consumer surplus of consumers who no longer buy tur dal. Their loss of surplus is not gained by the domestic or foreign producers and is lost to society.
- Overall, the Indian economy would suffer a net welfare loss as a result of the quota.
- The price elasticity of demand and supply of tur dal will determine the changes in consumer and producer surpluses and respective welfare losses.
- Quotas are more likely to achieve the aim of reducing imports than tariffs because they do not rely on a fall in the quantity demanded by consumers. However, they do not raise revenue and can be subject to corruption because customs officials have to decide which goods can be imported and which cannot.
 China has announced that it is to increase the import quota it imposes on Australian wool from 36,000 tonnes to 38,000. This is part of reducing trade tensions between the two countries' governments and gives opportunities to stakeholders in both countries. Wool producers in Australia will be able to increase their revenues by selling more in the Chinese market. An Australian Wool Growers spokesperson said 'we see this as a positive move for our wool farmers'.
Chinese clothing manufacturers also welcomed the move because it gives them better access the high-quality quality wool from Australia.
Questions
a. Outline the meaning of an increase in the import quota China allows on imported Australian wool. [2]
By increasing the import quota on Australian wool the Chinese government is allowing an increase in the quantity of imported wool from Australia from 36,000 tonnes to 38,000 tonnes.
b. Using a diagram, explain the impact the 38,000-tonne Chinese import quota on wool might have on the market price and quantity of wool imported into China compared to a situation of zero quotas. [4]
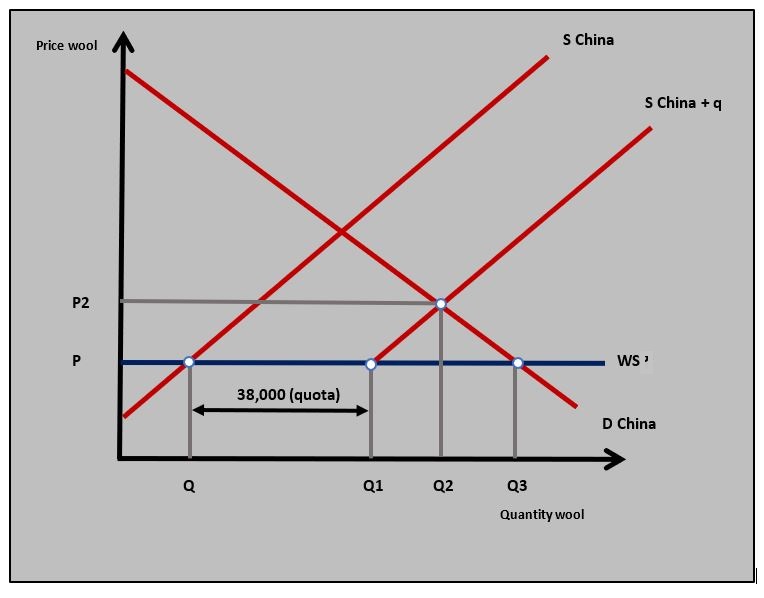 The wool quota means the supply of imported wool into China will be reduced. The diagram shows how the market price of wool in China will rise from P to P2 and the quantity of wool imported will fall from Q - Q3 to Q - Q1(38,000 tonnes).
c. Using a demand and supply diagram for clothing, explain the effect an increase in China's import quota on wool from Australia will have on the price of Chinese clothing produced using wool. [4]
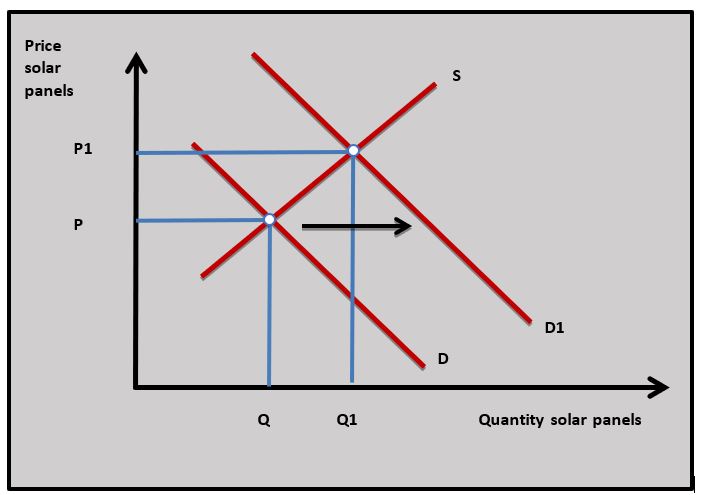
.jpg) An increase in China's wool quota will mean more imported wool from Australia will enter the Chinese wool market which will cause the price of wool to fall in China. The fall in the price of wool will reduce the cost of clothing manufacturers that use wool. The diagram shows how this will cause the supply curve for wool clothing in China to shift from S to S1 which reduces the market price from P to P1 and increases output from Q to Q1.
An increase in China's wool quota will mean more imported wool from Australia will enter the Chinese wool market which will cause the price of wool to fall in China. The fall in the price of wool will reduce the cost of clothing manufacturers that use wool. The diagram shows how this will cause the supply curve for wool clothing in China to shift from S to S1 which reduces the market price from P to P1 and increases output from Q to Q1.
Investigation
Research into another country that uses quotas to protect a domestic market.
Subsidies
Nature of trade subsidies
By subsidising domestic producers, governments are giving their producers a cost advantage over foreign producers which acts as a trade barrier. The advantage of subsidies is they can be used as a ‘hidden’ trade barrier because they do not directly restrict imports and governments can claim they are just supporting a key industry rather than restricting trade. Subsidies on domestic firms can also be used to help domestic exporters by giving them a cost advantage in overseas markets. The disadvantage of subsidies is they have to be paid for by using government funds.
Graphical analysis of a trade subsidy
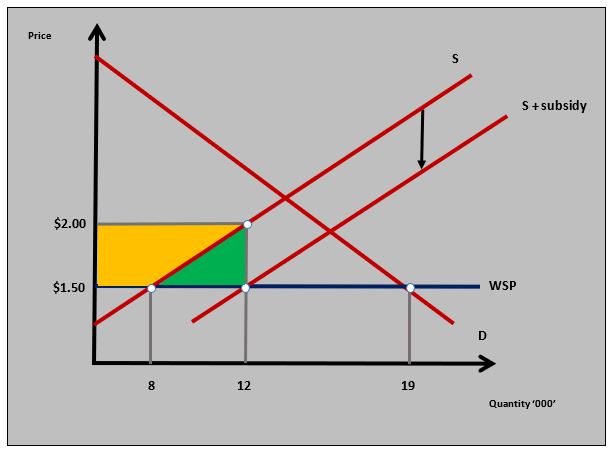
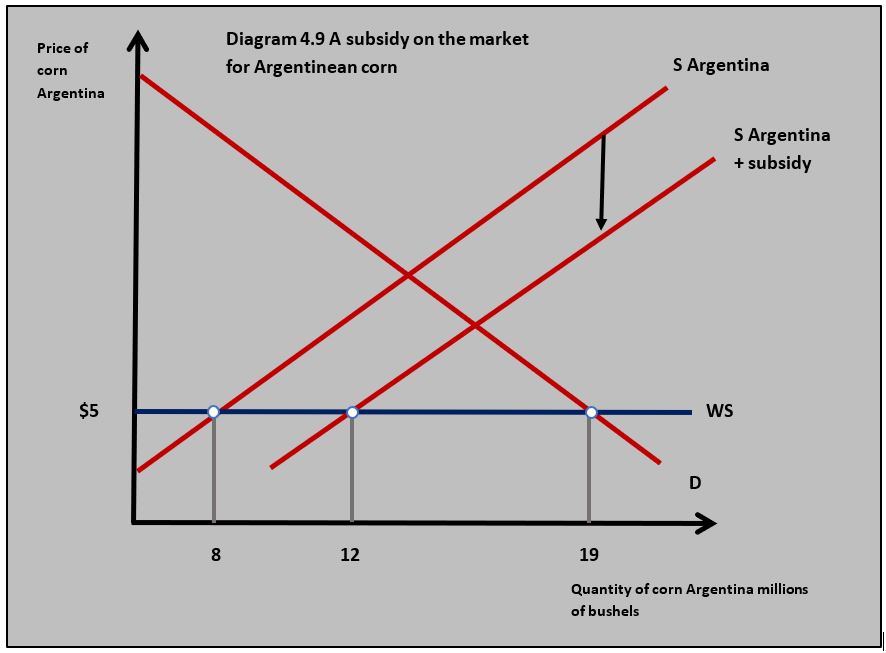 Diagram 4.9 shows the domestic market for corn in Argentina. In this example, the world price of corn is $5 per bushel with an Argentinean domestic supply of 8 million bushels and domestic demand of 19 million bushels. This means Argentina imports 11 million bushels of corn. If the Argentinian government pays a subsidy to its corn farmers of $2 per bushel the domestic supply of corn shifts downwards by the amount of the subsidy, and the quantity of corn domestically produced corn increases to 12 million bushels. The quantity of imported corn into Argentina falls to 7 million bushels.
Impact on stakeholders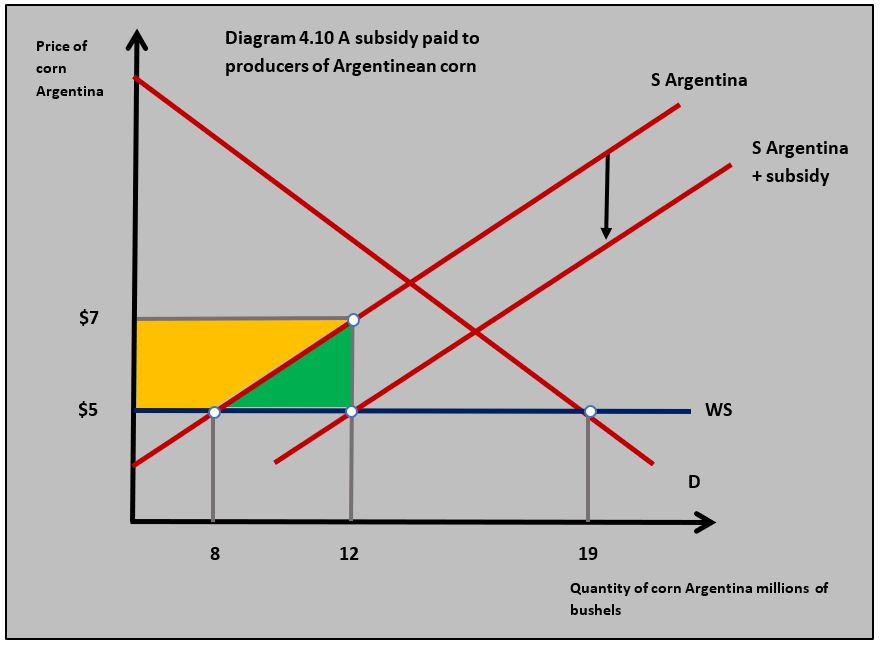
The payment of a subsidy to domestic producers has an impact on domestic consumers, producers and the government. It will also affect foreign producers and overall welfare in society.
Diagram 4.10 examines the impact of the subsidy on different stakeholders:
- Domestic producers gain from the subsidy as their total revenue increases from $40 million (5m x $8) to $84 million ($7 x 12). This increases their producer surplus by the yellow shaded area in diagram 4.10.
- The government loses because they have to pay the subsidy which is $24 million ($2 x 12m). This will lead to an opportunity cost in terms of other areas of government expenditure or higher taxation.
- The green-shaded triangle is a welfare loss. This is the loss that occurs because of the costs of inefficient domestic corn producers who enter the market and can only maintain their position because of the subsidy they receive from the government.
- Domestic consumers will not be affected by the subsidy because the price of corn in the Argentinian market does not change.
- The price elasticity of supply corn will determine the change in the Argentinian producer surplus, the subsidy the government pays and the size of the welfare loss.
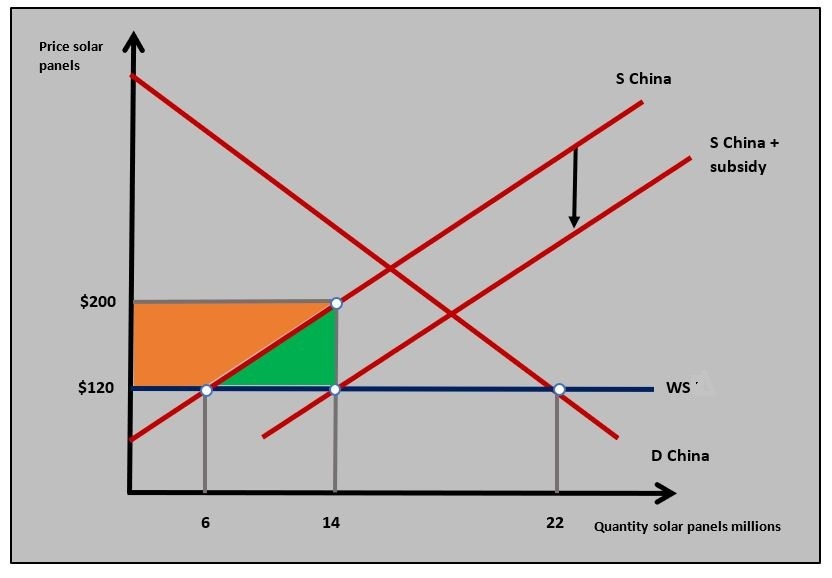 In September 2020 President Xi Jinping announced this week that China’s carbon emissions would peak in 2030 and the country would become carbon neutral by 2060. Part of the Chinese strategy to reduce carbon emissions is increased investment in renewable energy and particularly solar power. One aspect of developing solar power is the subsidies paid by the Chinese government to solar panel manufacturers.
But a problem with this approach is that other countries in the world see this as a protectionist measure to support China’s solar panel industry. The diagram shows the effect of subsidies paid to China’s solar panel producers.
 Worksheet questions
Questions
a. Using the information in the diagram calculate:
(i) The fall in the value of imports of solar panels entering China. [2]
8 million x $120 = $960 million
(ii) Value of the subsidy per unit paid to China’s producers. [2]
$200 -$120 = $80
(iii) Total value of the subsidy paid by the Chinese government. [2]
14 million x $80 = $1,120 million
(iv) Increase in the value of producer surplus of China’s solar panel producers. [2]
(6 million x $80) + ((8 million x $80 /2) = $800 million
(v) Value of the welfare loss of the subsidy. [2]
8 million x $80 / 2 = $320 million
b. Using the data provided and your knowledge of economics, recommend a policy the Chinese government could use to support the growth of its renewable energy industry. [10]
Answers might include:
- An explanation of how protectionist methods such as tariffs, quotas and subsidies can be used to reduce the quantity of imports that compete against China’s sustainable energy.
- Use of the data from the subsidy diagram to illustrate the impact of a subsidy
 on the solar panel market in China.
 - An explanation of a policy to increase the demand for renewable energy such as state-funded advertising and promotion.
- Diagram to show a policy to support the renewable energy industry from government promotion of the industry which increases the demand for solar panels in the diagram from D to D1.
- An explanation of other interventionist supply-side approaches such as government investment in infrastructure along with education and training that might support the renewable energy sector.
- An explanation of market-based supply-side approaches that could be used by the Chinese government to support the sustainable energy industry such as tax cuts and deregulation which might encourage growth and innovation.
- An evaluation of the impact of the different policy approaches. This might include discussion of the problems of protectionism such as retaliation and the cost of a subsidy; the cost to the government of spending on infrastructure and education and training; and the loss of income from tax cuts.
- Recommendation of the approach the government might use.
Investigation
Investigate another country that uses subsidies to protect a domestic market.
Export subsidies
Nature of export subsidies
Export subsidies are a payment made by the government to producers on each unit they export. The aim of a government using an export subsidy is to encourage domestic producers to increase the amount they export. By boosting exports, the government might try to support a particular industry, improve its balance of trade position and increase the foreign exchange the country earns.
Graphical example of an export subsidy
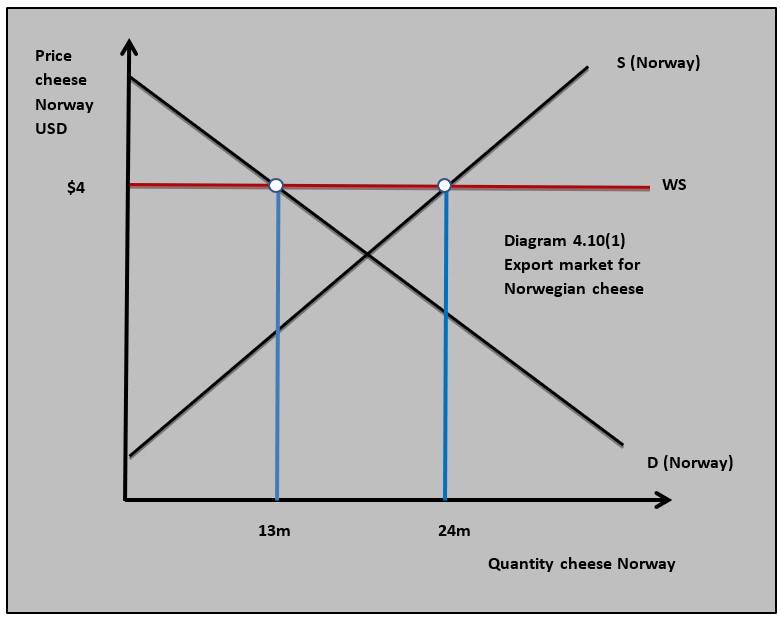 Diagram 4.10(1) illustrates the market for cheese in Norway with the quantity demanded domestically 13m units and the quantity supplied 24m units which means 11m units if cheese is exported.
Impact on stakeholders
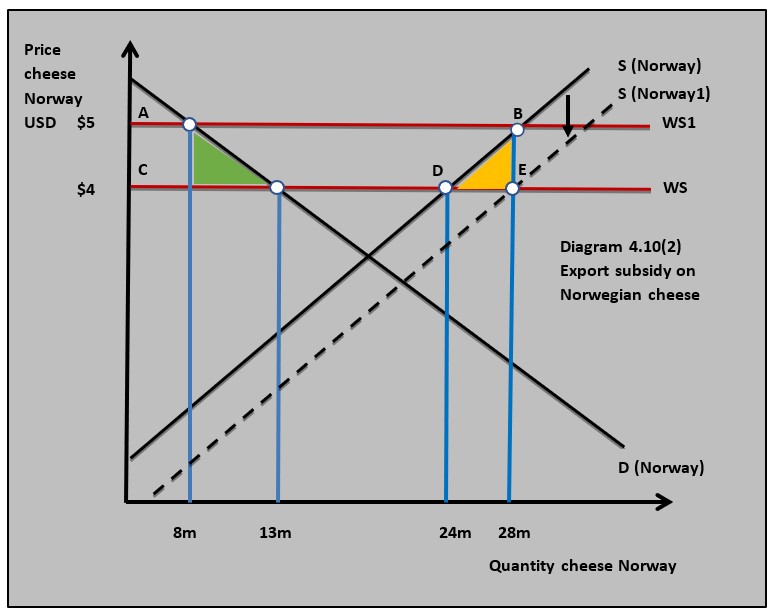 Diagram 4.10(2) illustrates the effect of a $1 export subsidy by the Norwegian government on exported cheese. This shifts the domestic supply curve downwards by $1 per unit from S(Norway) to S(Norway1).
The export subsidy has the following consequences for the different stakeholders:
- Because this is an export subsidy, the $1 subsidy is paid to Norwegian cheese producers to export cheese which means they will receive a price of $5 ($4 world price plus $1 subsidy) for each unit they export. The Norwegian cheese exporters will choose to export their cheese rather than sell it to the domestic market because they receive $5 rather than $4.
- At the world price plus the subsidy the new quantity supplied is 28m units and the new domestic quantity demanded in Norway is 8m units which mean the quantity of Norwegian cheese exported is 20m units.
- The subsidy benefits Norwegian cheese producers who gain producer surplus equal to area ABCD in the diagram. This will also create more employment in the Norwegian cheese market.
- There is a welfare loss because of the costs of inefficient Norwegian cheese drawn into the market. This is shown by the yellow shaded area in the diagram.
- The Norwegian government will have to pay the export subsidy which is the quantity exported multiplied by the subsidy (28m - 8m) x $1 = $20m.
- Norwegian consumers have to pay $5 ($1 more) more for their Cheese because of the export subsidy. This leads to a welfare loss of consumer surplus equal to the green shaded area in the diagram.
Administrative barriers
Administrative trade barriers are where the government imposes excessive rules, regulations and bureaucracy on imported goods. Governments can use administrative barriers to try and reduce imports and protect the country’s domestic producers. Administrative barriers can be used as 'hidden' trade restrictions to protect domestic producers and reduce the threat of other countries retaliating.
Bureaucracy
Governments sometimes put complicated, time-consuming bureaucracy in the way of imports which effectively acts as a trade barrier. The French government once directed the imports of electronics goods through a single customs post in a small town which greatly increased the processing time for imports and acted as a trade barrier.
Health and safety standards
Governments often impose strict health and safety standards on imported goods which act as trade barriers. The EU has banned the import of hormone-treated beef which acts as a trade barrier to US imported beef, much of which is hormone-treated.
Environmental standards
Governments can restrict the import of products that they claim do not meet set environmental standards. In the past, the US has restricted imported tuna from Mexico because they claimed the Mexican fishing boats used fishing nets that killed Dolphins.
Government contracts
Governments can restrict imports by only awarding government contracts to domestic firms. The US recently awarded the contract for the manufacture of all its military uniforms to US producers.
Patriotic or nationalistic campaigns
Governments can put pressure on their citizens to purchase domestically produced goods by making the purchase of imports seem unpatriotic. Japan is often seen as a country where their cultural pressure to buy domestically produced goods.
 Japan has relatively low tariffs on imported goods, but it is a difficult market for foreign exporters to enter. Firms trying to enter Japanese markets can come up against:
- Quality standards that are unique to Japan such as safety standards on imported cars.
- Exporters to Japan sometimes have to demonstrate prior experience of trading in Japan which makes it difficult for new entrants to the market.
- Regulations on goods often favour Japanese-produced products and discriminate against foreign products.
- It can be difficult for foreign firms to obtain licences to operate in Japan.
- Japanese businesses and consumers have strong cultural ties that foreign firms struggle to compete with.
Worksheet questions
Questions
a. Define the term administrative trade barrier. [2]
Administrative trade barriers are where the government imposes excessive rules, regulations and bureaucracy on imported goods.
b. Outline how two administrative trade barriers used by Japan to reduce the quantity of imports. [4]
Choose any two administrative barriers from:
- High safety standards on imported cars make it difficult for foreign manufacturers to enter the Japanese market.
- Limiting the licenses available to foreign manufacturers which they need to enter the Japanese market.
- Only allowing firms to import into the Japanese market who have previous experience of trading in Japan.
- Creating large amounts of bureaucracy for businesses that import into Japan.
c. Explain two reasons why the Japanese government might choose administrative trade barriers instead of tariffs or quotas. [4]
The Japanese government might choose administrative barriers because:
- They are not as official as tariffs and quotas are may not attract retaliation from other countries.
- They can be targeted at specific trade issues such as health and safety and product standards.
Investigation
Investigate the administrative trade barriers another country uses to reduce imports.
Reasons why governments restrict free trade
All governments around the world are involved in some form of protectionism. The extent of protectionism depends on the nature of the government and the political situation. For example, US trade policy over the last four years has been much more protectionist. The reasons why governments use protectionism are analysed below.
To protect new industries (infant/sunrise industry argument)
When a country is trying to develop an industrial base, governments put trade barriers in place to protect a new industry against foreign competition. This allows the domestic firm time to build the economies of scale needed to compete and become established in international markets. The electric vehicle battery industry in South Korea has been heavily subsidised in recent years to allow the market to become established.
Economically least developed country (ELDC) diversification
The use of trade barriers by economically less developed countries is seen as a development strategy similar to the infant industry argument. By using tariffs, quotas and subsidies ELDCs can diversify away from primary commodity production to growing markets in manufactured goods. For example, many African countries have used trade barriers to develop their renewable energy sectors such as manufacturing solar panels.
Declining industry (sunset industry argument)
 Industries are often in decline because they cannot compete with overseas producers. This has been the case with US steel producers who called for tariffs because of low-priced competition from Asia and Eastern Europe.
This type of approach is normally used because of the unemployment a decline in a major industry causes, along with regional deprivation where communities are adversely affected when an industry collapses. This has been the case in the ‘Rust Belt’ steel towns of the Midwest in the United States.
Unemployment
This can be linked to the previous point of protecting declining industries. Historically governments have often responded to a recession and rising unemployment by applying trade barriers. This was the case in the 1930s when the Great Depression led to increased protectionism amongst trading nations. The Smoot-Hawley Tariff Act of 1930 in the US raised tariffs on 20,000 imported products in an attempt to deal with the Great Depression.
To raise revenue
Tariffs can be a source of government finance, particularly for developing countries that find it difficult to raise revenue through direct and indirect taxation. The revenue raised depends on the price elasticity of demand for the imported product. If the product is price inelastic then the revenue raised will be significant, but this may well mean a tariff on a necessity product like imported food has a negative effect on poorer consumers in the developing country.
To deal with a balance of payments current account deficit
A government may respond to a deficit in its current account by putting trade barriers on imported goods and reducing import expenditure. Because of possible retaliation by other countries this approach may yield short-term improvements but may lead to a fall in export revenue in the long term.
Anti-dumping
Dumping occurs when producers export products to another country and sell them at a very low price (sometimes below unit cost). Dumping is also evident when a country’s producers set a price below the level charged in their own domestic economy. The Chinese solar panel industry has been accused of dumping its products in the European Union.
Unfair competition
Many countries use trade barriers to protect their domestic markets from what they see as unfair competition. For example, the EU argues that its trade barriers on textiles are in place because the competition in manufactured clothing from low-cost producers in Asia is unfair. Low wages and poor working conditions of ‘sweatshops’ in some exporting countries are seen as an unfair advantage.
Health and safety standards
Governments sometimes impose trade barriers on products that do not meet domestic standards such as EU restrictions on chlorine-washed chicken from the United States. The EU believes that poultry farming standards in the US do not meet the necessary animal welfare level so will not allow the import of chlorine-washed chicken.
Environmental standards
Countries sometimes choose to put trade barriers on goods because of environmental concerns. For example, the EU threatened wide-ranging trade barriers against Brazil two years ago because of the burning of areas of the Amazon rainforest.
Strategic reasons
Governments sometimes protect an industry because it has strategic importance. If, for example, a country was involved in a political conflict it might want to be able to rely on its own food, energy and steel industries. A country like Israel, for example, is constantly under threat from surrounding countries and believes in the importance of maintaining food security by protecting its agricultural industry.
Retaliation
An important consequence of a country imposing trade barriers on another country’s industry is retaliation by the country affected by the trade barriers. In extreme cases, this can lead to a trade war where each country in a trade dispute puts increasing trade barriers on each other's goods. The trade dispute between America and China over the last 3 years has seen trade barriers and retaliation by both countries. Retaliation means an industry unrelated to a trade barrier being imposed can be affected. For example, when the US put trade barriers on EU steel the EU responded by putting a tariff on Harley Davison motorcycles.
Evaluation of protectionism
The overall belief of economists is that countries benefit from free trade and these arguments are set out in chapter 4.1. The benefit of free trade means that trade barriers are a cost to society. These costs have been identified in the different trade barriers covered in this chapter.
Costs of protectionism:
- Higher import prices for consumers and reduced consumer surplus
- Welfare loss of consumers who no longer buy an imported good
- Increased import costs for businesses
- Welfare loss of inefficient production
- Reduced consumer choice
- Costs to the government of managing quotas and other trade barriers
- Retaliation against export industries.
There are, however, some situations where trade barriers can be a benefit to a country although retaliation will weaken these benefits.
Benefits of protectionism:
- Can improve protect environmental and health and safety standards
- Allows a country to develop an industrial base
- Can be used to raise tariff revenue
- Reduces unfair competition and dumping
- Reduces the speed of industrial decline
- Protects employment.
Politics and protectionism
Because governments impose trade barriers there is a huge amount of politics involved in decisions to apply trade barriers. Trade restrictions are often put in place in response to political lobbying by powerful interest groups who put pressure on politicians who, in their desire to get re-elected, push for trade restrictions. President Trump has used US tariffs on imported manufactured goods as part of a political strategy as well as an economic one. For example, many of the ‘Rust Belt’ steel towns that have benefited from trade barriers on steel are so-called ‘swing states’, which are very important for winning the US presidential election.
 Granite City is a city in Madison County, Illinois is a steel town. It has been in decline and it has found it difficult to compete for cheaper foreign producers in recent years. That was until Donald Trump’s policy of putting tariffs on imports. In 2018 the US government imposed a 25% tariff on steel and a 10% tariff on aluminium imports in an attempt to revive the US steel industry.
President Trump visited the revived steel mill in Granite City yesterday to take credit for jobs created by American tariffs against China and other steel producers. A crowd of steelworkers wearing the signature red MAGA baseball hats cheered Trump as he spoke triumphantly of reopening this ‘monster plant’. Imposing trade barriers and bringing back American jobs was one of Trump’s promises from the 2016 election campaign.
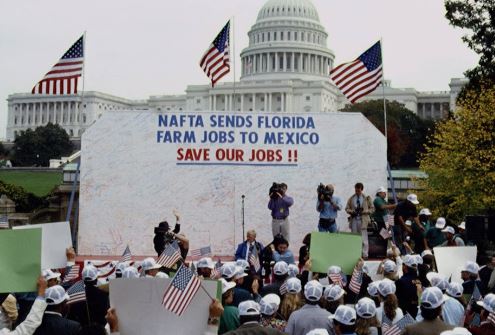
But his triumphal message comes at some cost. Midwestern soybean farmers have been caught in the crossfire of Trump’s trade war with China imposing tariffs on US soybeans.
Questions
a. Explain three reasons why the US government imposed tariffs on imported steel. [10]
Answers might include: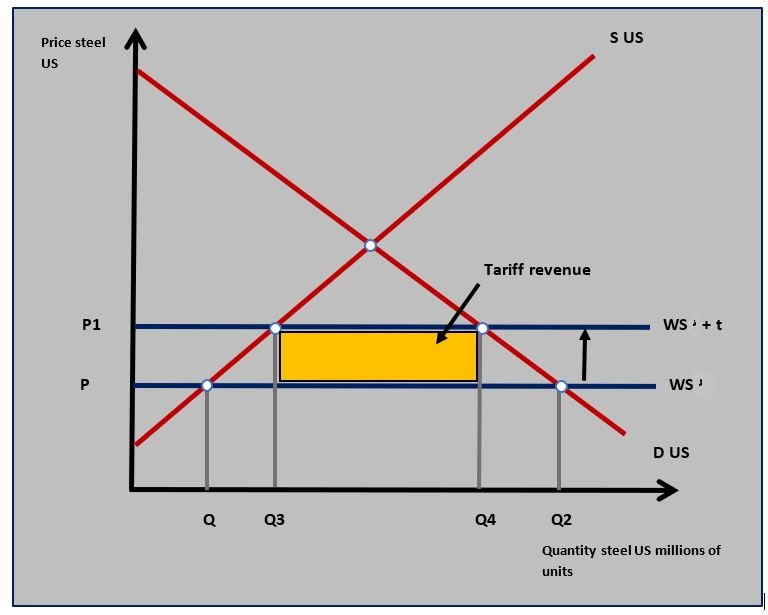
- Definitions of tariffs and imports.
- A diagram to show the effect of tariffs on the market for steel in the US.
- An explanation of how tariffs reduce the quantity of imported steel from Q-Q2 to Q3-Q4 in the diagram.
- An explanation that the US government might have imposed tariffs to support a declining industry.
- An explanation that the US government might have imposed tariffs to reduce unemployment in the steel and related industries.
- An explanation that the US government might have imposed tariffs because steel is a strategically important industry to the US economy.
b. Using a real-world example, evaluate the view that tariffs are always bad for the country that imposes them. [15]
Answers might include:
- Definition of tariffs.
- A diagram to show the impact of tariffs on different stakeholders in the economy.
- An explanation of the negative consequences of a tariff such as a higher price of imports, fall in consumer surplus, higher cost of imported inputs for businesses, welfare losses and the effect on exporters because of retaliation from foreign countries.
- The use of an example such as the US tariffs imposed on imported steel.
- Evaluation might include discussion of the benefits of a tariff to a country such as an increase in domestic producer surplus, the tariff revenue gained by the government, the businesses protect by the tariff and the jobs protected by the tariff.
Investigation
Research the US government's approach to protectionism.
A 2018 poll of economists conducted by a US-based investment bank found that 93 per cent of them believed that trade policies to increase free trade had benefited US citizens. So why is there so much pressure on governments to intervene in international markets and restrict free trade? They might be listening to the 7 per cent who think free trade does not benefit US citizens. It is, however, more likely that politics is more important in trade policy than economics.
Perhaps all state intervention in the economy is more about achieving political objectives rather than economic objectives. To what extent do you think this statement is true?
Which of the following is unlikely to be a benefit of imposing a tariff on a good?
Trade barriers normally increase domestic prices which reduces the domestic consumer surplus.
Using the information in the diagram which of the following is true?
50m x
Using the quota diagram which of the following statements is untrue?
The blue shaded area is a gain in foreign producer surplus.
4. Using the subsidy diagram which of the following is not true?
(19,000 - 12,000) x
Which of the following reasons for imposing tariffs is the least justifiable?
There are more effective policies for an MEDC to use to reduce a current account deficit.
Which of the following is an administrative barrier to trade?
Police cars being bought from a domestic producer is an administrative barrier.
Which of the following is the least likely consequence of Country A imposing an import quota on rice to reduce the quantity of rice imported?
Because the price of rice rises in Country A the domestic consumer surplus will decrease.
Which of the following is the least likely reason for Country A to put quotas on imported goods?
Quotas are a limit on imported goods and do not raise revenue for the government.
Which of the following is an example of ‘dumping’ in international trade?
Why might a government choose a quota rather than a tariff to reduce the quantity of imports?
A quota is more likely than a tariff to reduce the quantity imported because it does not rely on a set fall in domestic quantity demanded.
 Twitter
 Facebook
 LinkedIn