 IB Docs (2) Team

Changes in the long run aggregate supply
.jpg) Introduction
Introduction
This lesson connects a shift in the production possibility frontier (PPF) which your classes will have learnt at the beginning of the course with a shift in the productive capacity of the economy - long run aggregate supply.
Enquiry question
What happens when the long-run equilibrium changes?.
Lesson time: 70 minutes
Lesson objectives:
Examine, using diagrams, the impacts of changes to the long-run equilibrium.
Teacher notes:
1. Beginning activity - begin with the opening prezi which takes 5 minutes to watch and then complete activities 1 and 2, based on the information contained in the prezi. (Allow 15 minutes in total)
2. Processes - technical vocabulary - the students can learn the background information from the opening video and activity 3. Allow 15 minutes.
3. Applying knowledge - complete the short response activities on activity 4, illustrating the effect of various changes on an AD / LRAS diagram. (10 minutes)
4. Group discussion - After watching the video in activity 5 your class should attempt to answer the discussion point. (10 minutes)
5. Applying knowledge - activity 6 develops the argument, with a video that takes a comical view of the bi-lateral oil agreement made between Australia and East Timor, an oil rich LEDC, hoping to grow its economy through oil extraction. (10 minutes)
6. Final reflection - activity 7 contains a relevant link to the assessment - a paper one style question. This can be discussed in class or else used as a class or homework exercise. (10 minutes)
Key term:
Long run aggregate supply curve (LRAS) measures the total output that an economy can produce, in the long run, when operating at full employment.. This is determined by all of its factors of production – the size and quality of the workforce, the capital stock available, education, labour productivity and the quality of land available.
The activities on this page are available as a PDF file at: ![]() LRAS curve
LRAS curve
Activity 1: PPF curves
Start by watching the following presentation which can be accessed at: ![]() PPF presentation
PPF presentation
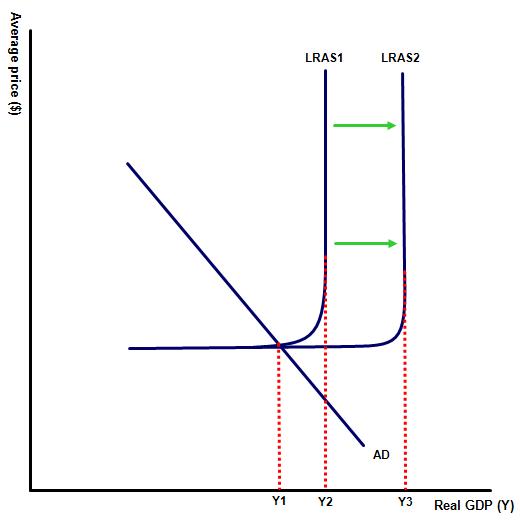
Draw both the keynesian and classical LRAS curves and illustrate the impact on both diagrams of a rise in the productive capacity of the economy.
Hint:
Responses should illustrate that a rise in the productive capacity of a nation can be illustrated by a sift right in the LRAS curves.
Activity 2: Illustrating a rise in LRAS on a PPF diagram?
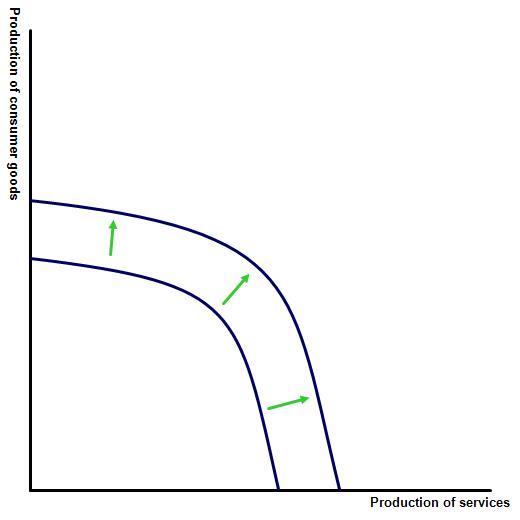
Illustrate the impact of the rise in LRAS on a PPF diagram?
 Hint:
Hint:
This would be illustrated by a right shift in the PPF, as the economy now has a larger productive capacity than before.
Activity 3: What causes a change to the LRAS curve?
Begin this activity with the following short video and use the information contained in the video to complete questions (a - f).
(a) Complete the following sentence by filling in the missing blanks:
The ability of any nation to provide goods and services depends on the quantity and ____________ of its factors of production; ___________, ___________, ______________ and ____________________.
quality, land, labour, capital, entrepreneurship.
(b) In any successful economy we would expect to see a nation's factors of production increase over time. Explain how a government might improve the quantity and / or quality of its factors of production over time?
Note that the key word here is overtime - changes to the LRAS curve cannot be made instantly.
Land
The physical land resources within a country may well improve due to improvements in agricultural techniques or the use of fertilisers, land reclamation, as has been seen in Singapore, or the discovery of new mineral resources. Infrastructure improvements such as the building of new dams or roads e.t.c. can also improve the productivity of land as a result of improving access to either natural resources or the market place.
Labour
This is perhaps the easiest production factor to improve, through either rises in the size of the labour force (through immigration) or the quality of labour through training and better education. A highly skilled labour force can improve productivity significantly.
Capital
A nation may grow its capital base through investment in new machinery or new production techniques, as well as the development of high value added sectors such as bio-technology or IT services.
Entrepreneurship
Entrepreneurship can be encouraged through government subsidies and incentives to encourage new businesses to start up. For example, many governments have adopted schemes that encourage the unemployed to set up small businesses with varying degrees of success.
(d) Why do fast growing LEDCs like China and India have a greater capacity to improve their LRAS than fully develped nations?
Very often there is more potential for LEDCs to improve their capital and infrastructure base, by purchasing the machinery already employed in the developed world. Similarly LEDCs can more easily copy the education and training systems already present in fully developed nations. By contrast, Developed nations have to rely on improvements to existing machinery through research and development in order to make the necessary gains in capital.
(e) Why might both keynesian and free market economists agree that improvements to LRAS are more effective than demand side policies in growing a nation's economy?
Both keynesian and free market economists would accept that demand side policies can only increase a nation's real output up to the existing productive capacity of that nation. By contrast supply side policies allow a nation to increase its productive capacity. In addition, economic growth resulting from demand side policies will inevitably cause inflation, where as supply side growth actually does the opposite.
(f) Why might the time lags associated with improvements to LRAS make some governments reluctant to focus on improving production factors?
Significant improvements to LRAS can be expensive and cannot be achieved quickly. This means that in democratic countries a government which chooses to divert significant resources towards education and training is more likely to see the benefit of this policy enjoyed by their successor rather than during their own term of office.
Activity 4: Applying the theory
Illustrate the effect of the following on AD / LRAS diagrams.
(a) Investment by a government in new machinery and AI
This would be illustrated by a rise in AD, through an increase in government spending and an eventual increase in LRAS through an improvement in the quality of the factor of production, labour.
(b) A fall in literacy / education rates in the country
This would be illustrated by a fall in the LRAS as the quality of the labour force reduced over time, lowering the productivity of labour.
(c) A rise in net immigration
This would be illustrated by a rise in AD, because the new migrants would consume some of their wages e.t.c. and a fairly immediate increase in LRAS because of an increase in the quantity of the factor of production, labour. Depending on the skill level of the new migrants entering the economy, the quality of labour may also change.
(d) A loss arable land from deforestation
This would be illustrated by a fall in the LRAS as the quality of land reduced over time, lowering the productivity of the factor.
(e) A rise in interest rates
No change to LRAS, unless the change was part of a long-term commitment to keep interest rates high, but there would be a fall in AD as C and I fell.
(f) Measures promoting small businesses
This would be illustrated by a rise in AD, through an increase in government spending and an eventual increase in LRAS through an improvement in the factor of production, enterprise.
Activity 5: Is the aggregate supply of goods and services really independent of price level?
Start with this simple explanation of why some economists believe that the LRAS curve is vertical. After watching the video critically evaluate the views in the video.
Hint:
The video does make a very plausible point that a country has a limited supply of land, labour, capital and entrepreneurship. That said we cannot dismiss the argument that price has no bearing on the quantity and or quality of the factors of production. Rising prices may encourage workers to work harder (the opposite may also be true) and landowners to transfer their property into a more productive use e.g. converting a spare room into an office e.t.c. In the example from the video which states that 'USA cannot just create more resources when the price rises?' is not completely true - sometimes a nation may possess mineral resources which can only be mined economically at a certain price. Similarly rise in the economy will encourage migrants from overseas to swell the rank of the working population.
Activity 6: A critical view of keynesian economics
Enjoy the following video and then summarise whether demand-side keynesian policies really make a country richer?
The video correctly argues that long-term an economy cannot grow simply by more government spending and consumption induced by expansionary fiscal and monetary policy. This can only come from investment in infrastructure and improvements to labour, capital or encouraging enterprise - similar to the monetarist view of economic growth. When the video refers to making sure that the horse pulls the cart, not the other way round he is referring to the dangers of taxing the profitable private sector to pay for moe pubic spending (crowding out). However, the video does not address the main strength of keynesian policy - that it is effective in closing a negative output gap, relatively quickly. Waiting it out or relying on the economy's automatic stabilisers might take a very long time and governments, especially in democratic nations do not have infinite amounts of time at their disposal.
Activity 7: Link to the assessment in paper one
Examples of paper one questions on LRAS include:
Part (a)
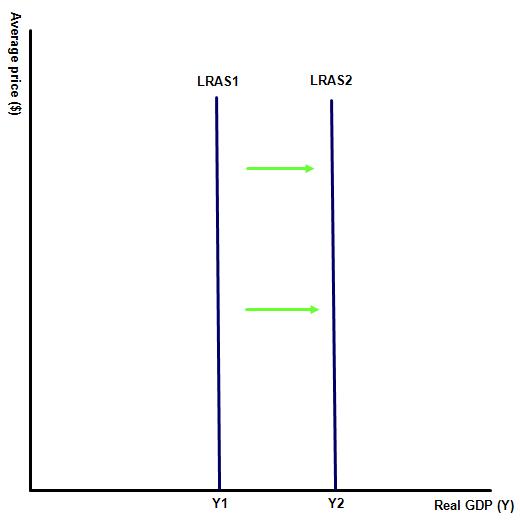
Illustrate using an appropriate diagram how government spending on research and development and improved infrastructure might shift the long-run aggregate supply curve. [10 marks]
Command term: illustrate
Key terms to define: supply side policies, LRAS
The specific command term in this example requires an illustration of the impact of increased levels of government spending on R + D and improved infrastructure on the long-run aggregate supply curve, represented by a shift from LRAS1 to LRAS2.
An explanation for this is that investment in those areas will improve the productivity of factor resources, increasing the quantity and or quality of the factors of production.
Part (b)
Using real life examples, evaluate the view that supply-side policies will always be more effective than demand-side policies in promoting economic growth? [15 marks]
 Command term: Evaluate
Key terms to define: demand side policies, supply side policies, fiscal policy, monetary policy, economic growth
Real world examples that might be used include nations such as Japan that have adopted one stimulus package after another but remain in a deflationary gap with very little growth, or LEDCs such as Turkey or Venezuela that have tried printing money as a route to growth but, after initial success, have seen growth stall as hyper inflation and currency devaluations have replaced rises in national income.
The question requires a response which considers both demand and supply-side policies and describes how effective each is in increasing the level of national income. Responses must consider both arguments in support of this statement followed by counter arguments and do not necessarily need to reach the same conclusion as stated in the title.
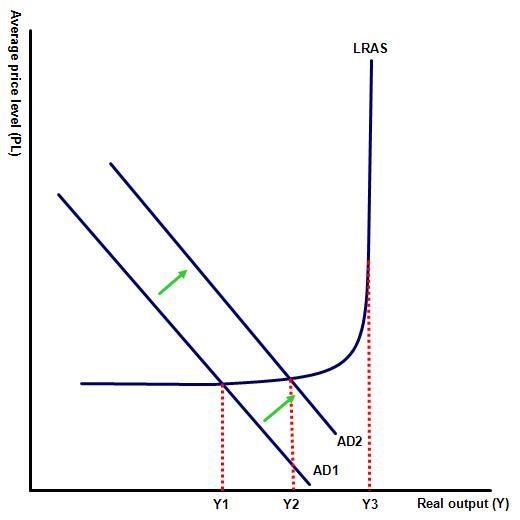
Responses should include a recognition that demand side policies can be divided into fiscal and monetary policies and can increase the level of economic growth by raising one or more of either C, G, I or X, illustrated on the diagram by a rise in AD from AD1 to AD2 and an increase in real national income to Y2. Examples of different monetary and fiscal demand-side policies which might be effective include cuts to taxation, an increase in government spending, lower interest rates or quantitative easing.
The response should then consider the disadvantages of demand-side policies, including time-lags, inflationary pressure, increased government debt, increased imports or crowding out.
 Responses should then discuss the effectiveness of supply side policies in raising economic growth. Examples of supply side policies that may be effective include improvements to infrastructure, investments in human capital as well as increased spending on research and development. This can be illustrated by an AD/AS diagram, showing a right shift in the LRAS curve from LRAS1 to LRAS2 or on a PPF diagram by a right shift in the PPF curve.
Responses should also consider some of the disadvantages of governments using supply-side policies, e.g. the time-lags for the policy is effective, the cost of large scale investment projects and the uncertain effectiveness of lowering taxes.
Real life examples might focus on nations that have been successful in raising the productive capacity of a nation through supply side measures, as well as those that have employed demand side policies with differing levels of success e.g. USA post 2009 and Japan which remains stuck in a period of slow economic growth despite extensive stimulus demand-side measures.
The command term evaluate also requires a conclusion which considers the impact of both supply and demand side policies in the short-term versus the long-term consequences and the impact on different stakeholders.
 Twitter
 Facebook
 LinkedIn