 IB Docs (2) Team

Unit 3.1(1): Measuring the level of economic activity

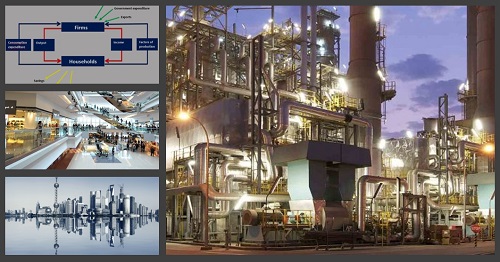
Economic activity is where scarce resources are allocated to produce goods and services to satisfy human wants. Macroeconomics is the study of economic activity from a whole economy perspective. This unit examines how economists measure the level of economic activity in a country and how this can be used to make judgements about a nation’s economy. The section focuses particularly on gross domestic product and gross national income and how they can be used to measure economic growth and economic development.
- National income accounting as a measure of economic activity
- Circular flow of income model
- Income, output and expenditure approaches to national income
- Gross domestic product (GDP)
- Calculation of GDP (HL)
- Gross national income (GNI)
- Calculation of GNI (HL)
- Real GDP and real GNI
- Calculation of real GDP and real GNI (HL)
- Real GDP/GNI per capita at purchasing power parity (PPP)
- Business cycle
Revision material
![]() The link to the attached pdf is revision material from Unit 3.1: Measuring the level of economic activity. The revision material can be downloaded as a student handout.
The link to the attached pdf is revision material from Unit 3.1: Measuring the level of economic activity. The revision material can be downloaded as a student handout.
National income as a measure of economic activity
 National income is the money value of a country's output of final goods and services produced in one year. Economic activity is where scarce resources are allocated to produce goods and services to satisfy human wants. Macroeconomics is the study of economic activity from a whole economy perspective.
For example, the German economy is well known for its high-performing manufacturing sector with famous names like Volkswagen, Daimler AG, Allianz and BMW. Microeconomics allows us to examine these individual businesses and the industries they operate in.
Macroeconomics looks at Germany’s manufacturing sector in the context of the whole economy where it accounts for 47 per cent of the country’s GDP. So, any change in Germany's manufacturing sector has a significant impact on its national output.
The circular flow of income
An economic model
The circular flow of income is an economic model that illustrates the flow of money between firms and households at a macroeconomic level. It can be further developed to include foreign trade, government and banking sectors. Whilst the model has been around since the 17th century, its importance as an economic theory was developed by John Maynard Keynes in his book, General Theory of Employment, Interest and Money which was published in 1936. The circular flow model is a useful aid to economic forecasting and policymaking.
How the model works
The model we are going to use in our analysis of the macroeconomy is a simplified version of the model used by institutions such as banks, universities, hedge funds and governments, but it is still very useful as a method of understanding how the macroeconomy works.
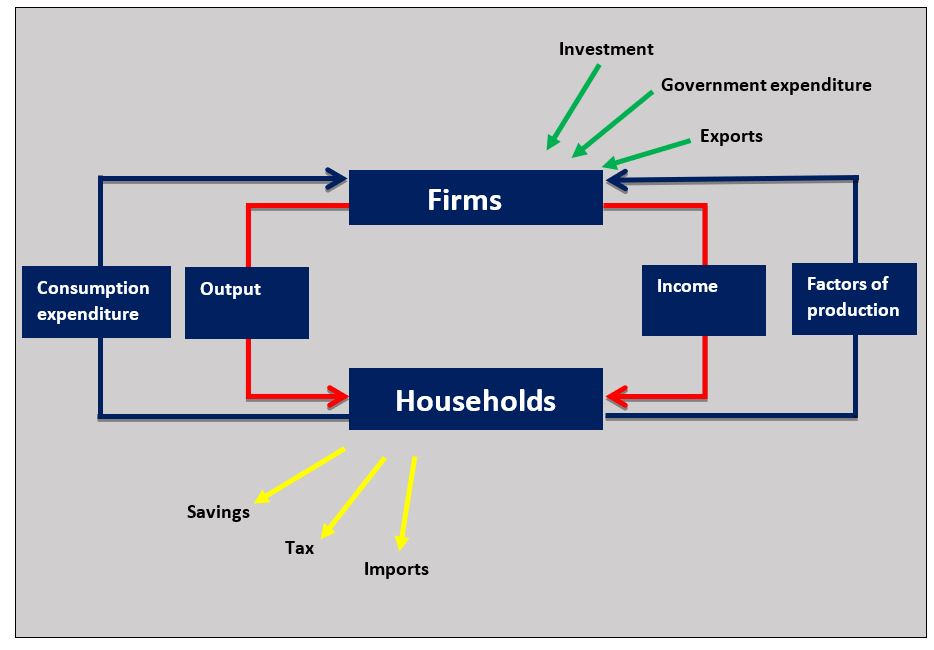
The flow of income is illustrated in diagram 3.1. It can be explained by considering the followi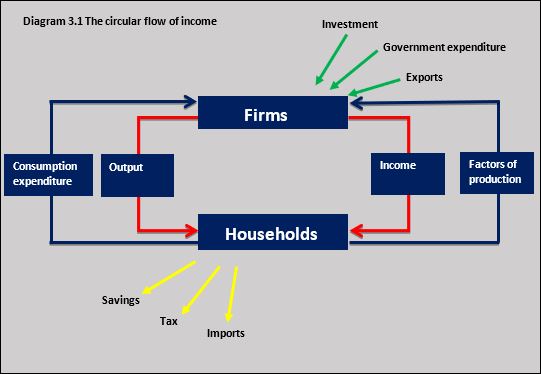 ng principles:
- The economy can be divided into two sectors, firms and households.
- Firms combine the factors of production to produce goods and services and households buy the goods and services and consume them. This is shown by the blue flows in the circular flow diagram 3.1.
- To produce the goods and services firms need to employ people from the households which include labour and entrepreneurs and in return, the firms pay the households an income. This is shown by the red flows in diagram 3.1.
- Injections of funds come into the circular flow of an economy in the form of investment, government expenditure and exports.
- Withdrawal or leakages of funds from the circular flow of income go out in the form of savings, tax and imports.
Injections to the circular flow
Injections are the flow of funds into the circular flow that come from firms investing, government spending and exports resulting from foreign trade. The three injections are:
- Investment by businesses when they buy capital such as new buildings and machinery
- Government expenditure on public services such as health and education
- Exports of goods and services to other countries lead to an inflow of funds.
Withdrawals from the circular flow
Withdrawals from the circular flow occur when money leaves the economy through household savings, taxation by the government and imports resulting from foreign trade. The three withdrawals are:
- Savings by households of income they do not spend on goods and services
- Taxation by governments on household income, business profits and indirect tax on goods and services
- Imports bought by firms and households lead to an outflow of funds.
Application of the model
Like the other models we use in Economics, the circular flow model lets us analyse the causes and consequences of changes in economic variables. The demand and supply model helps us examine how, for example, changes in household income affect price and output in a market. Here are some examples of how the circular flow model can be used to analyse how a change in injections and withdrawals affect the macroeconomy. Consider the following examples:
- An increase in the value of exports by an economy increases the value of funds in the circular flow which leads to increases in household incomes and consumption, output by firms and employment.
- An increase in taxation in the economy reduces the value of funds in the circular flow. This leads to a decrease in household incomes and consumption, output by firms and employment.
The European U nion is on course for a significant macroeconomic contraction as a result of the Covid19 pandemic. Economies across Europe have experienced a ‘double hit’. Lockdowns across the continent have led to a huge fall in consumer spending on the one hand, with an equally steep fall in output because people cannot go to work. Add a huge decline in business investment and you can see the flow of income, output and expenditure is going to fall in all European nations. Christine Lagarde, the head of the ECB has said the eurozone will see a 15% collapse in output between April and June 2020. Governments have responded with massive increases in their spending to try and counter the economic crisis.
 Worksheet questions
Questions
a. Explain what the circular flow of income shows. [4]
The circular flow of income is an economic model that illustrates the flow of money between firms, households, the government and the foreign sector of an economy. It shows the flow of income paid to households by firms in return for supplying the factors of production. It also shows the value of goods and services produced by the firms that are bought as part of consumption spending by households. In addition, the model sets out the injections into the economy (investment, government expenditure, exports) and withdrawals from the economy (savings, tax and imports).
b. Explain two effects of the Covid19 pandemic that might reduce the value of output and expenditure in the circular flow of income of a country. [4]
The Covid19 pandemic makes it difficult for households to work so the supply of labour to firms is reduced which decreases the value of the output of goods and services produced by firms in the circular flow of income.
Because households cannot go to shops to buy goods and services this reduces the value of consumption spending as part of the circular flow of income.
Investigation
Research how the Covid19 crisis has affected the income, output and expenditure in other economies in the world.
Gross Domestic Product (GDP)
Defining GDP
A country’s GDP is the money value of all final goods and services produced by that country in one year. It is a statistic used to measure macroeconomic activity. The GDP of a country is normally considered an annual figure, but economists and governments also use quarterly figures to track economic growth over time so they can closely monitor what is happening to economic activity. The GDP is expressed in money terms using the country’s currency, although for international comparison the value in $US is used.
Using final goods and services
When the GDP of a country is being calculated only the value of final goods is used. The value of intermediate goods such as raw materials and components are not included because this would lead to ‘double counting’. If you included the value of a television produced when it is sold by the manufacturer to a retailer (an intermediate good) and then count it again when it is sold to the consumer as a final good then you would count the value of the television twice.
Using the circular of income to measure GDP
The circular flow of income gives us 3 ways of measuring the GDP.
Income method
This is the total value of income earned by households in one year in the form of:
- Wages paid to labour
- Interest paid to capital
- Rent paid to land
- Profits and dividends paid to entrepreneurs.
It is important not to count income in the form of transfer payments where no economic activity has been engaged in to generate the income. Transfer payments include pensions, unemployment benefits and student grants, etc.
Output method
This is calculated by taking the value-added of firms in different sectors of the economy. The sectors are:
- Primary – commodities such as agricultural goods, mining, forestry and fishing, etc.
- Secondary – manufacturing such as cars, mobile phones, pharmaceuticals and clothing, etc.
- Tertiary – services such as education, restaurants, tourism and transport, etc.
Value added is the method of calculating GDP to avoid ‘double counting’. Value added is the monetary difference between the purchase cost of the material inputs used to produce the good and its selling price. If a car manufacturer, for example, pays for the materials and components to produce a car valued at $4,000 and sells the car to a dealer for $10,000 then the value added is $6,000. If the dealer takes the car they have bought for $10,000 and sells it for $14,000 their value-added is $4,000. The value-added of each sector is used to calculate the GDP by the output approach.
Expenditure method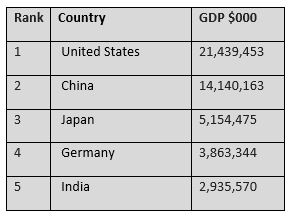
This is calculated by aggregating the total expenditure of different sectors of the economy. There are four types of expenditure:
- Consumption (C) spending by households on final goods and services
- Investment (I) spending by firms on capital equipment
- Government (G) spending on public services
- Net Exports (X-M) The surplus of the value of exports over the value of imports
The table sets out the GDP of the five largest economies in the world.
Gross national income (GNI)
Calculating GNI
The gross national income is the total income generated by a country and is calculated by adding net property income from abroad to the GDP.
GDP + net property income = GNI
Net property income from abroad
Property income is money earned by households on different assets. This income comes in the following forms:
- Interest on loans made
- Profit from businesses owned
- Rent on property owned.
Net property income is income on domestic assets owned overseas that flow into the domestic income less income on foreign assets that flow out of the domestic economy.
Examples of property income inflows to the UK economy include income sent back to the UK in the form of:
- Interest on UK loans made to German companies
- Profits made by a UK company in Russia
- Rent paid to UK-owned commercial property in the US.
Examples of property income outflows from the UK economy would include income sent to foreign countries in the form of:
- Profits made by a German car manufacturer in the UK
- Interest paid on loans made by an Australian bank to UK businesses
- Rent paid to Chinese owners of luxury property in London.
This year sees the 10 millionth BM W Mini roll off the production line from BMW’s Cowley plant in Oxford. The mini is one of the UK’s most iconic car brands and has been a huge success for BMW. The company have invested £2 billion in the plant since the year 2000 and the Oxford factory produces 300 cars a day.
Whilst much of the profit from the plant is reinvested in the Cowley plant some of the profit is repatriated to Germany to pay the company’s shareholders.
Worksheet questions
Question
a. Define the term real GDP. [2]
A country’s GDP is the money value of all final goods and services produced by that country in one year with an allowance made for inflation.
b. Using the circular flow of income diagram explain how real GDP is measured. [10]
Answers might include:
- Definitions of circular flow on income and real GDP.
- A diagram to show the circular flow of income.
- An explanation using the circular flow diagram that shows how the nominal GDP can be measured by using the income (wages, interest, profits and rent), output (value added by the primary, secondary and tertiary sectors) and expenditure (C+I+G+X-M) methods.
- An explanation that once a nominal GDP figure is determined the GDP deflator is used to calculate a real GDP figure.
c. Explain how net property income is calculated. [4]
Net property income is income on domestic assets owned overseas (rent, profit and interest) that flow into the domestic income less income on foreign assets that flow out of the domestic economy (rent, profit and interest). For example, the profit earned by BMW in the UK and sent back to Germany is an outflow of funds and the profit earned by RBS bank in Germany and sent back to the UK is an inflow of funds.
d. Explain the difference between GDP and GNI. [4]
GDP is the money value of all final goods and services produced by that country in one year. Gross national income is the total income generated by a country and is calculated by adding net property income from abroad to the GDP
Investigation
Investigate another example of property income generated by foreign assets in your country.
GNI per capita
GNI per capita is measuring GNI per head of population. GNI per capita is calculated as:
GNI / population = GNI per capita
Last year the GNI for the US was $20.84 trillion and the population of the US was 328 million
20,840,000 million / 328 million = $63,537
Economists like to use GNI per capita when analysing national income data because it allows them to make inter-country comparisons. A per capita figure is much smaller than the total GNI so it is an easier number to interpret. GNI per capita is particularly useful when measuring a country’s economic development.
Adjusting for inflation
Importance of real terms
The value of a country’s GDP is adjusted for inflation to turn the GDP in nominal terms into GDP in real terms. Nominal GDP is expressing GDP with no allowance for inflation. Expressing economic values in real terms is important because inflation distorts data and makes it difficult to interpret. For example, if a country’s GDP rises by 3 per cent this would be an acceptable rate of economic growth. But if that country’s inflation is 3 per cent then the country would not have grown at all.
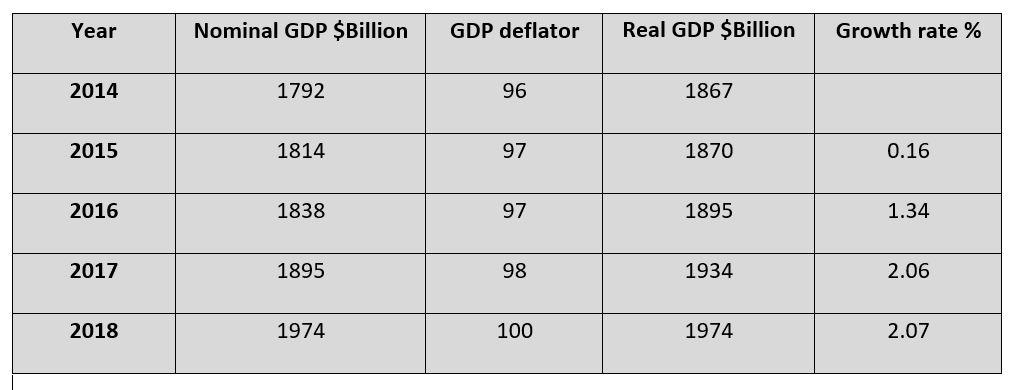
Calculating real GDP
Calculating real GDP is done by dividing the nominal GDP by the GDP deflator and multiplying by 100. The table below sets out the GDP data for a country. For 2014 the real GDP is:
1792/96 x 100 = 1867
The growth rate is calculated by working out the annual percentage change in real GDP. For 2015 this would be:
1870 – 1867 / 1867 x 100 = 0.16%
Economic Growth
Measuring growth
Economic growth is the increase in a country’s real GDP over time. The economic growth rate of a country is the percentage increase in its real GDP over one year. GDP figures are released quarterly so a country’s economic activity can be continuously monitored.
The annual growth rate is calculated by:
GDP current year – GDP previous year / GDP previous x 100 = current year growth rate
Business cycle (trade cycle).jpg)
Economies do not grow at a constant rate because the rate of growth of a country rises and falls over time and this is called the business cycle. The average rate of growth over a number of years is called the trend rate of growth. Amongst more developed countries (MDCs) the trend rate of growth is normally around 2-3 per cent
Diagram 3.2 illustrates a conventional business cycle.
Conventional business cycle
Business cycles are all slightly different, but the conventional cycle normally follows the changes set out below:
- The boom phase occurs when the rate of growth is above the trend rate. High rates of economic growth in a boom are normally associated with rising incomes, falling unemployment, and rising inflation.
- The slowdown phase of the business cycle is when the economy goes past its peak rate of growth and the growth rate falls. Household incomes do not rise as fast, unemployment might start to rise and there is less pressure for inflation to increase.
- The recession phase of the cycle is when real GDP falls. A recession is technically defined as a period of two consecutive quarters of negative growth in real GDP. Household incomes might fall, unemployment normally increases and inflation falls
- The recovery phase of the business cycle is when the economy emerges from a recession and the real GDP starts to increase. The rate of economic growth is slow to start with and then it accelerates. Household incomes start to rise, unemployment starts to fall and there is upward pressure on inflation.
 Africa’s rise has been remarkable in recent years. Its average annual GDP growth is consistently above the global average and is expected to remain around 6% until 2023. Six of the world’s 10 fastest-growing economies are in Africa. Eritrea, Rwanda, and Ethiopia all recorded growth rates above 7% last year. Africa's success has much to do with its working-age population and growing consumer markets.
In demographic terms, it is the youngest region in the world and is the source of a vast labour supply. When this is combined with developments in technology there is huge potential for increased saving which will fund future investment to drive further growth. As the continent experiences rising incomes and employment, it will lift many of its poorest people out of poverty.
Worksheet questions
Questions
Define the term economic growth. [2]
Economic growth is the increase in a country’s real GDP over time.
Using a diagram explain the business cycle. [4]
 The business cycle sets out how the actual GDP of a country change over time as it moves through the different phases of economic growth. The phases are boom, slowdown, recession and recovery.
c. Using a real-world example, evaluate the view that economic growth is always a good thing for a country. [15]
Answers might include:
A definition of economic growth.
A circular flow of income diagram to show how households and firms benefit from economic growth.
An explanation of the benefits of economic growth such as increased household incomes, more employment, less poverty, better public services and more business investment.
An example (African country in the case example) to illustrate the costs and benefits of economic growth.
Evaluation of the benefits of economic growth for a country. This could include a discussion of the costs of economic growth to a country in terms of environmental issues, sustainability, income inequality and inflation.
Investigation
Choose a country and investigate its economic growth performance over the last five years.
The circular flow of income model developed by John Maynard Keynes shows the inter-relationships between firms, households, government and foreign sectors of the economy at a macroeconomic level. The theory that income = output = expenditure clearly shows the interdependence between the variables in the model. This can be illustrated by showing how changes in one variable affect the others. In the Covid19 pandemic 'lock-down' situations output was significantly reduced when certain sectors of the economy could not operate as normal such as tourism, hospitality and airlines. The decline in output directly led to falls in income and expenditure.
Think about the way interdependence at a macroeconomic level affect the way economists model the economy.
Which of the following is not an injection into the circular flow of income?
Which of the following is not an effect of a rise in savings by households?
Household incomes are likely to fall if more funds are withdrawn from the circular flow.
Which of the following is the best definition of GDP?
The key points are the money value of output and final goods and services.
Using the following data of country A, which of the following values is the real GDP of country A?
Nominal GDP
GDP deflator 98
Which of the following best represents the changes in GDP during the business cycle?
Which of the following is not a property outflow from Country X?
Imports are not income generated from foreign assets owned in the domestic economy.
Which of the following is least likely to occur in the recession phase of the business cycle?
Consumer spending is most likely to fall in a recession.
This is the following data is for Country X:
Nominal GDP
GDP deflator 97
Which of the following is the real GDP for Country X?
This is economic data for Country Y:
Real GDP 2021
Real GDP 2020
Which of the following is Country Y’s rate of economic growth for 2021?
Using the following data of country B, which of the following values is the real GNI of country B?
Real GDP
Property inflow
Property outflow
$ 780 Billion + ( $ 18 Billion - $ 21 Billion) = $ 777 Billion
 Twitter
 Facebook
 LinkedIn