 IB Docs (2) Team

Equilibrium in macroeconomics (keynesian perspective)
 Introduction
This lesson looks at the macroeconomic equilibrium from a keynesian perspective. Start this lesson off with a simple survey, do your IB students support a keynesian or neoclassical view of economics. In other words during a period of recession do they believe that the government should intervene to stimulate the economy or do they believe that the economy will naturally correct itself, without government interference.
Enquiry question
Why using the keynesian model, does the long run aggregate supply curve (LRAS) consist of three sections.
 Lesson time: 80 minutes
Lesson objectives:
Explain, using a diagram, that the Keynesian model of the aggregate supply curve has three sections because of “wage/price” downward inflexibility and different levels of spare capacity in the economy.
Explain, using the Keynesian AD/AS diagram, that the economy may be in equilibrium at any level of real output where AD intersects AS.
Explain, using a diagram, that if the economy is in equilibrium at a level of real output below the full employment level of output, then there is a deflationary (recessionary) gap.
Explain, using a diagram, that if AD increases in the vertical section of the AS curve, then there is an inflationary gap.
Discuss why, in contrast to the monetarist / new classical model, increases in aggregate demand in the Keynesian AD/AS model need not be inflationary, unless the economy is operating close to, or at, the level of full employment.
Teacher notes:
1. Beginning activity - begin with the opening video which takes 5 minutes and links directly to activities 1, 2 and 3.
2. Processes - technical vocabulary - the students can learn the key concepts through the opening video and the handout containing the activities. Allow 15 minutes to go through activities 1, 2 and 3 then discuss both.
3. Group discussion - do your students support keynesian or monetarist economic theory and which theory would they trust to rescue an economy from a recession? Allow 10 minutes and you may wish to make a note of which theory each student supports because the later activities provide them with opportunities to change their minds. (10 minutes)
4. Short revision questions - activity 5 contains short answer revision questions. (10 minutes)
5. Developing the argument - activities 6 and 7 start with a short video and your students can use the information contained in the video to consider whether the validity of keynesian theories or not, as well as reflect on the man's legacy, decades after his death? (15 minutes)
6. Link to TOK - The two differing interpretations of the shape of the LRAS curve provide an opportunity to link this topic to the TOK class. How can either economics school actually prove that their version of the theory is correct? (10 minutes)
7. Reflection - activity 9 contains a reflection exercise with a video depicting keynesian theories, along with those of socialism, capitalism e.t.c. using a bowl of water and a glass. I have included my own reflection on this exercise and perhaps you want to add your own? (5 minutes)
8. Link to the assessment - complete this lesson by looking at the paper one examination style question. This can also be completed as a class or homework exercise. (10 minutes)
Key terms:
 Monetarist / neo-classical economists believe that changes to the money supply determine a country's economic performance. Such a school of thought supports the view that macroeconomic markets are self correcting and that any attempt to stimulate aggregate demand through government intervention will be inflationary.
Keynesian economics consists of a set of theories focused on total spending in the economy and the effect that spending has on output and inflation. Keynesian economists believe that increased government expenditures and lower taxes can be used to stimulate demand and close a deflationary gap.
Macroeconomic equilibrium - where aggregate supply is equal to aggregate demand. Unlike the classical economic model, however, this may appear at multiple points along the LRAS curve - not just at the full employment rate.
The activities on this page are available as a PDF at: ![]() Keynesian macro equilibrium
Keynesian macro equilibrium
Beginning activity
Watch the following short youtube clip and then complete the activities which follow:
Activity 1: Keynesian LRAS curve
(a) Using information from the video draw a keynesian LRAS curve with a deflationary gap.
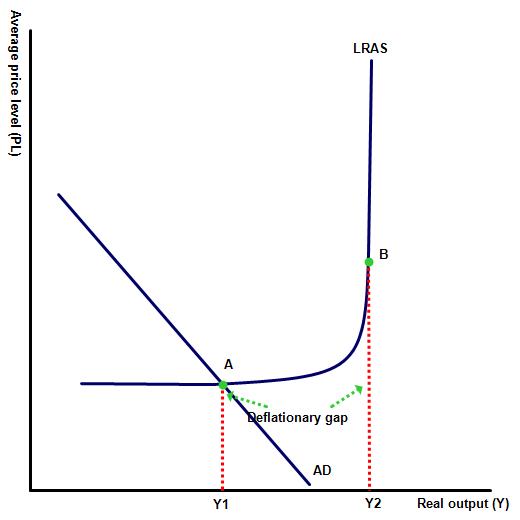 The deflationary gap represents the gap between the level of AD present in the economy and the level of output when there are no unemployed resources in the economy, Y2 on the diagram.
(b) Explain using a diagram the effect of a government stimulus package on the economy, in the form of higher government spending and lower taxes / interest rates.
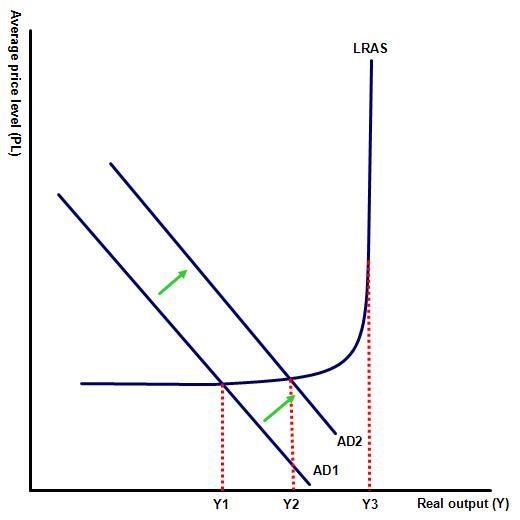 From a keynesian perspective this deflationary gap can be closed by rises in aggregate demand. Following a rise in one or more of the components of aggregate demand, AD rises to AD2 and the output gap is reduced.
(c) Explain why in the keynesian LRAS diagram, unlike the classical model, there is no immediate rise in inflation when the government increases AD?
Between points Y1 and Y2, there is significant spare capacity in the economy - empty workspaces, supplies and unemployed labour e.t.c. Therefore firms can simply respond to the rise in demand by increasing production using their existing capacity and the unemployed resources available in the economy.
(d) Explain why the economy is likely to experience inflation, the closer that the economy moves towards its full employment level?
As the economy gets closer to the full employment level, the economy starts to come under inflationary pressure, as the available factors of production become increasingly scarce. At output level Y3 the economy is at the full employment and any further increases in AD will be purely inflationary. This is because all the available factors of production are being used and so firms will be forced to outbid each other to secure their services, should they wish to increase output further.
LRAS or AS keynesian supply?
You will notice on these pages that I sometimes label the aggregate supply curve LRAS (long run aggregate supply curve), to distinguish this line from the SRAS curve. On other occasions this distinction is dispensed with and instead the curve is labelled aggregate supply (AS). The argument being that in keynesian the distinction between the short run and long run is not obvious and therefore labelling the curve AS is a more accurate reflection of what the curve represents. You may use either label in your work.
Activity 2: Short answer responses
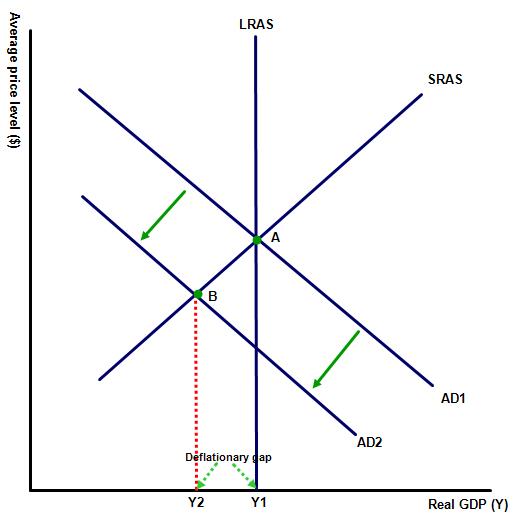
1. Illustrate using an AD / AS diagram a deflationary gap, from a keynesian and neoclassical perspective.
Keynesian
Neoclassical
2. Explain the difference between the full employment level of national income and the long run equilibrium level of output from both a keynesian and neoclassical perspective?
In neoclassical economic schools the long run equilibrium is at the full employment level. In keynesian economics the full employment level of output represents the output level when all factors of production are used but the long run equilibrium level can be at different output levels, where AD and LRAS intersect.
3. Define the term recessionary / contractionary gap?
A recessionary gap exists when an economy is operating below its full-employment level.
4. Define the term inflationary gap?
An inflationary gap exists when the economy has a higher level of GDP than the anticipated national income when the economy is at full employment.
5. Define the term output gap?
The output gap represents the difference between the actual level of output within an economy and the output level in the economy when the economy is in full employment. Unlike recessionary and inflationary gaps an output gap can be either positive or negative.
 Activity 3
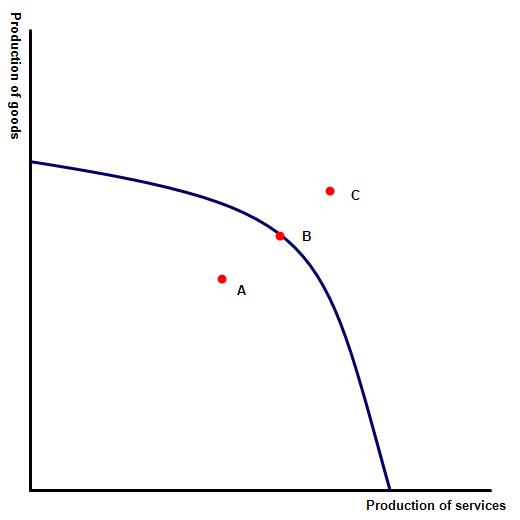
The diagram to the right illustrates the PPF for an economy. Draw a keynesian LRAS curve and highlight the points A, B and C on your LRAS diagram.
Activity 4
The country where you live is in recession. It is election time and two candidates are running for office. Once believes in keynesian economics, he is claiming that the answer lies in large government spending projects and heavy tax cuts. The other appeals for calm and requests that you, the electorate should be patient and wait for the economy to fix itself.
Which of the two economic arguments do you find the more convincing and which politician would you vote for?
Are there students who provided different responses to both questions - i.e. finding the classical model / theory more convincing but still choosing to vote for the keynesian candidate. If so, was John Maynard Keynes correct when he said that in 'the long run we are all dead'.
Activity 5: Are the following policies primarily keynesian or neoclassical?
(a) Reducing minimum wage legislation
(b) Cutting income and corporation tax rates (for high earners) to boost growth in the economy
(c) Increases in government spending, financed by additional borrowing, to boost spending on the nation's infrastructure
(d) Reducing administrative barriers associated with recruitment
(e) Cutting taxes for low income families to boost growth in the economy
(f) Lowering interest rates or electronic printing of money to boost GDP growth in the economy
Activity 6: The legacy of John Maynard Keynes
Watch the introductory video on John Maynard Keynes and then state the extent to which the economist influenced economic thinking after his death - and the extent to which his theories still remain relevant today.
Modern day organisations such as the World Bank remain relevant today. His policies were also widely used among governments for a 30 year period after the second world war. Furthermore, despite being out of fashion for much of the period after the 1970s, many governments turned back to his policies following the financial crisis of 2008. The video highlights that during this period many countries ran up huge fiscal deficits to try and rescue their economies and as one critic announced, 'everyone is a Keynesian now that we are in a fox hole'.
Activity 7
Study the following youtube video, from economist Book Patrick and then discuss whether this has changed the view of any members of your class.
Activity 8: Connection to TOK:
The Keynesian and Monetarist positions differ on the shape of the AS curve. What is needed to settle this question: empirical evidence (if so, what should be measured?), strength of theoretical argument, or factors external to economics such as political conviction?
This is a very difficult one to prove, which makes it an ideal TOK exercise, because ultimately how can either economics school actually prove that their version of the theory is correct? Both schools would agree that in the short run a rise in AD will bring about an increase in economic activity but for how long? Furthermore, once the economy returns to its long run equilibrium how can we say with any conviction whether the course of action that the government took has left the economy in a better shape or not?
Activity 9: Reflection exercise
Have your classes watch the following video, illustrating the effects of Keynes and Monetarist economic policies through two jugs of water. Afterward explain the message that the author of this video is trying to portray.
This video contains a glass of water nestled inside a jar. In the free market the private sector (the jar) collects in water and any excess goes to remainder of the society. In the LEDC, the glass also fills but money is syphoned from the glass, indicating the money misappropriated by government officials, that prevents the bowl from filling. Under the communist model there is no private sector (glass), while under keynesian economics the government and private sector work together to fill both glass and bowl.
Activity 10: Link to the assessment in paper one
An examples of paper one question:
(a) Explain why free market economists believe that the economy is can only be in equilibrium at full employment, where as in keynesian theory the economy may be in equilibrium at any output level? [10 marks]
 Command term: Explain
Key term to explain: Equilibrium output
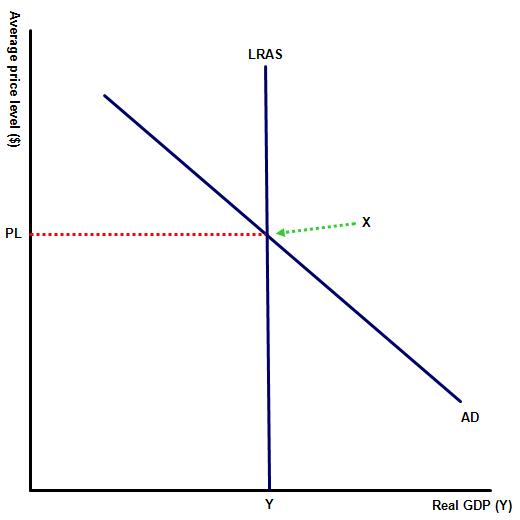
From a neo-classical / free market perspective an economy is in equilibrium at its full employment level, also called the natural rate of unemployment. This is represented on the diagram by output level Y, where AD is equal to the LRAS curve. This can only be at one level of national output - the full employment level.
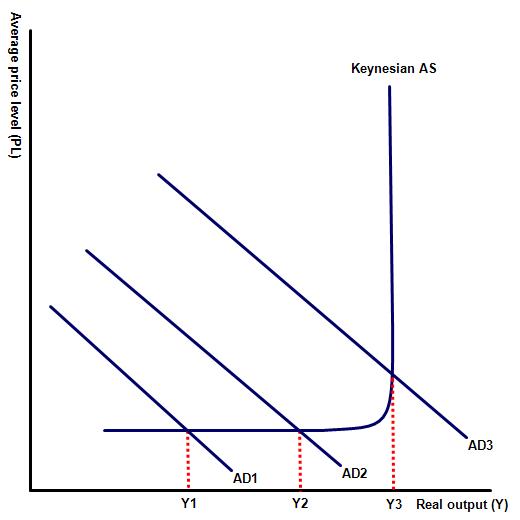 From a keynesian perspective, however, there is a clear distinction between the full employment level of national income, represented by Y3 and the equilibrium national income level, represented on the diagram by Y1 and Y2.
While the full employment level of output represents the level of output when there is full employment, which can only happen at one point, the equilibrium level of output can be reached at any point along the AS curve where AD = AS.
(b) Using real life examples, evaluate the view that an increase in aggregate demand will always lead to an increase in real national income. [15 marks]
 Command term: Evaluate
Key term to explain: equilibrium output
Like all questions with the command term evaluate this question must be discussed from different perspectives and this question is also ideal for distinguishing between the short run and the long run.
Real-world examples that might be used include nations such as Japan that have adopted one stimulus package after another but remain in a deflationary gap with very little growth, or LEDCs such as Turkey or Venezuela that have tried printing money as a route to growth but, after initial success, have seen growth stall as hyperinflation and currency devaluations have replaced rises in national income.
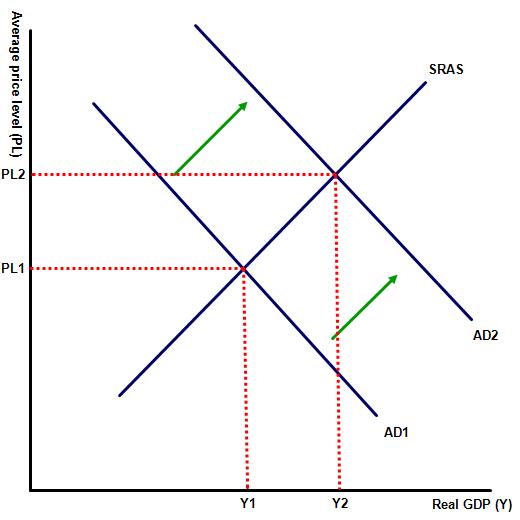
Starting with the short run, there is general agreement amongst economists that a rise in aggregate demand will result in a short-term rise in output, illustrated on diagram 1 by a rise in real GDP from Y1 to Y2. At the same time, after an initial time lag any rise in AD is also likely to result in a rise in average  prices, illustrated on the diagram by a rise from PL1 to PL2, as producers respond to the initial rise in demand for their goods and services by raising prices as well as output to satisfy the increased demand.
In the long run, however, the impact of a rise in AD on real GDP is less clear with the impact depending on the number of unemployed resources in the economy as well as whether the economist is considering the impact from a Keynesian or Free-market perspective.
From a Free market / Monetarist perspective the LRAS curve is vertical, implying that average prices and output are independent of each other. Any rise in AD therefore will simply lead to a rise in average prices as the availability of factor resources is fixed in the long run. This is illustrated on diagram two by a rise in price level from P1 to P2, following a rise in AD. Real GDP remains unchanged at Y.
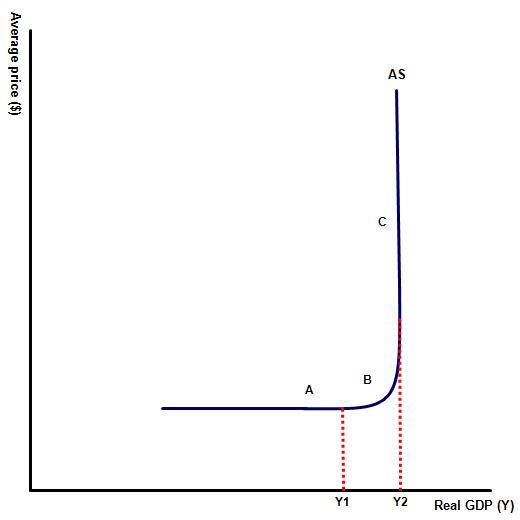
Lastly, from a Keynesian perspective the impact of a rise in AD on national income depends on the number of unemployed resources in the economy. This can be explained by diagram three, which illustrates the Keynesian AS curve.
At point A there is sufficient spare capacity in the economy and so any rise in AD will lead to more resources being utilised and the economy will grow.
As the economy moves from A to B however, the availability of resources diminishes making it more difficult for a firm to respond to a rise in demand for its products by raising output. More likely they will simply raise their price levels. At point C the economy is operating at its full employment level and there are no unemployed resources in the economy. Any rises in AD will be purely inflationary.
Real world examples that might be used could include Japan and USA. Following the financial crisis of 2007-9, the USA adopted very aggressive expansionary demand side policies and the economy benefited as a result. By contrast Japan has adopted similar expansionary demand side policies but their economy remains stuck in a recessionary cycle - and with significant higher national debt levels as a result.
 Twitter
 Facebook
 LinkedIn