 IB Docs (2) Team

Aggregate demand and supply
 Introduction
This page introduces the concept of aggregate demand and aggregate supply and your students will need to understand that the AD of an economy is the sum of the collective individual demand curves. You should also emphasise that governments have considerable ability to control the level of AD in the economy and also that the control of this variable is a crucial part of government economic policy. Similarly, that aggregate supply is a combination or aggregate of all of the individual supply curves in the economy. Like an individual supply curve this slopes upwards from left to right.
Enquiry question
What do aggregate demand and supply mean? What factors might lead to a change in either AD and / or AS?
Lesson time: 70 minutes
 Lesson objectives:
Distinguish between the microeconomic concept of demand for a product and the macroeconomic concept of aggregate demand.
Construct an aggregate demand curve, and explain why the AD curve has a negative slope.
Describe consumption, investment, government spending and net exports as the components of aggregate demand.
Define the term aggregate supply. Explain, using a diagram, why the short-run aggregate supply curve (SRAS curve) is upward sloping.
Explain, using a diagram, how the AS curve in the short run (SRAS) can shift due to factors including changes in resource prices, changes in business taxes and subsidies and supply shocks.
Teacher notes:
1. Beginning activity - begin with activity 1. (10 minutes)
2. Processes - technical vocabulary - the students can learn the key concepts through the first video and by completing activities 2 and 3. Allow 20 minutes to go these activities and discuss.
3. Questions - activities 4 and 5 contains short questions which will help reinforce the concepts. (15 minutes)
4. Reflection activity - complete this lesson by watching the short video, which focuses on AD in the UK economy. What were the driving forces behind the UK economy at the time of the news item? (10 minutes)
5. Link to the assessment - this activity contains an example of a paper one style question, on this topic. Spend 10 minutes discussing this - note that section (b) asks students to make a judgement on whether economic growth is always good or not? This would also make a good class work or homework exercise. (10 minutes)
Key terms:
.jpg "image: http://www.californiaeminentdomainreport.com/") Aggregate demand - the total spending in an economy consisting of consumption, investment, government expenditure and net exports. This is calculated by the formulae: C+G+I+(X-M).
Aggregate demand - the total spending in an economy consisting of consumption, investment, government expenditure and net exports. This is calculated by the formulae: C+G+I+(X-M).
Private consumption (C) - spending by households on domestic consumer goods and services over a period of time.
Government spending (G) - public sector spending whether by national or local governments. This includes spending on public services such as health, education, public transport, defence and infrastructure projects.
Investment (I) - expenditure by firms on capital equipment and is an injection into the economy.
Net exports (X-M) - the value of exports (ie export revenues) - value of import (ie import expenditures).
Aggregate supply - also known as total output, is the total supply of goods and services produced within an economy at a given time and at an overall price level.
Supply shock - an unexpected event that impacts on the supply of a product or commodity, resulting in a sudden change in price. Supply shocks are generally negative, resulting in a sudden fall in supply but can also sometimes be positive, leading to increased supply.
Price level / average price level - the average of current prices across the entire spectrum of goods and services produced in the economy.
The activities are available in PDF at: ![]() Aggregate demand and supply
Aggregate demand and supply
Activity 1
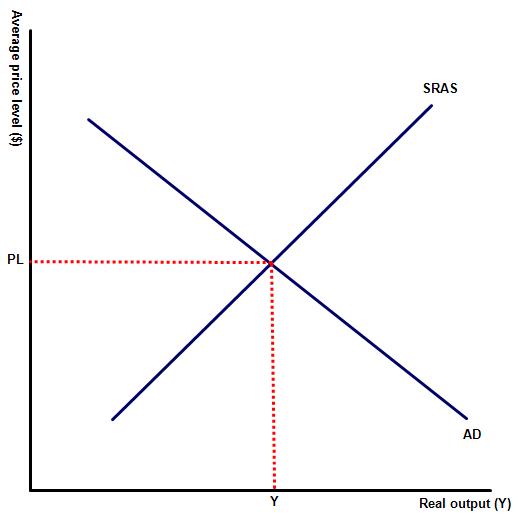
Draw a normal demand and supply curve for a good or service. Now consider how this might look if you were drawing a demand and supply curve for the whole economy? Instead of price write average price and instead of quantity label the horizontal axis real GDP, real national output or real national income.
Now consider what determines the level of aggregate demand and supply within any economy?
Activity 2
Watch the following short video and then answer the questions that follow:
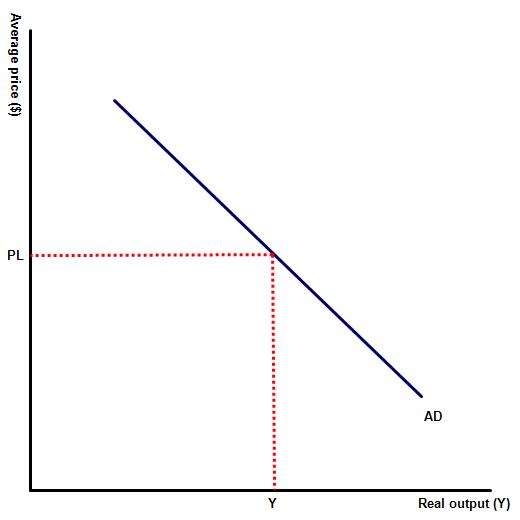 1. The diagram to the right illustrates the aggregate demand curve for a nation.
(a) What is the formulae for calculating AD in the economy?
AD=C+G+I+(X-M).
(b) Explain the inverse relationship between average price level and quantity demanded.
As average prices in the economy fall, consumers are more willing (rate of interest effect) and more able (income effect) to purchase goods and services.
(c) Provide examples of durable and non-durable goods.
Durable goods are those that can be used multiple times. Examples include cars, bicycles, smart phones e.t.c. By contrast non durable goods are single use only products such as food and beverages, toilet paper, newspapers e.t.c.
(d) Why are individuals 'investing' in the stock market or placing their savings in bank deposits not included under investment in AD calculations?
These are counted as part of saving, rather than investment and are withdrawals from the circular flow, rather than an injection into the economy.
(e) What is net investment spending?
Investment spending can be replacement spending which is the replacement of an outdated or obsolete machine with a newer replacement. Alternatively it can be new investment spending. Net investment, therefore, is calculated by total investment minus depreciation.
(f) How is the external balance (X-M) calculated?
Net trade is calculated by export revenues minus import expenditure or exports - imports.
(g) What is the opportunity cost of any investment decision.
The opportunity cost of investment is leaving money untouched in the bank or any other alternative use or the investment capital.
(h) The government is forced to cut spending on services and public works. Outline the consequence of this for aggregate demand in the economy?
Government spending is a component of AD so a reduction in government spending will lead to a fall in AD. There will be an initial fall in AD (caused by the reduction in public spending) followed by a further fall in demand, as the drop in economic activity filters through to reduced spending within households and businesses.
Activity 3: Aggregate supply
Begin with the following short video before completing the questions that follow:
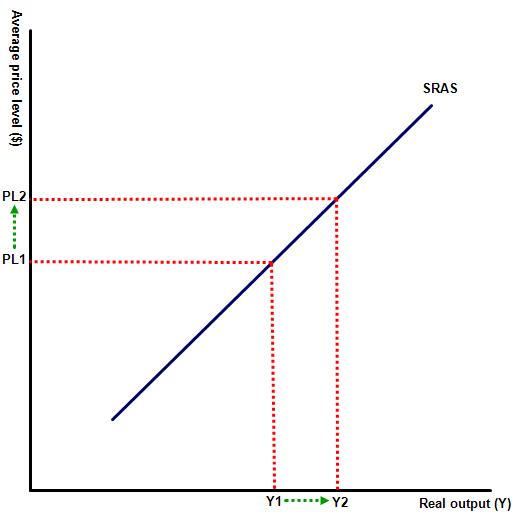 1. The diagram to the left illustrates a short run AS curve.
(a) Explain the relationship between average price level and the aggregate supply of goods and services in the economy?
There is a direct relationship between the level of aggregate supply and the real output in the economy. This is because when real national output rises the cost of production also rises. Raw materials become scarcer and firms may need to pay overtime rates in order to secure the workers they need in order to meet the higher production level. Similarly demand for raw materials, semi finished goods and even capital will rise, forcing up the prices of those items.
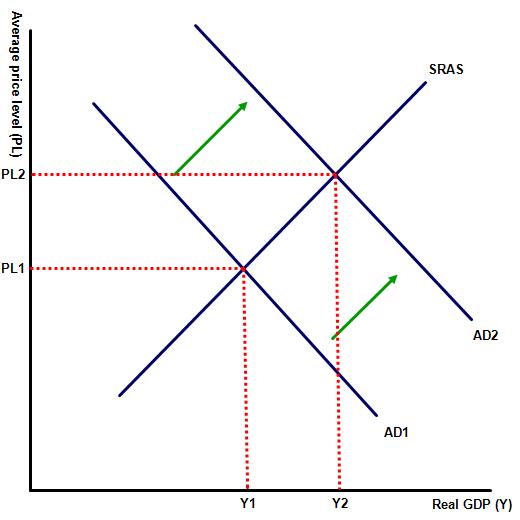
(b) Explain what happens to SRAS when real output in the economy moves from Y1 to Y2.
Average price level rises from PL1 to PL2, which represents an extension in aggregate supply.
Activity 4: Shifts in the AS curve
An economy is in equilibrium at PL1 and Y1. Calculate the new equilibrium as a result of the following supply shocks:
1. The government raises the level of minimum wage in the country, above the rate of productivity growth.
A rise in production costs, meaning that aggregate supply falls to SRAS2, though companies in this case may benefit from a rise in demand for their products from higher wages in the economy.
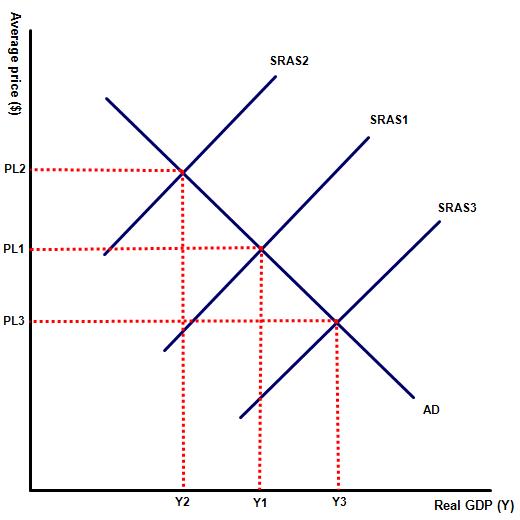 2. A sharp fall in oil prices, resulting from a glut in global supply.
Aggregate supply rises to SRAS3 and average price level falls to PL3.
3. A significant fall in the value of a nation's currency compared to its main trading partners.
A rise in production costs, meaning that aggregate supply falls to SRAS2.
4. A period of very low interest rates, over a sustained period of time.
Aggregate supply rises to SRAS3 and average price level falls to PL3.
5. A rise in the rate of sales tax.
A rise in production costs, meaning that aggregate supply falls to SRAS2.
Activity 5: Practise questions
 Illustrate the effect on either AS and / or AD of the following:
(a) A rise in income tax in the economy.
A fall in AD, i.e. a shift to the left. There is no impact on SRAS.
(b) A fall in oil prices.
AD is unaffected but there is a fall in production costs, i.e. a right shift in SRAS.
(c) A rise in interest rates in the economy.
AD will fall due to a fall in private consumption. This is shown by a left shift in AD. SRAS will also fall as the price of borrowing money rises.
(d) A rise in minimum wage.
A fall in AS due to a rise in wage costs. A rise in AD due to a rise in disposable incomes for low income households.
(e) A rise in the value of the currency relative to the country's main trading partners.
A rise in the AS curve due to a fall in import prices. A fall in AD due to a likely fall in the volume of exports.
(f) A fall in corporation tax rates.
AD and AS will rise.
Activity 6
Watch the following short video and then answer the questions which follow:
Questions
1. Evaluate the outlook for overall demand in the UK economy described in the video?
The overall outlook for the UK economy is poor with the economy predicted to decline (or at best stagnate) for the best part of 2023. This is the result of contractionary interest policy by the Bank of England in an attempt to stabilise prices after a period of high inflation.
Activity 7: Link to the paper one examination
Examples of typical paper one questions include:
Part (a)
(a) Explain how a rise in either business or consumer confidence can affect economic growth. [10 marks]
 Command term: Explain
Key term to explain: Economic growth
Economic growth can come from a rise in any of the components of aggregate demand - private consumption, government spending, investment and net exports. A rise in either business or consumer confidence is likely to encourage increases in company investment and private consumption. Therefore, all other things being equal a nation would expect to see a rise in economic activity, represented on the diagram by a rise from Y1 to Y2.
Part (b)
(b) Using real world examples, discuss the view that rises in economic growth will also lead to improved living standards in a country. [15 marks]
Command term: Evaluate
Key terms to explain: National income, standard of living
With the command term evaluate responses must consider the extent to which this statement is true or not?
Real world examples might include a comparison of two nations with similar levels of GDP per capita but very different HDI rankings or nations with comparable HDI e.g. Nigeria and Rwanda but where one (Nigeria) has a much larger GDP per capita because of its oil reserves. Another example might be a nation which has experienced very high levels of growth e.g. China, India or Mongolia but where this growth has come at a very high cost in terms of environmental degradation.
As with any part (b) response there are different views to consider. On one hand a rise in national income, measured by growth in real GDP per capita can make genuine improvements to a nation's standard of living. Higher incomes mean greater disposable income to spend on luxury consumer goods and services and greater life choices. A rise in economic growth also means more tax revenue for the government and this can be invested in public services such as health, education and infrastructure improvements. For this reason there is a very high correlation between rising economic growth and improved living standards, measured by HDI. The wealthiest nations by real GDP are in most cases those that also enjoy high levels of human development. Examples include the Nordic nations which occupy positions close to the top of both GDP and HDI rankings.
However, as with any theory there are examples when rises in economic growth have not contributed to improvements in living standards. Living standards are measured the human development index and GNI per capita is just one of the factors considered, the others being life expectancy and literacy rate. While nations enjoying economic growth might also see improvements in HDI this s not automatic. For example the wealth of some nations e.g. Nigeria is derived from the sale of petroleum, which has provided wealth for a small political elite but worsened the living standards of many ordinary Nigerians, whose once fertile soil has been degraded. Similarly rapid rates of growth in Brazil have come at the expense of the natural environment which is not sustainable. By contrast a nation such as Rwanda has made great strides in terms of development but not yet GNI per capita.
Responses should then reach a conclusion as to the validity of the statement supported by appropriate evidence. The conclusion should not include new information, not previously expressed in the response.
 Twitter
 Facebook
 LinkedIn