 IB Docs (2) Team

Unit 3.1(2): Measuring Economic Development
Economic development can be defined as the improvement of the well-being of a country’s citizens over time. Welfare or well-being are subjective terms, which makes defining economic development as 'an improvement in well-being' an open-ended statement that is difficult to quantify. Economists view development in a multi-dimensional way that takes into account a number of different factors.
- Defining and measuring economic development
- Appropriateness of using GDP or GNI statistics to measure economic well-being
- Use of national income statistics to make comparisons over time and between countries
- Alternative measures of well-being: OECD Better Life Index, Happiness Index, Happy Planet Index
Revision material
![]() The link to the attached pdf is revision material from Unit 3.2: Measuring economic development. The revision material can be downloaded as a student handout.
The link to the attached pdf is revision material from Unit 3.2: Measuring economic development. The revision material can be downloaded as a student handout.
Defining economic development
Economic development can be defined as the improvement of the well-being of a country’s citizens over time. Economic development is, however, difficult to define because it focuses on the improvement in the welfare or well-being of a country’s population. Welfare or well-being are subjective terms, which makes defining economic development as 'an improvement in well-being' an open-ended statement that is difficult to quantify. Economists often view economic development in a multi-dimensional way that takes into account a number of different factors.
Characteristics of economic development
Many economists look at improvements in welfare by considering the following characteristics:
- Rising household incomes, which gives the population greater access to goods and services that improve their material quality of life
- Falling levels of poverty so everyone in society can enjoy a basic level of welfare
- Increased provision of public services like education and health to give people the ability to improve their well-being.
Many other characteristics could be considered, but these provide economists with a basic framework to understand and measure economic development. The characteristics considered above are based on the UN Development Programmes, Human Development Index (HDI), which we will cover later in this chapter.
Measuring economic development
Real GNI per capita
The princip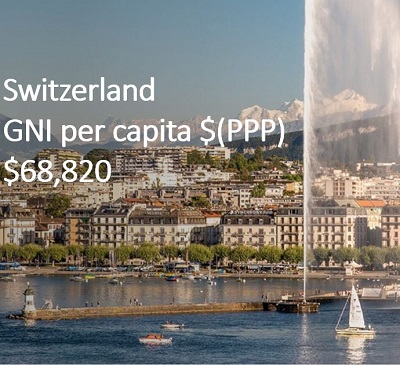 le that the higher the real GNI per capita a country has the more advanced its economic development is based on the idea that countries with a higher real GNI per capita will have:
- Higher average incomes and their households have greater access to goods and services
- Lower levels of poverty as the poorest in society have more income.
- Better healthcare and education provision as the government has more tax revenue to spend on public services.
This means countries with a higher real GNI per capita will have a better level of welfare for their population than countries with a lower real GNI per capita. The table sets out GNI per capita for five More Economically Developed Countries (MEDCs) in 2021.
| Rank | Country | GNI per capita $ PPP |
| 1. | 90,360 | |
| 2. | 84,090 | |
3. | 81,110 | |
4. | 74,520 | |
5. | 70,430 | |
6. | 68,110 |
Purchase power parity (PPP)
An important element of using GNI per capita to measure economic development is to convert GNI numbers into a common currency so they can be used for international comparison. For example, to compare the GNI of European countries with the US, Euros need to be converted into US dollars. We could use market exchange rates to do this, but market exchange rates are constantly changing from day to day because of demand and supply changes in the currency markets. A current market exchange rate would give a misleading GNI conversion. Countries use a method called purchase power parity(PPP) to convert their GNIs into US dollars.
The PPP is a long-term exchange rate calculated by considering the ratio of prices in one country compared to another. A basket of goods is chosen in each country that represents the typical basket of goods consumers buy.
Price of the basket of goods in the US / price of the basket of goods in the EU = PPP exchange rate
 Singapore is ranked 9th in the world with a GNI per capita of US$58,770. This is one author's view of what it is like to live in a ‘top 10’ country.
As I walked through downtown Singapore one phrase kept coming to me – ‘what a place to live’. The exceptionally clean streets, the buildings covered in walls of plants and highways shaded by umbrella-like rain trees and bougainvillaea. People are healthy here with Singapore’s healthcare system often held up as an example of excellence. The average life expectancy is 83 years.
Its universities consistently rank among the top in Asia and attract many international students from the region. With a median income of US$, 67,152 people live well. And one way they do this is through their food. The city's Chinese, Indian, and Malay populations bring their unique culinary cultures to the food scene. On top of this, Singapore has a cultural richness that makes it one of the most sort-after places to live in the world.
Questions
a. Outline how you would measure Singapore's real GNI per capita. [2]
GNI is GNP + net property income from abroad. This is converted into real terms to allow for inflation using the GDP deflator. The per capita figure is calculated by dividing the real GNI by Singapore's population.
b. Explain how PPP is used to calculate Singapore’s GNI per capita in US dollars. [4]
The PPP is a long-term exchange rate calculated by considering the ratio of prices in one country compared to another. In this case, the ratio of prices in Singapore relative to the US. A basket of goods is chosen in each country that represents the typical basket of goods consumers buy.
Price of the basket of goods in the US / price of the basket of goods in Singapore = PPP exchange rate
c. Explain two reasons why a high real GNI per capita in Singapore would lead to better living standards for the population. [4]
Explanation of any two reasons that a high real GNI per capita would lead to better living standards in Singapore from:
- Higher household incomes mean the population can buy more goods and services and improve their material welfare.
- The government has high tax revenues and can spend more money improving public services such as health and education.
- Increased incomes for the poorest in society reduce the level of poverty.
Investigation
Research the GNI per capita of your own country and see how this relates to the well-being of the people who live there.
Problems of using GNI per capita to measure economic development
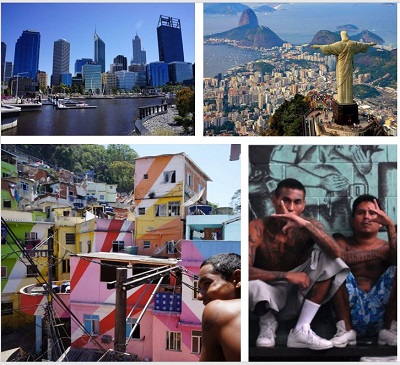
Income distribution
The GNI per capita is an average and that does not account for the disparity between the richest and poorest people in society. The GNI per capita of a country may be high, but this can give a misleading view of welfare if there is a high concentration of income amongst a small percentage of the richest people in society.
The nature of goods produced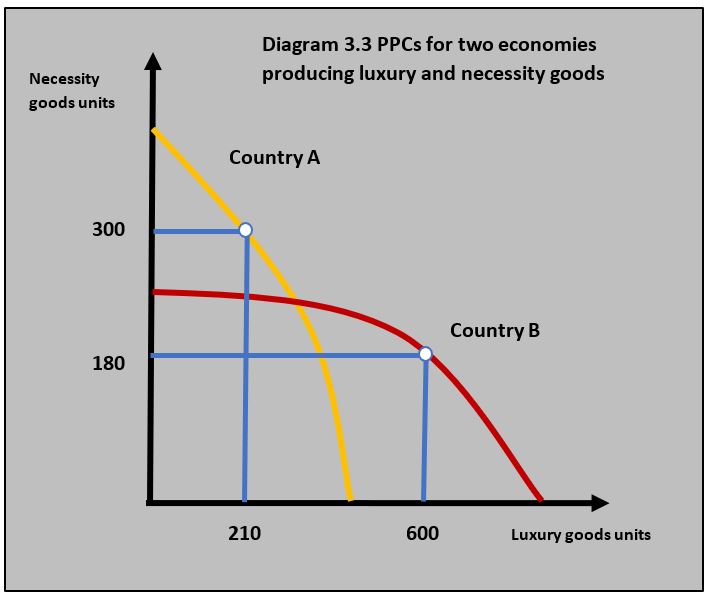
Some goods produced and consumed in a country add more to welfare than others. For example, $20 million spent on a school may well create more welfare than the same amount spent on a very expensive yacht because the social benefit to society of the consumption of education is greater than a yacht. Countries, where a high proportion of output is spent on luxury goods compared to necessity or merit goods, may have lower levels of overall welfare amongst the population.
Diagram 3.3 shows the production possibility curves for two economies, country A and country B. Country A could be said to have higher welfare amongst its citizens relative to country B because it allocates more resources to necessity goods.
Changes in quality over time
It can be argued that economic growth understates economic development because the quality of products produced by an economy improves over time. The cars, computers and mobile phones consumers buy now are superior to the cars, computers, and mobile phones they bought 10 years ago. This will not be reflected in the GNI figures because they only reflect the money value of the products bought by consumers.
Non-monetary factors
Some factors in a country add to welfare but cannot be measured in money terms, and so will not show in the GDP/GNI figures. Here is a sample list of factors that can affect the welfare of the population and are not included in real GNI per capita data:
- Crime rates - a high crime rate will reduce welfare in a country.
- Political Freedom - greater political freedom in a nation is often seen to increase welfare.
- Leisure time - societies, where people have more leisure time, can offer their population a greater quality of life.
- Climate - favourable weather conditions can offer a better standard of living.
- Family and cultural values - societies where people feel closer to friends and relatives are often viewed as happier.
- Mental health - low levels of stress, anxiety and depression are indicators of good levels of welfare.
- Gender and racial equality - more equal societies are often viewed as ones with higher welfare.
Alternative methods of measuring economic development
The real GNI per capita figure offers economists an objective figure with which to assess the economic development of a country, but it has limitations in terms of its use to measure the welfare or well-being of a country’s population. To consider welfare data in a wider sense, economists have developed a range of broader-based methods of measuring economic development. Whilst these alternative measures look at welfare in society in a more sophisticated way than GNI, they do have weaknesses. As they are averages they do not reflect everyone’s well-being and they try to measure things that are very difficult to measure, like collective happiness.
Human development index (HDI)
The Human Development Index is used by the United Nations Development Programme to measure a country's economic development in terms of life expectancy, education, and material standard of living.
The following criteria are used in the construction of the HDI:
- Life Expectancy in years (health indicator)
- Mean years of schooling and expected years of schooling (education indicator)
- Real GDP per capita (income indicator)
The three criteria are combined to give a numerical value from 0-1, where the HDI value is closer to 1 the more developed a country is.
OECD Better Life Index
The Organisation for Economic Co-operation and Development has developed a broader measure of well-being which looks at some of the key factors that affect the welfare of a nation’s population. The Better Life Index uses 11 criteria that are objectively measured in a country to form an index number. The criteria include:
- Housing
- Income
- Employment
- Community life
- Education
- Environmental factors
- Governance
- Health
- Level of happiness
- Safety and security
- Work-life balance
World Happiness Report
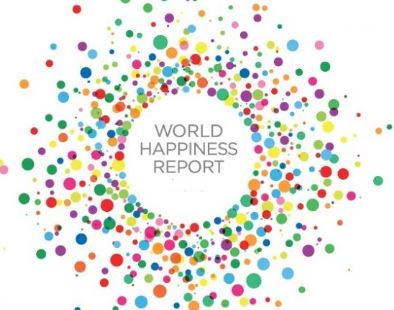 Along with the Human Development Index, the United Nations has also developed the World Happiness Report is based on a survey of how people rate their own lives. The survey ranks national happiness using a survey that asks a sample of respondents to think of their happiness as a ‘ladder’, with the highest life rating being a 10 and the lowest life rating being a zero. The individuals who are part of the survey have to consider factors such as citizen engagement, communications, technology, education, health, emotion and diversity, etc when they are making their judgement about happiness. The responses of a sample of individuals within a country are then aggregated to form the index.
Happy Planet Index
The Happy Planet Index measures the sustainable well-being of a nation’s population. It considers the welfare of a nation in terms of achieving sustainable lives for its citizens. It was introduced by the New Economics Foundation (NEF) and uses a weighted index that favours countries with smaller ecological footprints. There are four elements used to construct the Happy Planet Index: well-being (based on the World Happiness Report), life expectancy, inequality of outcomes (based on well-being and life expectancy) and ecological footprint (average impact a citizen has on the environment).
Costa Rica is a country that has always performed well in Happy Planet Index. Its relatively good scores on life expectancy, well-being, ecological footprint and inequality give it a Happy Planet Index score of 44.7 well above its richer neighbour, the United States.

According to last year’s World Happiness Report produced by the UN, Norway has been overtaken by Finland to become the happiest place to live on earth. The report also shines a light on the decline of the US as its people struggle with obesity, substance abuse and depression. The report shows how the US has fallen to 18th place down from 13th. Scandinavian countries dominate the chart, with Finland followed by Norway, Denmark and Iceland. Burundi is the unhappiest place in the world. The East African country is scarred by ethnic cleansing, civil wars, crime and political conflict.
The happiness report is an annual publication produced by UN Sustainable Development Solutions Network. It said all the Nordic countries scored highly on income, healthy life expectancy, social support, freedom, trust and generosity. The rankings are based on Gallup polls of self-reported well-being, as well as perceptions of corruption, generosity and freedom.
Questions
a. Explain how the World Happiness Report can be used to measure welfare in a country. [4]
The World Happiness Report is a survey of people in a country that asks respondents to rate their level of happiness on a scale of 1 - 10. The individuals who are part of the survey have to consider factors such as citizen engagement, communications, technology and diversity, etc when they are making their judgement about happiness. The index for each person who is part of the survey is then aggregated for the whole population of the country and a single value is used to measure happiness or welfare.
b. Outline what the Happy Planet Index measures. [2]
The Happy Planet Index measures the sustainable well-being of a nation’s population. It considers the welfare of a nation in terms of achieving sustainable lives for its citizens. The factors in the index are wellbeing, life expectancy, inequality and ecological footprint.
c. Using a real-world example, evaluate the view that real GNI per capita is the most effective way of measuring welfare in a country. [15]
Answers might include: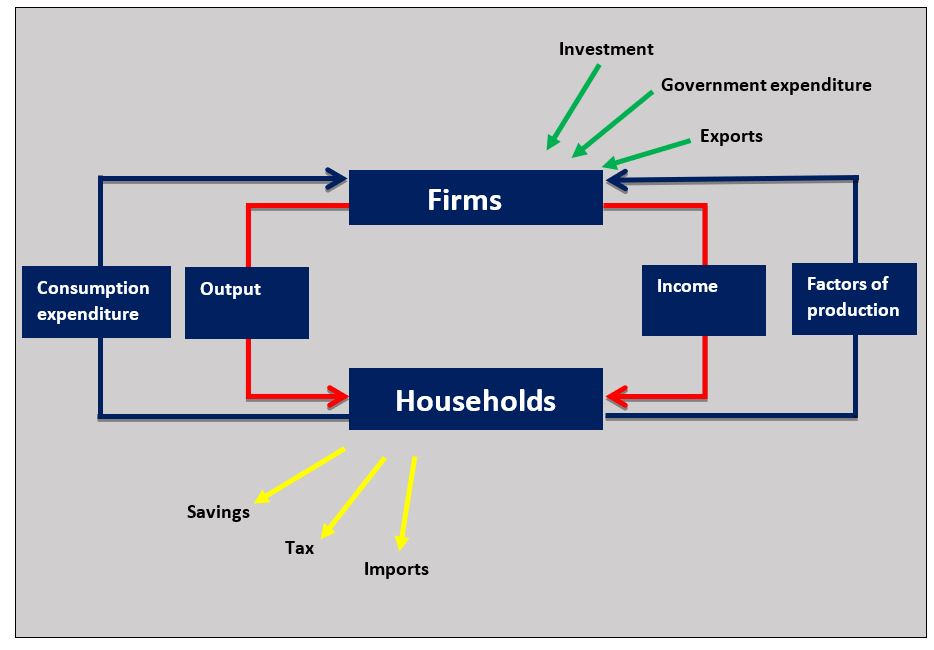
- Definitions of real GNI per capita and welfare.
- A circular flow of income diagram to show how high income, output and expenditure can increase welfare.
- An explanation that high real GNI per capita can improve welfare in a country through higher household incomes, greater availability of goods and services, better public services like health and education, increased employment and better infrastructure.
- An example of the use of real GNI per capita to measure welfare. The case example here is Finland.
- Evaluation that considers the weaknesses of real GNI per capita as an indicator of welfare such as income inequality, non-monetary factors that affect welfare, nature of goods produced by a country and changes in the quality of goods.
- Evaluation could also consider alternative methods of measuring welfare more effectively such as HDI, World Happiness Report and the Happy Planet Index.
Investigation
Research another country in the World Happiness Report and discuss with your class why the population are so happy or unhappy.
The OECD considers economic well-being as a “virtuous circle” where collective well-being and long-term economic growth re-enforce each other to enhance welfare in society. This is based on the principle that economic growth improves well-being as people enjoy higher standards of living which in turn leads to economic growth as a healthier, better-educated population increases the potential output of the economy. The idea of a 'virtuous circle' does, however, rely on assumption that economic growth leads to improvements in economic well-being amongst the collective population.
What happens if the benefits of economic growth are concentrated amongst a wealthy minority? Does the Virtuous circle still work?
Using the following data, which figure is the real GNI per capita of country A?
Real GDP
Net property income
Population 27 million
Which of the following is calculated using the equation: Price of the basket of goods in country A / price of the basket of goods in country B?
Which of the following components is not included in the HDI?
Which of the following is not a problem of using real GNI per capita to measure economic development in a country?
The GNI per capita is calculated by using the population of the country.
Which of the following is untrue about the different methods of measuring economic development?
Which of the following is least likely to be true about real GNI per capita?
It is related to average household income but it is not the same average household income. Remember only a proportion of the population is in work.
Which of the following is not a characteristic of economic development?
Widening income inequality is a barrier to development.
Which measure of economic development is based on 11 criteria that include: housing, income, employment and community life?
Which of the following best describes the Happy Planet Index?
The Happy Planet Index is a measure of development that focuses on sustainability.
Which of the following is not a characteristic of the World Happiness Report?
The World Happiness Report is produced by the UN.
 Twitter
 Facebook
 LinkedIn