 IB Docs (2) Team

Unit 2.5: Price elasticity of demand
 Introduction
Until now your students will have largely worked on the assumption that demand is linear and that the relationship between selling price and quantity demanded was the same or at least similar for most products - the exceptions being giffen and veblen goods. This section of the site focuses on how the relationship between the two variables changes, according to the elasticity of the good or service. This page concentrates on the first of the 4 types of elasticity in economics.
Price elasticity of demand can be described as the responsiveness of quantity demand to changes in the selling price of a good or service.
Enquiry question
An understanding that the change in quantity demanded for different goods and services will respond differently to changes in price. Teacher notes
Lesson time: 1 hour
Lesson objectives:
An understanding of the concept of price elasticity of demand, as the responsiveness of quantity demanded to a change in price, along a given demand curve
Learning how to calculate PED using the equation percentage change in quantity demanded / percentage change in price
An understanding that the PED value is treated as if it were positive, although its mathematical value is usually negative.
Explain, using diagrams and PED values, the concepts of price elastic demand, price inelastic demand, unit demand, perfectly elastic demand and perfectly inelastic demand.
Teacher notes:
1. Opening activity - involves two questions designed to introduce the concept of PED. The first involves correctly labelling three demand diagrams from the whiteboard. At this point your students will not be familiar with the concept of PED elasticity, but I find a number of IB students are able to make the connection between the shape of the demand curve for a basic necessity and one for a luxury item.
Activity 2 - this starts with your classes writing down the most commonly purchased items. Some of these will be basic necessities, that they cannot do without while other products will be luxury items that they will forego when the price of those goods and services rises. They should be able to this list into a list of goods and services with different elasticities.
3. Processes - technical Vocabulary - your classes can learn the required vocabulary watching the video and studying the class handout which follows. This is along handout and together with the video, the first two activities should take around 25 minutes.
4. Reinforcement activity - attached to the class handout are 3 short questions on PED elasticity.
5. Link to the assessment - this page includes a section on the assessment and where PED elasticity theory is likely to be found, which you can project onto the whiteboard for your classes to read and discuss.
6. Final reflection activity - the elastic band activity is a fun activity that will allow your students to reflect on how different products respond differently to a change in price, represented by the stretching of each elastic band.
Beginning activities
1. Start by drawing three PED diagrams on the whiteboard, one PED inelastic, one elastic and the other PED unitary. have  your classes draw the same in their books and then label each with three different products e.g. cruise holidays, bread and second hand cars. Ask your students to think about which good is likely to see the largest change in quantity demanded following a change in price?
2. Next, have your classes write down a list of your 5-10 main expenditures and write down whether the good is a basic necessity for you or a luxury item? Suppose each of the items on your list rose in price by 10%. Now next to each assign one of the following labels to each item:
a. Following a rise in price of 10%, I would reduce my consumption of the product by more than 10%.
b. Following a rise in price of 10%, I would reduce my consumption of the product by less than 10%.
c. Following a rise in price of 10%, I would reduce my consumption of the product by about 10%.
Decoding your classes' lists
 Your classes should have compiled a list of 5-10 goods and services that you frequently purchase and next to each should have written a, b or c. It will be obvious that the (a) list includes price elastic goods e.t.c. So having completed this exercise discuss what made each of you write (a) by some items and (b) others?
Perhaps they selected items as (a) because you consider them to be of only marginal importance to your life - luxury items which are nice to have but you can live without? Perhaps you chose to reduce consumption of those items because you can easily switch your consumption to a similar product?
Now consider the items they have selected (b) for. Why was this? Perhaps these items are necessary items for you? Perhaps you chose not to reduce yor consumption of those items because there are no real alternatives for them?
This is the beginning of an understanding of PED elasticity.
Video on price elasticity
Watch the following short video before reading the handout that your teacher will give you.
 Key terms:
Price elasticity of demand (PED): The responsiveness of quantity demanded to changes in the selling price of a good or service.
PED formulae: % change in quantity demanded / % change in selling price.
PED elastic good: A good or service where a change in the price of the product leads to a greater than proportional change in quantity demanded. PED elastic goods have a PED greater than 1 (a top heavy fraction).
PED inelastic good: A good or service where a change in the price of the product leads to a smaller than proportional change in quantity demanded. PED inelastic goods have a PED less than 1 (a bottom heavy fraction).
PED unitary good: A good or service where a change in the price of the product leads to a proportional change in quantity demanded. Unitary elastic goods have a PED = 1.
 How to remember the formulae for PED
Students will normally find it easy to remember the variables in the formula but will get confused with which is the denominator and which, the numerator. The way to remember that you always place the % change in QD on top (numerator) and the % change in price on the bottom (denominator) of the fraction is to remember this simple phrase, you always Q before you P.
 Examples of PED elasticity
1. A good sees a 10% rise in quantity demanded in response to a 5% fall in price. This would be expressed by the equation 10 / 5 = 2 (elastic PED)
2. Quantity demanded for a service rises by just 2% in response to a fall in the price of the service of 20%. This would be expressed by the equation 2 / 20 = 0.1 (PED inelastic)
3. When the price for a good rises from £ 5 to £ 6, quantity demanded for that product falls by 20%. This would be expressed as 20 / 20 = 1 (unitary elasticity).
Activities
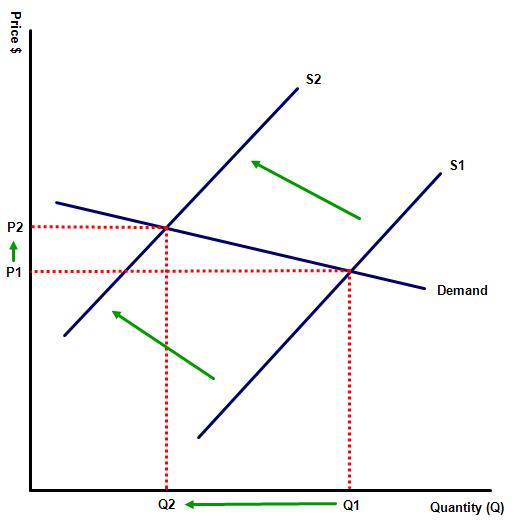
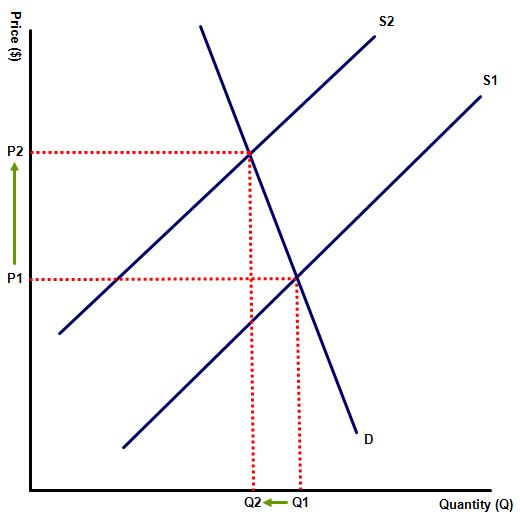
1. The following three diagrams represent the market for three different products - cruise holidays, bread and second hand cars.
![]()

Which diagram represents each good?
1. top left = used cars, a PED unitary good
2. top right = bread, a PED inelastic good
3. bottom = cruise holidays, a PED elastic good.
Activity 2
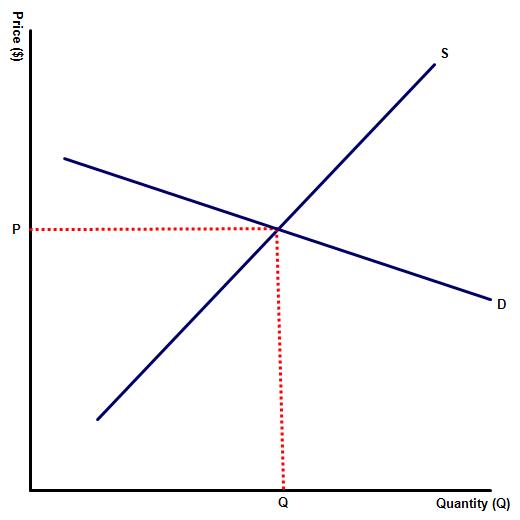
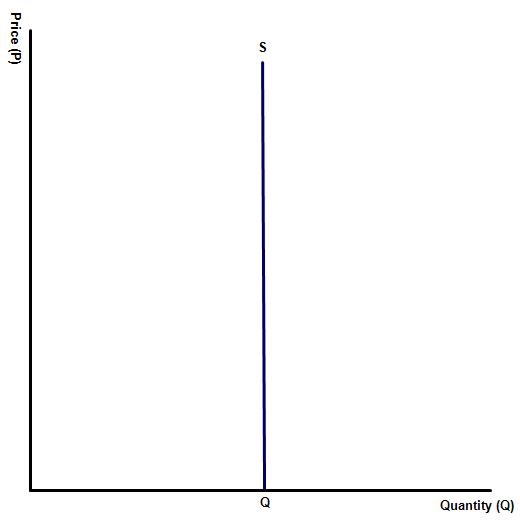
The next two diagrams illustrate a perfectly elastic demand curve, with a PED of infinity, as well as a good with a PED of 0. Which is which?

A note about perfectly elastic / inelastic demand curves
A product with perfectly inelastic demand has a PED of 0. This means that changes in price will have no impact on the quantity demanded for a good or service. This is illustrated on the diagram, where following a price change from (P1 to P2), there is no resulting change in quantity demanded.
By contrast, the final diagram illustrates a perfectly elastic demand curve, with a PED of infinity. At the market price quantity demand for these goods and services is infinite and firms can sell all of their produce, while at any other price demand falls to 0.
Activity 3: Calculating PED elasticity
1. Calculate the PED for each product, and then comment on your result.
(a) The price of a camera is valued at $150, and the quantity demanded at this price is 4 million units. During the end of year sales the shop reduces the price to $130 and as a result the quantity demanded rises to 6m.
50 / 13 = 3.85, thus making the camera a highly PED elastic product. The shop should receive a higher revenue from selling the cameras at the reduced price.
(b) The same shop sells batteries for their cameras for just $1, and the quantity demanded is 10 million. Following a price rise to $1.10 the quantity demanded falls to 9,500,000 units.
5 / 10 = 0.5, thus making the batteries for the camera PED inelastic. The shop should be advised against this price reduction as the new sales revenue generated will be lower than the initial revenue generated.
(c) The same shop also sells flash lights for $5, and the quantity demanded at this price is 2 million units. Following a reduction in the selling price to $4.50, quantity demanded rises to 2.2m
10 / 10 = 1, making this product PED unitary. Changing the selling price of this good will have no impact on the revenue collected. For example, the revenue at $5 = 5 x 2m = $10m while at the lower price the revenue is $4.50 x 2.2m = $9.99 (10m)
 Question 2
Orhan Bufe is a snack and sandwich shop, operating in the popular Blue Mosque area of the city, where there are many similar businesses operating. Its fastest selling products are hamburgers, cheese toasties and shish kebabs. These products currently sell for the following prices: hamburgers 10 TL, cheese toasties 8TL and the shish kebab, the Bufe’s signature dish sells for 12 TL. In 2018 the firm sold 10,000 hamburgers, 15,000 cheese toasties and 40,000 shish kebabs.
In an attempt to try and improve revenue the owner Orhan Uluturk decided to increase all prices by 10%. Market research gained from other similar shops in the area suggests that the price elasticity of demand for each product is:
Hamburger: (-) 1.5; Cheese toast : (-) 2.0; shish kebab: (-) 0.6
You have been asked to evaluate the planned price increases.
(a) Comment on the planned price changes.
Following a rise in the selling price of the three products of 10% the owner can expect to see a 3.4% rise in revenue for his shish kebabs, but a fall in revenue for his other products.
(b) Would a 10% price reduction have been better for some or all of the products?
A reduction in the selling price of both Hamburgers and Cheese toasts would benefit the Bufe, providing that increased sales for those products does not divert business away from his sales of shish kebab.
(c) What benefit (if any) would advertising bring to the firm?
Possibly, the area where the Bufe is located contains a number fo similar businesses and carefully targetted advertising, perhaps aimed at the cities tourist visitors might well prove to be profitable.
Question 3
A local delivery firm produces three types of home cooked food for delivery to homes in the local area. The firm completed market research, to discover the likely demand curves for each of the three meal packages. The results are shown below: (Monthly sales).
Price | Packet A (Qd) | Packet B (Qd) | Packet C (Qd) |
13 | 800 | 1,700 | 1,000 |
12 | 840 | 1,980 | 2,000 |
11 | 880 | 2,520 | 3,000 |
10 | 920 | 2,800 | 4,000 |
9 | 960 | 3,080 | 5,000 |
8 | 1,000 | 3,360 | 6,000 |
7 | 1,040 | 3,640 | 7,000 |
6 | 1,080 | 3,920 | 8,000 |
(a) Calculate PED for all three packages over the price range £10 to £11.
Package A is calculated by % change in QD (40/920) = 4.35 / % change in price (1/10) = 10 so 4.35 / 10 = 0.35 so PED = 4.35/10 = 0.44
Package B a PED of 1 i.e. (- 280 / 2800) / (1/10) = 1
Package C has a PED of 2.5.
(b) What price must be charged for each package if the firm wishes to maximise their sales revenue?
A would be most profitable at a selling price of £13, generating £10,400 in sales.
B would be most profitable at a selling price of £10, generating £28,000 in sales.
C would be most profitable at a selling price of £7, generating £49,000 in sales.
Class notes available as a PDF at: ![]() Elasticity
Elasticity
An important note about elasticity
Sometimes during your IB classes one of your students may describe a PED elastic good as a good or service which changes when price changes. Similarly, they may describe a PED inelastic good as one that doesn't change when price changes. This is of course false, demand for the vast majority of products changes in response to a change in price, both PED elastic and inelastic goods − perfectly inelastic goods are the exception. The difference is the degree to which demand for the good or service changes.
 4. Link to the assessment
The concept of PED elasticity can appear across all sections of the assessment. In paper one candidates may be asked to explain the concept of PED in relation to two different products, for example, the luxury and used car markets, while in paper two PED elasticity is used to explain the relationship between the price of a nation's currency (exchange rate) and its current account (trading) balance. In the paper three students may be asked to calculate the PED of a given good or service, from a given set of numerical data and/or required to explain which factors determine the price elasticity of demand for a product.
The concept of PED elasticity can also be used as part of the internal assessment e.g. an article relating to the relative PED inelasticity of cigarettes or oil and may also form part of an extended essay in economics.
5. Reflection: Elastic band activity
 This fun interactive activity is a good way of learning the concept of elasticity, by connecting the responsiveness of rubber bands to the responsiveness of quantity demand to a price change. Start by handing out a handful of different rubber bands, some that stretch more than the others. Using a pen or felt tip marker students will then be instructed to write the different name of a good or service on the elastic band, according to how PED elastic or inelastic the product is.
As the students are stretching the rubber bands, you will need to highlight that the rubber band that stretches more has a larger response to being pulled and is considered elastic. The rubber band that stretches less, i.e. is less responsive can be considered inelastic.
This activity should take no more than 10 minutes or so and afterwards some of your students can demonstrate what they have learnt, by stating the name(s) of the product as they stretch the elastic by the appropriate amount.
 Twitter
 Facebook
 LinkedIn