 IB Docs (2) Team

Economic profit (HL only)
 Introduction
This lesson looks at the different types of economic profit − normal (zero profit), abnormal (economic profit) and loss (negative economic profit). Implicit costs (that make up economic profit) are no longer part of the new syllabus.
Enquiry question
What are the different types of profit in business - normal profit, loss and abnormal profit levels and how can we illustrate each on a diagram.
 Teacher notes
Lesson time: 80 minutes
Lesson objectives:
Describe different types of profit within businesses.
Recognise that economic profit (abnormal profit) is the case where total revenue exceeds economic cost.
Explain the concept of normal profit (zero economic profit) as the amount of revenue needed to cover the costs of employing self-owned resources.
Explain the meaning of loss as negative economic profit arising when total revenue is less than total cost.
Explain why a firm will continue to operate even when it earns zero economic profit (abnormal profit).
Calculate different profit levels from a set of data.
Illustrate different profit levels using diagrams.
Teacher notes:
1. Beginning activity - begin with the opening question and allow 5 minutes for discussion.
2. Processes - technical Vocabulary - the students can learn the key concepts through the initial video and handout which should take 15 minutes to go through and discuss. (15 minutes)
3. Diagram practise - activity 1, included on the handout requires your classes to practise drawing the appropriate diagrams for each of the three types of profit. I start by having each draw three identical diagrams, with MC=MR. I draw the same three diagrams on the whiteboard. Then I will usually ask a volunteer to come up to the board and simply by drawing three AC curves, the 3 diagrams are complete. Allocate 15 minutes for this exercise.
4. Paper three practise activities - the handout also includes three paper three practise activities. I don't generally require every student to complete all three but the third is there for the advanced students who want more practise. (30 minutes)
5. Reflective activity 5 - includes a paper one, section A style question including a suggested response. (5 minutes). This could also be set as a homework or classwork exercise.
6. Practical application of profit - includes a video showing a short lecture of why many start up companies but some do not? Allow 10 minutes for this video and short discussion.
Beginning question
Imagine that you resign from a well paid job earning $ 90,000 per year and set up a business. What would your break-even level of profit be?
As you will have learnt during the previous lesson the answer may surprise you, it is not $0 as you would expect but $ 90,000. This being the amount that you would need to earn in order to cover your opportunity costs? In economics we call this level normal profit, rather than break-even.
Beginning activity
Begin this lesson by taking a look at the following video and then explain what you have learnt about the difference between revenue, expenses (costs) and profit.
Revenue is money coming into the business
Cost is money that the firm pays (do not confuse this with costs that you as a consumer pays_
Profit = revenue minus cost.
 Key terms:
Profit: Calculated by revenue (sales revenue) minus cost
Profit maximising level of output: Where MC=MR
Normal profit: AR=AC or TR=TC, when the revenue coming into the business equals the costs or running the business, including the implicit costs
Abnormal profit: AR > AC or TR >TC, when the revenue coming into the business more than covers the costs of running the business, including the implicit costs
Loss: AR < AC or TR < TC, when the revenue coming into the business is insufficient to cover the costs of running the business, including the implicit costs.
The activities can be downloaded as a PDF file at: ![]() Economic profit
Economic profit
Activity 1: Complete the table, showing the profit made by the businesses
| Firm X | Firm Y | Firm Z | |
| Total revenue ($) | 500,000 | 900,000 | 350,000 |
| Total fixed cost ($) | 150,000 | 400,000 | 100,000 |
| Total variable cost ($) | 350,000 | 700,000 | 150,000 |
| Total economic cost ($) | 500,000 | 1,100,000 | 250,000 |
| Economic profit ($) | 0 (normal profit) | 200,000 (loss) | 100,000 (abnormal profit) |
A note about profit maximising. A firm producing where profit is maximised is not guaranteed to make abnormal profit. The company, for example might be making normal profit only or even be making a loss. However, the point where MC = MR will still represent the output level providing them with the lowest loss available to them.
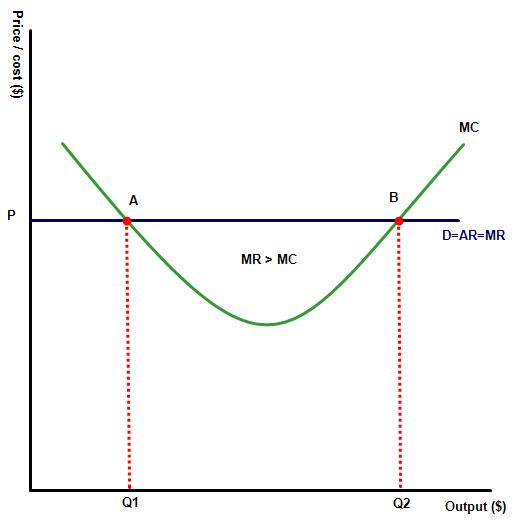 Activity 2: When MR intersects at two different points on the MC curve
The diagram to the left illustrates the bottom section of a firms marginal costs. In this example, the MC curve intersects with the MR at two different points, illustrated on the diagram below at points A and B.
Which point should the profit maximising firm produce at?
It should be obvious that in this instance the profit maximising point is at the point where the MC curve intersects with the MR curve from below. A firm choosing to produce at point A on the diagram would miss out on the profit gained from all the units between Q1 and Q2 − each of those units has a higher MR than MC.
Activity 3: Paper three type questions
Watch the following short video, from ACDC economics and then use the information from the video to answer the 3 activities which follow:
1. (a) Complete the following table:
Output level | Revenue from sales $ (000) | Total cost $ (000) | MR | MC | Total profit $ (000) |
100 | 350 | 300 | 50 | ||
Δ in Revenue / Δ in output = 200/100=2 | Δ in Costs / Δ in output = 60/100=0.6 | ||||
200 | 550 | 360 | 190 | ||
1.6 (160/100) | 0.8 (80/100) | ||||
300 | 710 | 440 | 270 | ||
1.2 | 0.9 | ||||
400 | 830 | 530 | 300 | ||
1 | 1 | ||||
500 | 930 | 630 | 300 | ||
0.8 | 1.05 | ||||
600 | 1,010 | 735 | 275 | ||
0.7 | 1.1 | ||||
700 | 1,080 | 845 | 235 | ||
0.6 | 1.12 | ||||
800 | 1,140 | 957 | 183 | ||
0.5 | 1.15 | ||||
900 | 1,190 | 1,072 | 118 | ||
0.4 | 1.99 | ||||
1,000 | 1,230 | 1,271 | (41) |
(b) Illustrate the level of output at the profit maximising point.
(c) Illustrate the level of output at the revenue maximising point.
2. (a) Complete the following table:
Output | Sales revenue $ (000) | Total cost $ (000) | MR $ | MC $ | AR $ | AC $ | Profit $ (000) |
10,000 | 180 | 60 | 18 (TR/Q) | 6 (TC/Q) | 120 (TR-TC) | ||
Δ in Revenue / Δ in output = 160/10=16 | Δ in Costs / Δ in output = 40/10=4 | ||||||
20,000 | 340 | 100 | 17 | 5 | 240 | ||
14 | 6 | ||||||
30,000 | 480 | 160 | 16 | 5.33 | 220 | ||
12 | 8 | ||||||
40,000 | 600 | 240 | 15 | 6 | 360 | ||
10 | 10 | ||||||
50,000 | 700 | 340 | 14 | 6.8 | 360 | ||
8 | 12 | ||||||
60,000 | 780 | 460 | 13 | 7.67 | 320 | ||
6 | 14 | ||||||
70,000 | 840 | 600 | 12 | 8.57 | 240 | ||
4 | 16 | ||||||
80,000 | 880 | 760 | 11 | 9.5 | 120 | ||
2 | 18 | ||||||
90,000 | 900 | 940 | 10 | 10.44 | (40) |
(b) Identify the profit and revenue maximising point?
(c) Illustrate the above table in a graph showing the profit and revenue maximising points.
3. (a) Complete the following table:
Output level | Sales revenue ($) | Total cost $ | MR | MC | Profit $ |
1,500 | 15,000 | 9,250 | 5,750 (revenue-cost) | ||
16 (8,000/500) | 4 (2,000/500) | ||||
2,000 | 23,000 | 11,250 | 11,750 | ||
14 | 6 | ||||
2,500 | 30,000 | 14,250 | 15,750 | ||
12 | 8 | ||||
3,000 | 36,000 | 18,250 | 17,750 | ||
10 | 10 | ||||
3,500 | 41,000 | 23,250 | 17,750 | ||
8 | 12 | ||||
4,000 | 45,000 | 29,250 | 15,750 | ||
6 | 14 | ||||
4,500 | 48,000 | 36,250 | 11,750 | ||
0 | 16 | ||||
5,000 | 48,000 | 44,250 | 3,750 | ||
(1) | 18 | ||||
5,500 | 47,500 | 53,250 | (5,750) |
Activity 4: Guidance on drawing the graphs
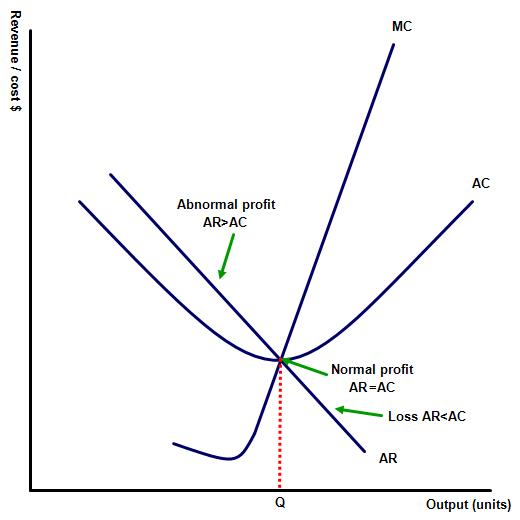
 When completing paper one style examination questions you will need to illustrate your responses on a graph showing a firm making either a loss, normal profit or abnormal profits. Practise drawing all three now. The easiest way to do this is to start by drawing three identical diagrams showing the MR, AR and MC curves. Your axis should be labelled as in diagram 1.
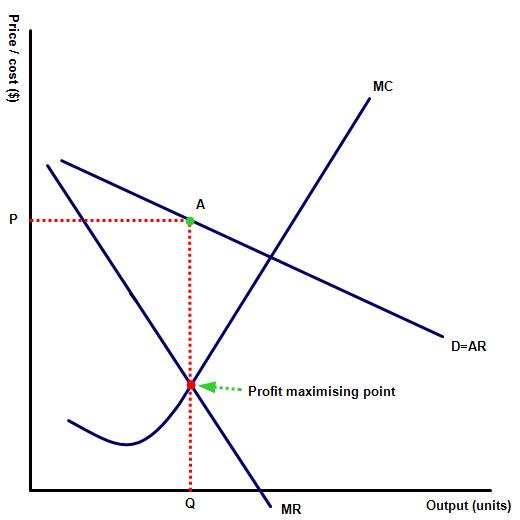
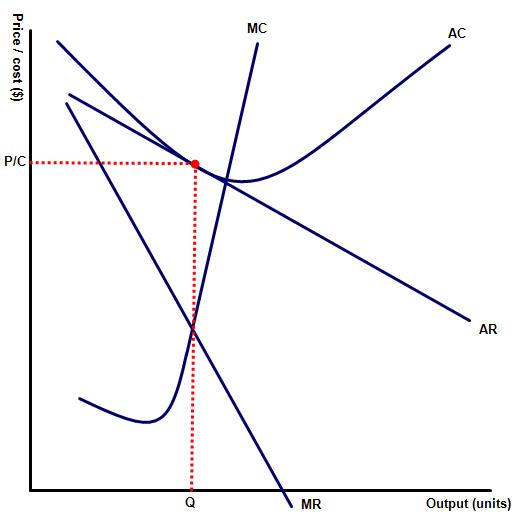
Next draw the profit maximising point where MC = MR and show the selling price. This can be found by drawing a dotted line up from the profit maximising point to point A, which is derived from where your line intersects with the AR curve. Then by drawing a line down from the profit maximising point to the horizontal axis you will derive the output level, represented by point Q on the diagram.
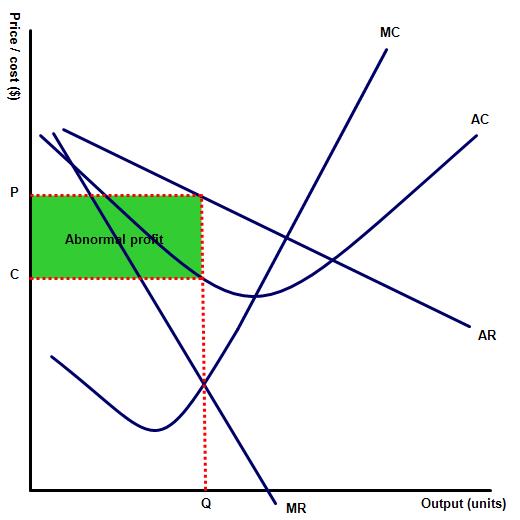
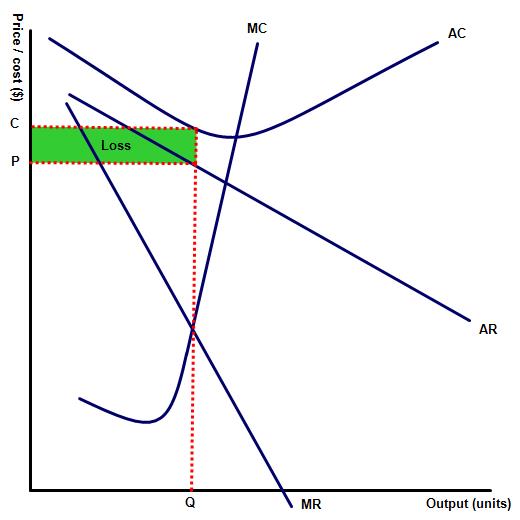
Next you are ready to complete your graphs and to do this simply draw the AC curve. It is this curve which determines whether your firm is making a loss or profit. To draw a firm making normal profit simply position the AC curve so that it touches the AR curve at output Q. To draw a loss making firm position the AC curve above so that at output Q the level of average cost is greater than average revenue. Lastly to illustrate a firm making abnormal profit simply draw the AC curve below the AR curve at output level Q.
Check your completed diagrams with your teacher.
Abnormal profit firm
Loss making firm
Normal profit making firm
Col 2
Activity 5: Link to the assessment
An example of a part (a) paper one question:
Explain why a firm may choose to stay in business despite making only normal profits? [10 marks]
Key terms to define: normal profits, economic profit, accounting profit
The response should note that in economic profit implicit costs or opportunity costs are included in the calculation of total cost. This means that the total economic costs of a business include the opportunity cost of the factor resources used in running it. This would include a salary for the entrepreneur equal to the wage that they could earn elsewhere in alternative employment.
This means that while no entrepreneur should be happy to simply 'break even' the amount earned is at least as high as any alternative use of either their labour or other resources used.
Activity 6: Application of theory
Why do so many start up businesses succeed? Why do some not?
 Twitter
 Facebook
 LinkedIn