 IB Docs (2) Team

Producer and consumer surplus
 Introduction
This is a short section on consumer and producer surplus. A simple way to introduce this topic is to write the name of a popular brand on the white board. This could be a basic food item or popular drink or a consumer durable such as a smart phone. Then select a couple of volunteers and ask them how much they would be willing and able to purchase the good for. Then select a range of prices so that your students can calculate the consumer surplus for themselves. Then do the same thing but ask the volunteers to play the role of producers. Having completed this exercise you are now ready to continue with the lesson by providing your class with the attached class notes.
Enquiry question
Why is the benefit enjoyed by any community optimised where marginal benefit = marginal cost. Why does this represent the best allocation of resources from society’s point of view.
 Lesson notes
Lesson time: 1 hour
Lesson objectives:
Understand the concept of consumer surplus and illustrate this on a demand and supply diagram.
Understand the concept of producer surplus and illustrate this on a demand and supply diagram.
HL only:
Calculate the equilibrium price and equilibrium quantity from linear demand and supply functions.
Plot demand and supply curves from linear functions and identify the equilibrium price and equilibrium quantity.
Calculate the quantity of excess demand or excess supply in the above diagrams.
Teacher notes:
1. Opening activity - start with the beginning activity regarding the utility enjoyed by a refreshing glass of lemonade on a hot sunny day. Then draw this example on the whiteboard for your classes to write in their note books. Then watch the beginning video which illustrates the concepts of producer and consumer surplus. The video complements the handout which you can print off and distribute to your classes. (20 minutes)
2. Processes - technical Vocabulary - your classes can learn the required vocabulary watching the video and studying the class handout which follows.
3. Illustrating on a diagram - activities 2, 3 and 4 of the handout includes some short answer questions, including graphing practise. In total these activities should take 15 minutes.
3. Reinforcement activity - attached to the class handout is a short activity on consumer and producer surplus. A question which comes up with the handout is why D=MB and S=MC and as a consequence why the equilibrium point represents the maximum community surplus. These are HL in type though you may wish to ask your SL students to complete the exercises as well for the practise. (10 minutes)
4. Link to the assessment - this page includes a relevant section A question, which you can project onto the whiteboard for your classes to read and discuss. (10 minutes)
5. Final reflective activity - project the final activity onto the whiteboard, which looks at how consumer and producer surplus is evident in an auction market. (5 minutes)
6. Potential connections to TOK.
Beginning activity
It is a hot sunny day, you are tired and you sit down at a cafe. You ask for the menu which has no prices written on it. How much are you prepared (willing and able) to pay for a glass of lemonade? If the drink costs less than you are prepared to pay then you are lucky - the difference in the two prices represents your level of consumer surplus.
Similarly, as a producer of the good or service, if the product sells for more than you would otherwise be willing and able to supply the good for, the business enjoys a producer surplus.
An explanation for these two terms can be found in the following video:
Key terms:
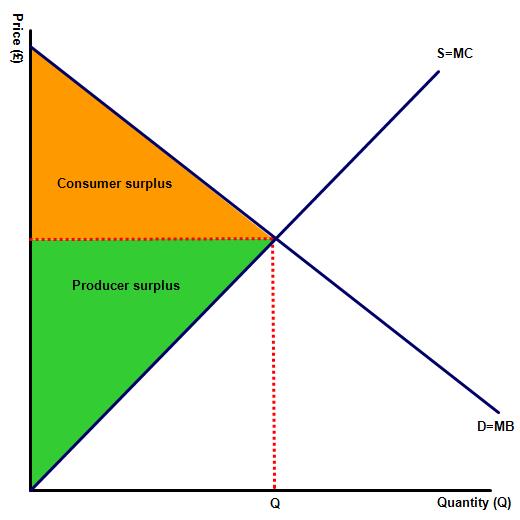
 Consumer surplus: The amount over and and above market price that a consumer is willing and able to purchase a good or service for.
Producer surplus: The amount below the market price that a producer is willing and able to produce a good or service for.
Community surplus: Equal to consumer plus producer surplus.
Marginal cost: The cost to a firm of producing one additional good or service.
Marginal benefit: The additional utility a consumer enjoys from consuming an additional unit of a good or service.
Class activities available as a PDF at: ![]() Surplus
Surplus
Activities
1. Fill in the missing blanks:
In IB economics we recognise the following types of market surplus – _______________, __________________ and ________________ surplus.
consumer, producer, community
2. Draw a diagram illustrating the market for lemonade. Draw the equilibrium price and quantity and illustrate the consumer, producer and community surplus.
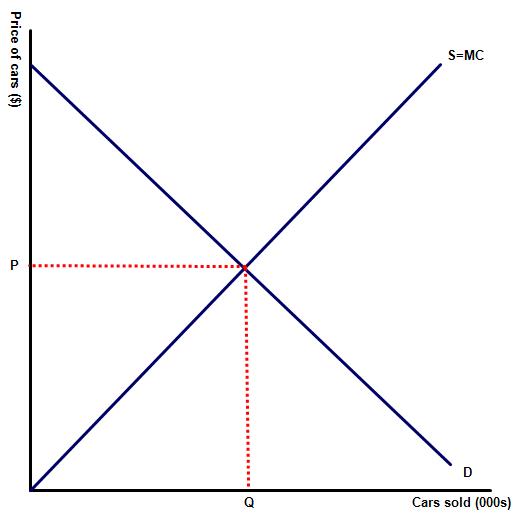
3. Luxury car company Morgan, founded by Henry Stanley Morgan in 1910 is a luxury brand that sells several hundred cars only each year. The price charged by the company is significantly below equilibrium and as a consequence, there is a long waiting list for these cars. Some consumers are willing and able to pay more than the asking price for them.
(a) Draw the initial market situation on a diagram.

(b) Draw the new market for the car if Morgan decided to increase price to the equilibrium.
(c) Indicate what will happen to consumer surplus following the change in price.
Consumer surplus will fall, as the price rises.
(d) Explain what happens to producer surplus when demand for their goods rises?
Ceteris parabus, when demand rises for a good the selling price rises which will increase producer surplus.
(e) A firm is willing and able to sell 1,000 toys at $5 each and consumers are willing to purchase all of these units at $8 each. What is the level of producer surplus?
The producer surplus is $3,000.
4. Practise activities
1 The market for a product is represented by the following table:
| Price £ | Quantity supplied | Quantity demanded |
| 1 | 50 | 350 |
| 2 | 100 | 300 |
| 3 | 150 | 250 |
| 4 | 200 | 200 |
| 5 | 250 | 150 |
| 6 | 300 | 100 |
| 7 | 350 | 50 |
(a) Illustrate the above table on a piece of graph paper, indicating the equilibrium price level and the size of the consumer and producer surplus.
(b) Shade in the consumer and producer surplus.
2 (a) As a result of a rise in supply, the new quantity supply and demand levels are represented by the following table:
| Price £ | Quantity supplied | Quantity demanded |
| 1 | 150 | 350 |
| 2 | 200 | 300 |
| 3 | 250 | 250 |
| 4 | 300 | 200 |
| 5 | 350 | 150 |
| 6 | 400 | 100 |
| 7 | 450 | 50 |
(b) Illustrate the new information from the above table on the graph paper, indicating the equilibrium price level and the size of the consumer and producer surplus.
(c) Shade in the area representing the consumer and producer surplus.
5. Link to assessment
The concepts of consumer and producer surplus can be found in paper one as well as paper three. An example of a part (a) paper one question could be:
(a) Explain the concepts of consumer surplus and producer surplus in the market for train travel. [10 marks]
 Command term: Explain
Explain means to provide reasons and causes - or in other words, explain why producer and consumer surplus happen in the market for train travel?
From the consumers perspective some travellers, for example those using the train to attend an important meeting or get to work on time are likely to have a consumer surplus. For these train travellers their journey is essential and so they maybe willing and able to purchase a ticket for a price significantly above the market price. By contrast the passenger using the train during off peak times is reluctant to pay too high a price for his / her ticket because they have alternative options, including not travelling at all. This group of consumers will have a much smaller consumer surplus or perhaps no surplus at all.
Similarly for the train companies each journey comes with a very high fixed cost but low variable costs. The cost of operating the service for one additional passenger is almost zero. Therefore, the train companies have a producer surplus on every passenger after the firms costs have been covered.
6. Reflection activity: Producer and consumer surplus at auction
Watch the following short video, filmed at the famous Christie's auction house in London. Explain the concepts of consumer and producer surplus when a good is purchased at auction.
Prior to placing a good at auction the seller sets a minimum price for the good that they are willing and able to sell the item for. Any price the seller receives above this price is producer surplus. Similarly the successful buyer decides before entering the auction the maximum price that they are willing and able to purchase the good for. Any price below this then represents their consumer surplus. In most instances therefore both the buyer and the seller will enjoy a surplus.
7. Potential connections to TOK
- To what extent is the demand curve in economics a fictional entity?
- What assumptions underlie the law of demand? Does it actually matter whether these assumptions are actually true or false?
 Twitter
 Facebook
 LinkedIn