 IB Docs (2) Team

Unit 2.3: Competitive market equilibrium
Equilibrium in markets occurs where demand equals supply and the market-clearing price and output are established. The equilibrium price is known as the market-clearing price because at that moment in time all the consumers who are willing and able to buy the product at the equilibrium price can purchase the good and all the producers who are willing and able to sell the product at the equilibrium price can sell it. Changes in the equilibrium price and quantity reflect changes in the allocation of resources in the economy.
.jpg)
- Resource allocation through the price mechanism
- Signalling function of price
- Incentive function of price
- How price rations goods and services in a market
- Consumer Surplus
- Producer surplus
- Social/community surplus maximisation
Revision material
![]() The link to the attached pdf is revision material from Unit 2.3: Competitive market equilibrium. The revision material can be downloaded as a student handout.
The link to the attached pdf is revision material from Unit 2.3: Competitive market equilibrium. The revision material can be downloaded as a student handout.
What is market equilibrium?
Equilibrium in markets occurs where demand equals supply and the market-clearing price and output are established. The equilibrium price is known as the market-clearing price because at that moment in time all the consumers who are willing and able to buy the product at the equilibrium price can purchase it and all the producers who are willing and able to sell the product at the equilibrium price can sell it.
Disequilibrium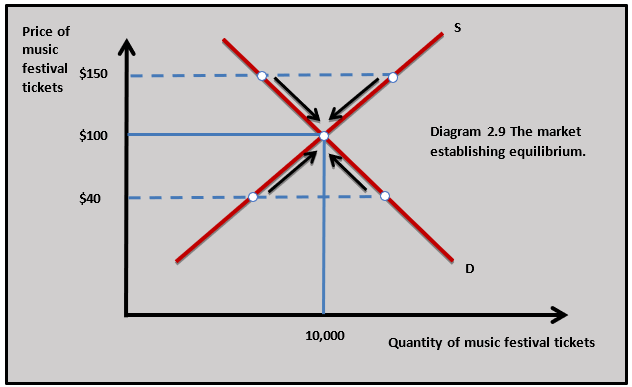
If the price of a good is not at the equilibrium level there is natural market pressure to push it to the equilibrium price. Diagram 2.9 illustrates the market for a music festival. The equilibrium price is $100 and the equilibrium quantity is 10,000 tickets. If the price is above the equilibrium at $150 there will be excess supply and there will be natural pressure for the price to fall to the equilibrium. At a price of $40 which is below the equilibrium, there is excess demand and the price rises to the equilibrium.
The rationing function of price
The central economic problem of scarcity means there is always a limited supply of goods and services to be shared out amongst consumers. Price has a rationing function in this situation because it distributes goods so there are no shortages or surpluses. All the consumers in the market who are willing and able to buy a good at the market price can buy it and all the firms in the market who are willing and able to sell their goods at the market price can sell it. The example of festival tickets in diagram 2.9 illustrates the rationing function of price.
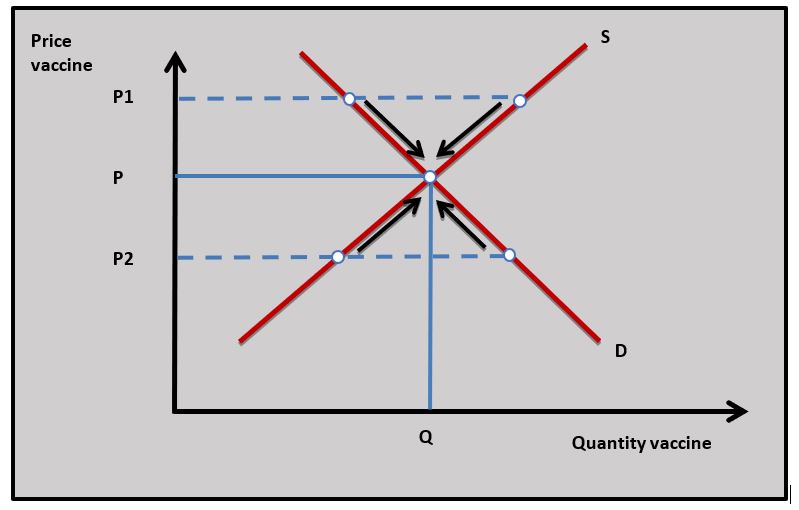
Producing e nough Covid19 vaccine to meet demand is going to be a challenge all over the world. It requires an unprecedented level of coordination between scientists, pharmaceutical companies and governments. Left to itself the market could find a solution. High demand and limited supply would drive up the price of a vaccine to a level where everyone willing and able to pay for the vaccine will get it. The vaccine could be rationed by the price mechanism. But this raises some important issues. The vaccine may well go to wealthy people in rich countries which could leave little available to poorer people in different countries and in economically less developed countries (ELDCs).
For a vaccine to be successful it also needs to reach a certain level of consumption amongst the population and the market mechanism probably will not allow this to happen. On this evidence, the market will fulfil its rationing function in the distribution of a Covid19 vaccine, but the level of consumption is not going to maximise the welfare of a country’s population or indeed the world’s population.
Questions
a. Define the term market equilibrium. [2]
Equilibrium in markets occurs where demand equals supply and the market-clearing price and output are established.
b. Using a diagram, explain the rationing function of price. [4]
 The rationing function of price means that everyone who has effective demand for the good at the equilibrium price can buy the good and any firm that has effective supply can sell the good and there will be no shortages or surpluses. This is shown in the diagram where changes in excess demand and excess supply move price to the equilibrium.
c. Explain the problem of trying to ration the Covid19 vaccine through the price mechanism. [4]
If the market rations the vaccine it may set a price above the level consumers below a certain income can afford. This is because there may be high demand and limited supply in the early phase of the vaccine which would lead to a high price. If not enough people can afford the vaccine then they may get ill with Covid19 and the number of people who need to be vaccinated for the vaccine to be effective will not be achieved.
Investigation
Discuss with your class what governments around the world have tried to do to meet the supply challenges of the Covid19 vaccine.
Changes in equilibrium
The equilibrium price and quantity in a market will change if there is a change in either demand or supply.
Change in demand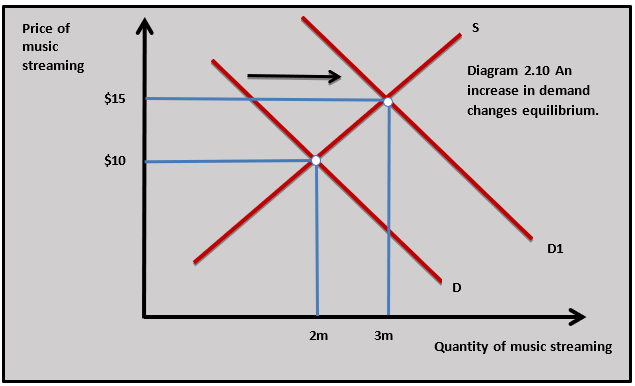
A change in a non-price demand factor that shifts the demand curve will lead to a change in the market equilibrium price and quantity. The rise in the popularity of music streaming services because of taste and fashion has increased the demand for music streaming services. This leads to an increase in the equilibrium price from $10 to $15 and an increase in the quantity of music streaming from 2 million to 3 million units. This is shown in diagram 2.10.
Change in supply
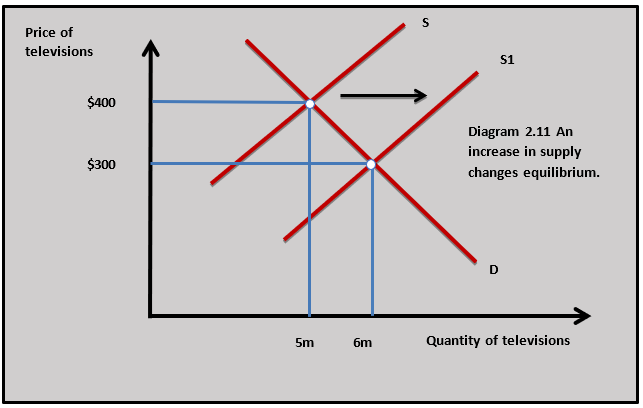 In the same way as a change in non-price factors changes demand, a change in a non-price supply factor will shift the supply curve and lead to a change in the equilibrium price and quantity. An improvement in technology in the television market has led to an increase in the supply of televisions in diagram 2.11. This results in a fall in the price from $400 to $300 and an increase in the quantity of televisions traded from 5 million to 6 million units.
Functions of the price mechanism
The allocation of resources
Resource allocation is the distribution of the factors of production to different markets in the economy. In free markets, the price mechanism guides resources to different markets through what Adam Smith called ‘the invisible hand’. In this theory, price is seen to have two functions in allocating resources, the signalling and incentive functions of price.
The signalling function of price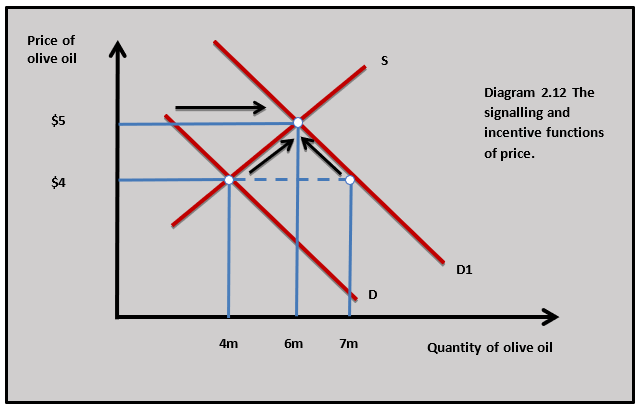
When a price changes in a market, it sends information (a signal) to producers and consumers that market conditions are changing, and the price change provides them with information to make decisions on how they might act in response to the price change. Diagram 2.12 shows the market for olive oil. If there is an increase in demand for olive oil, there will be excess demand at the existing market price of $4 per litre. For the market to clear the market price needs to rise.
The rise in price is a signal to consumers and producers in the olive oil market that market conditions are changing and provides them with information to make buying and selling decisions.
The incentive function of price
Once a price change has sent a signal to consumers and producers, they react to the price change based on the incentive to try and maximise their profits, in the case of producers and utility in the case of consumers. As the price of olive oil rises in diagram 2.12 producers have the incentive to increase the quantity they supply because the higher price means they can earn more profit from increasing the quantity supplied to the olive oil market. The quantity demanded of olive oil falls as the price increase means consumers receive less utility for each $ they spend on olive oil. When quantity demanded equals quantity supplied the market reaches an equilibrium price of $5 with 6 million litres traded.
Opportunity cost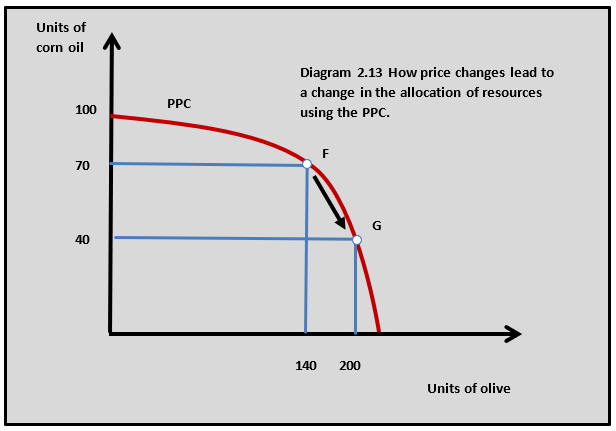
As the quantity supplied of olive oil increases more resources are attracted to the olive oil market. This is shown by a movement along the PPC in diagram 2.13. As more resources are allocated to the olive oil market output rises from 140 units to 200 units. This results in an opportunity cost of 30 units of corn oil as fewer resources are allocated to the corn oil market and output falls from 70 units to 40 units.
 The second-hand market for concert tickets is very much part of the live music market with many businesses entering the market since the internet has evolved. Companies such as StubHub and Viagogo offer tickets for virtually every music event. The system works by matching people who have tickets to sell for an event with people who want to buy tickets but were unable to get tickets because the event has sold out.
If, for example, you want to see the female vocalist, Adele and the official tickets have sold out then you can go to an online seller like Viagogo and buy tickets. They may, however, be much more expensive than the official price of $89. Viagogo may well be selling tickets for Adele at $400. The price of Adele tickets in the second-hand market may rise when demand for them increases because there will be a shortage in the online market. The rising price gives information to buyers and sellers (signalling function) about the strength of demand for the tickets and the higher the price attracts more people to offer tickets for sale (incentive function) in the market. This type of buyer and seller behaviour illustrates the influence of the signalling and incentive functions of price in a market.
 Worksheet questions
Question
Using the signalling and incentive functions of price explain how the allocation of resources changes when the demand for a good increases. [10]
Answers might include:
 Definitions of signalling and incentive functions of price, resources and demand.
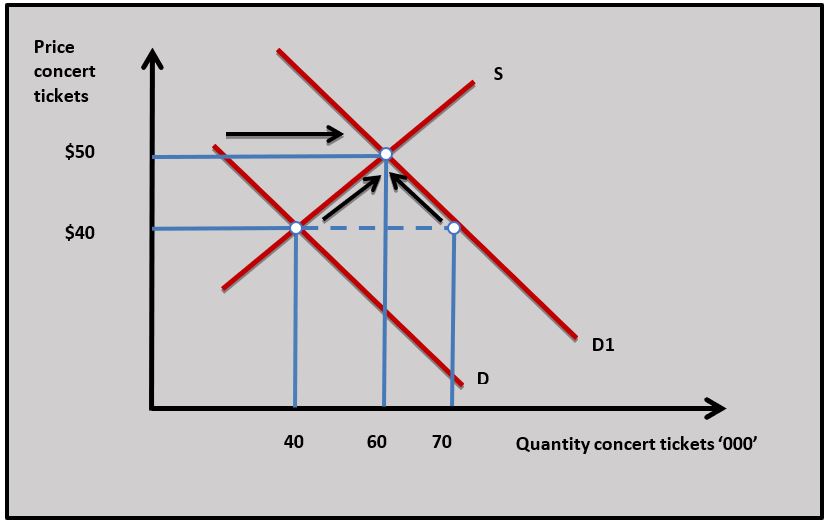
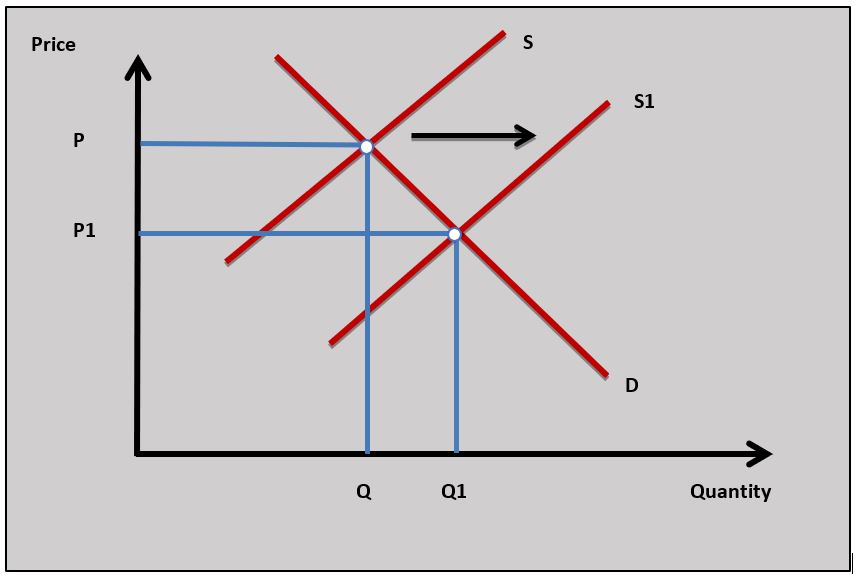
- A diagram to show the reallocation of resources when demand increases. This is shown in the diagram when demand increases from D to D1.
- An explanation that an increase in demand for a good causes excess demand at the original price. For the market to clear price has to increase and this sends a signal to producers and consumers about changing market conditions.
- The rise in price also provides an incentive for producers to increase quantity supplied and for consumers to reduce quantity demanded until a new equilibrium is set in the market.
- The change in price means more resources will be allocated to the market. In this case the concert ticket market.
- An example to support the explanation of the signalling and incentive functions of price such as the concert market in this case.
Investigation
Research into the market for sports, music or event tickets where the secondary market ticket price is significantly above the original selling price.
Market efficiency
Allocative efficiency
Market allocative efficiency occurs when the quantity of resources allocated to a market maximises the community or social surplus in that market. This means resources are allocated so that the consumer and producer surplus are both maximised. This occurs when demand equals supply in a market.
Consumer surplus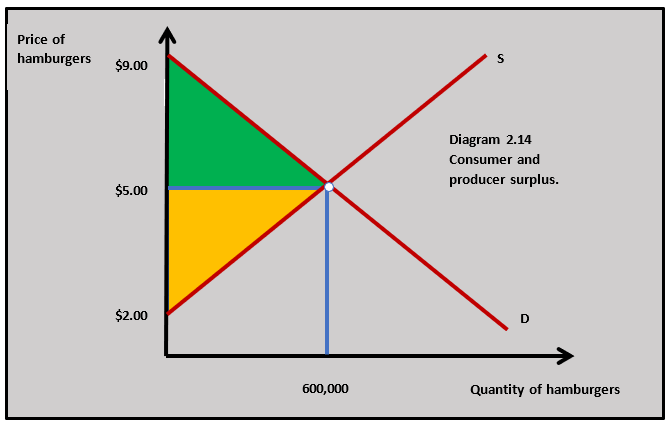
The consumer surplus is the difference between the price the consumer is willing to pay for a good and the market price of that good. The demand curve expresses the price the consumer is willing to pay for the product. For example, the market price for hamburgers is $5 and this is shown in diagram 2.14.
The demand curve shows that some consumers are willing to pay more than the market price of $5. Some consumers, for example, may be willing to pay $6 for a hamburger but they only need to pay the market price of $5, which is a consumer surplus of ($6 - $5) $1.
The consumer surplus is shown by the green shaded area in diagram 2.14. The consumer surplus is an important concept and it has many applications in economic analysis. The consumer surplus can be calculated by working out the size of the green shaded area in diagram 2.14. In this example, the calculation is:
($9.00 – $5.00 x 600,000) / 2 = $1,200,000
Producer surplus
 The producer surplus is the difference between the price the producer is willing to sell their good for and the market price of the good. The price the producer is willing to sell for is expressed by the supply curve which is based on the cost of producing the good. The producer could sell for less than the equilibrium price, but it would not be rational to do this because the producer can make a higher profit by selling at the market price. A producer in our hamburger example might be willing to sell a hamburger for $2 which is a producer surplus of ($5 - $2) $3. The producer surplus is shown by the yellow shaded area in diagram 2.14.
The producer surplus can be calculated by working out the size of the yellow shaded area in diagram 2.14. In this example, the calculation is:
($5.00 – $2.00 x 600,000) / 2 = $900,000
Social (Community) surplus
Welfare is maximised in society when the social or community surplus in a market is maximised. This is where the benefit to society of the production and consumption of a good is equal to its cost. The social surplus is the sum of the consumer surplus and producer surplus in a market. In diagram 2.14 this is the total area represented by the green and yellow triangles. In this example, the calculation is:
($9.00 - $2.00 x 600,000) / 2 = $2,100,000
The market equilibrium price for an airline flight from Ne w York to Abu Dhabi is around $700. If you do a Google search you will find carriers such as Virgin, British Airways and Etihad all charge around this price for an economy ticket for this 13-hour return trip. The airlines, however, know some consumers are willing to pay a much higher price than $700.
Business travellers, for example, who need to travel for work and whose business is paying are probably willing to pay much more than $700. The business traveller paying $700 for a ticket may well be willing to pay $1500 and therefore have a consumer surplus of $800 ($1500 - $700). The airlines understand this and have developed ways of capturing this surplus. If you make the airline seat bigger, offer high-quality onboard food and drink throughout the trip and give the passenger a luxury lounge to relax in before their flight you can charge a much higher price and capture some consumer surplus. The Etihad business class ticket New York to Abu Dhabi is $2900.
Questions
a. Explain the difference between the consumer and producer surplus. [4]
The consumer surplus is the difference between the price the consumer is willing to pay for a good and the market price of that good. The producer surplus is the difference between the price the producer is willing to sell their good for and the market price of the good.
b. Explain how airlines charging different prices for different tickets allows them to capture consumer surplus. [4]
Some consumers are willing to pay a higher price for an airline ticket than the market price. For example, the market price for a ticket might be $700 and some consumers might be willing to pay $1000. This is a $300 consumer surplus. By creating a business class ticket, the airline can capture the consumer surplus of business travellers who are willing to pay more because they need to travel for work. The business class ticket the airline sells needs to be a higher quality product than the economy ticket to attract the business traveller to pay a higher price.
Investigation
Research into the airline industry to see how important different classes of travel are for airline businesses trying to gain consumer surplus and earn higher profits.
When there is disequilibrium in a market and prices fall, which of the following is the most likely reason for the disequilibrium?
When quantity supplied is greater than quantity demanded price falls in a market.
The market for a normal good is in equilibrium and demand for the good increases. Which of the following outcomes is most likely?
When demand increases with a given upward-sloping supply curve both price and quantity increase.
Which of the following is most likely to cause the equilibrium price in the market for good A in the diagram to fall?
If the cost of components falls, then supply increases and the equilibrium price in the market for good A falls.
Which of the following best describes the incentive function of price?
The incentive function of price for the producer is how a rise in price creates a greater incentive for them to increase output.
In market X, which one of the following statements is not true?
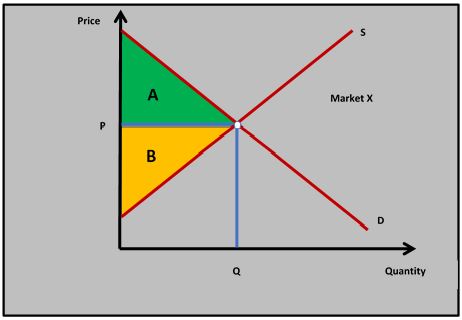
Area A + B is the social/community surplus.
Which of the following would be shown on a demand and supply diagram for good X if the market for good X was initially in equilibrium and the demand for good X increased?
There would be excess demand for good X at the initial equilibrium until the price of good X had increased and allowed the market to clear.
The data in the table is for the market for pineapples.
Price per unit $ | Quantity demanded (millions) | Quantity supplied (millions) |
1.50 | 5 | 9.5 |
1.40 | 6 | 9 |
1.30 | 7 | 8.5 |
1.20 | 8 | 8 |
1.10 | 9 | 7.5 |
1.00 | 10 | 7 |
Which of the following is the equilibrium price?
At
A market is in equilibrium when:
Which of the following statements about the price mechanism is least likely to be true?
Governments can influence the market price and quantity through policies such as indirect tax and subsidies.
If the price of a complement for a mobile phone increases which of the following is the most likely effect on the equilibrium price and quantity in the mobile phone market?
An increase in the price of a complement for mobile phones increases then the demand for mobile phones will fall which decreases market price and quantity.
 Twitter
 Facebook
 LinkedIn