 IB Docs (2) Team

Unit 2.8(1): Market failure – externalities
.jpg)
Markets fail when the free market forces of demand and supply lead to an allocation of resources that does not maximise the welfare of a country’s citizens. It means that the marginal social costs that result from the production and consumption of a good do not equal the marginal social benefits. Economists often express market failure as a misallocation of resources or where resources have been allocated inefficiently.
 Explanation of market failure
- Allocative efficiency when the social/community surplus is maximised
- Social efficiency: marginal social cost (MSC) equals marginal social benefit (MSB)
- External costs / negative externalities of production and consumption
- External benefits / positive externalities of production and consumption
- Understanding of and calculation (HL) of welfare loss.
Can you think of how the market might fail in each of the four pictures?
Revision material
![]() The link to the attached pdf is revision material from Unit 2.8(1): Market Failure – Externalities. The revision material can be downloaded as a student handout.
The link to the attached pdf is revision material from Unit 2.8(1): Market Failure – Externalities. The revision material can be downloaded as a student handout.
What is market failure?
Markets fail when the free market forces of demand and supply lead to an allocation of resources that does not maximise the welfare of a country’s citizens. It means that the marginal social costs that result from the production and consumption of a good do not equal the marginal social benefits. The concepts of social costs and benefits are covered later in this chapter.
Economists often express market failure as a misallocation of resources or where resources have been allocated inefficiently. In the market theory we looked at in chapter 2.3, market failure occurs when the community/social surplus (consumer surplus plus producer surplus) is not maximised.
A round 10 million people live in one of China’s most polluted cities – Baoding. One resident claimed: ‘generally, there is smog on most days and we rarely see blue skies now.’ On bad days the visibility for driving is reduced and headlights and traffic lights are barely visible. There is also a metallic taste in the air. The poor air quality accounts for very high levels of respiratory illnesses in the city, along with thousands of deaths. Baoding is in China’s Hebei province where the air is ‘fed’ by the chimney stacks of coal and steel plants.
 Worksheet questions
Questions
a. Explain two benefits to the Chinese economy of the production of coal. [4]
Coal production will bring the following benefits to the Chinese economy:
- It provides heat and light for Chinese households and businesses.
- It creates employment for Chinese workers.
b. Explain what you understand by the term market failure. [4]
Markets fail when the free market forces of demand and supply lead to an allocation of resources that does not maximise the welfare of a country’s citizens. It means that the marginal social costs that result from the production and consumption of a good do not equal the marginal social benefits.
Investigation
Discuss with your class why the market might have failed in this case?
Allocative efficiency
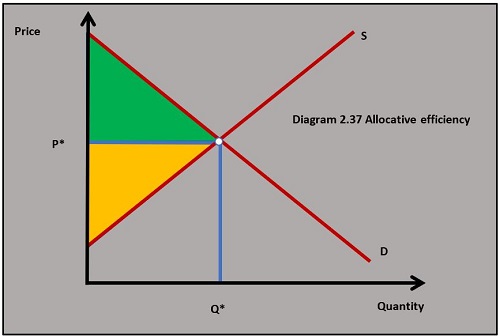 Allocative efficiency is achieved in a market when the marginal benefit of consuming a good is equal to the marginal cost of producing it. This situation exists when demand equals supply, assuming there are no externalities in the market. External costs and benefits are explained in the next sections of this chapter.
When demand equals supply in a market it is in equilibrium and the social/community surplus is maximised. This means the consumer and producer surpluses are maximised.
If all markets in the economy achieve maximum social/community surplus the welfare of a country’s citizens will be maximised. Diagram 2.37 show the maximisation of the consumer surplus (green area) and producer surplus (yellow area) at the equilibrium price. This is allocative efficiency because the social/community surplus is maximised.
Externalities
Externalities are any impact that the production or consumption of a good or service has on a third party. A third party is someone other than the producers and consumers of a good or service in a market. Third parties are often stakeholders in a community who can be positively or negatively affected by the activity in a market.
For example,  the Glastonbury music festival brings benefits to the third parties (local residents and businesses) of this small town in Devon, England such as local tax income for better public services, and visitors who shop in the town’s retailers and improvements to the local road infrastructure. But it comes with costs to third parties as well. When the festival takes place there will be road congestion, increased amounts of litter and noise pollution.
Economists divide externalities into:
- External costs or negative externalities
- External benefits or positive externalities
External costs or negative externalities
External costs are the spillover costs that negatively impact third parties which result from the production or consumption of a good or service. They can be divided into two types: production external costs and consumption external costs.
Production external costs (negative externalities)
Production external costs come from the production of a good or service. A chicken farm, for example, emits a very strong smell, which adversely affects residents who live within a mile of the farm, as well as people who travel past the farm.
Marginal private costs
When the eggs are produced the costs of resources used in their production determines the supply decision of the egg producer. These are the raw materials, labour and capital used by the egg farm. These are the private costs of production. Each extra unit produced by the farm is the marginal private cost.
Marginal social costs
The external costs (negative effects) on the local residents of the strong smell of producing the eggs are not included in the private costs of production. The social cost of producing the eggs is:
marginal private cost (MPC) + external cost = marginal social cost (MSC)
Production external costs and market failure
We can use marginal cost and benefit analysis to examine how external production costs lead to market failure. Diagram 2.38 is used to illustrate this marginal analysis.
If we assume the only externalities in a market are production external costs (there are no other production or consumption externalities) then demand or marginal private benefits from the consumption of the good equals its marginal social benefits.
 The market output is determined by demand and supply or where marginal private benefits equal marginal private costs. In the egg market example, this is set where the demand for eggs (MPB) equals the supply of eggs (MPC) at output Q and price P in diagram 2.38.
Market output: MPB = MPC = output Q
The socially efficient output is set where marginal social benefits equal marginal social costs at Q*, which is below the market output at Q. This is shown in diagram 2.38.
Welfare loss
A welfare loss to society occurs in a market when the output of a good or service means the social cost of production is greater than the social benefit of production. The yellow shaded area in diagram 2.38 shows the total welfare loss in the egg market example. At each level of output beyond Q* in diagram 2.38, MSC is greater than MSB, which means that the cost to society of each extra unit of eggs produced is greater than the benefit.
Calculating the welfare loss (HL)
A market’s welfare loss can be calculated by working out the area of the yellow welfare loss triangle in diagram 2.38. In this case, the data from the egg farm example is:
- Q*: 300,000 units
- Q: 500,000 units
- MSB at Q: $2.00
- MSC at Q: $3.00
Calculation:
(Q - Q*) x (MSC – MSB) / 2 = welfare loss
(500,000 – 300,000) x ($3.00 - $2.00) / 2 = $100,000

In 1993 an American paralegal called Erin Brockovich built a case against the Pacific Gas and Electric Company (PG&E). The company had been using a substance called hexavalent chromium in one of its cooling towers to prevent corrosion. The contaminated water from the plant made its way into the groundwater near the town of Hinkley, California. The contaminated water caused very significant health problems for many of Hinkley's residents. The case was settled in favour of the residents in 1996 for US$333 million, the largest settlement ever paid in a direct-action lawsuit in US history.
The case was made into a film called ‘Erin Brockovich’, starring Julia Roberts in the title role. It was nominated for five Academy Awards. The PG&E example is one of many high-profile examples of production negative externalities.
Worksheet questions
Questions
a. Define the term negative production externality. [2]
Negative production externalities are the spillover costs that negatively impact third parties which result from the production of a good or service.
b. Explain the negative externalities of the production by the Pacific Gas and Electric Company (PG&E). [4]
When Pacific Gas and Electric Company (PG&E) used hexavalent chromium to prevent corrosion at its Hinkley plant it leaked into the groundwater near the town of Hinkley, California and this caused serious health problems to the local residents. The health problems for Hinkley’s residents caused by the PG&E plant are a negative production externality.
c. Using a diagram, explain how negative production externalities lead to market failure in the energy market. [4]
 The negative production externalities, in this case, are the health consequences for local residents in Hinkley caused by toxic water from the power plant. When the negative externalities associated with energy production are added to the private cost it means that the MSC curve is above the MPC curve and this means the socially efficient output of energy Q* is below the market output of Q. There is an over-allocation of resources in the energy market. The yellow triangle represents the welfare loss associated with energy provision.
Investigation
Watch some clips from the film Erin Brockovich and discuss with your class the market failure issues involved in the film.
Investigate any other films based on a similar theme of negative externalities of production.
Consumption external costs
Consumption external costs exist when third parties experience the external cost from the consumption of a good or service. For example, when people smoke cigarettes, the smell and smoke from the cigarettes adversely affect other people who are not smoking. The rate of illness caused by cigarette smoking is also very high, which means that smokers take up more resources in a state-run health service than non-smokers do.
 The negative effects of consumption external costs, in this case smoking cigarettes, are not included in the demand curve or marginal private benefits of cigarette consumption, which means that the marginal social benefits of smoking are lower than the marginal private benefits. The marginal social benefits of consuming cigarettes lie to the left of the marginal private benefit or demand curve. This is shown in diagram 2.39. Marginal private benefit + external cost = marginal social benefit
Consumption external costs and market failure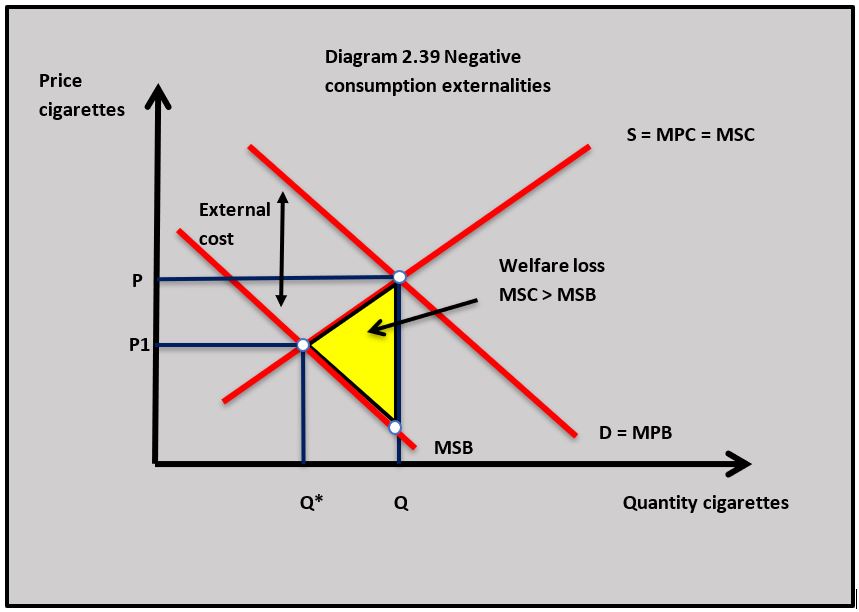
If we assume there are no externalities when producing cigarettes, then supply equals the marginal social cost of producing cigarettes. As a result, the output of the cigarette market is set where the demand for cigarettes equals the supply of cigarettes at price P and output Q.
The socially efficient level of output for cigarettes is where marginal social benefits equal marginal social costs at output Q*. This is shown in diagram 2.39.
In this case, the cigarette market is producing at output Q which is above the socially efficient level at Q*. This is a market failure because there is an over-allocation of resources in the cigarette market.
Welfare loss
The yellow shaded area in diagram 2.39 represents the welfare loss to society from the over-allocation of resources in this example. At each level of output beyond Q* in diagram 2.39, MSC is greater than MSB which means that the cost to society of each extra unit of cigarettes consumed is greater than the benefit.
Calculating the welfare loss (HL)
A market’s welfare loss can be calculated by working out the area of the yellow welfare loss triangle in diagram 2.39. In this case, the data from the cigarette example is:
- Q*: 3.6 million
- Q: 4.8 million
- MSB at Q: $9.00
- MSC at Q: $15.00
Calculation:
(Q - Q*) x (MSC – MSB) / 2 = welfare loss
(4.8m – 3.6m) x ($15.00 - $9.00) / 2 = $3.6 million
.jpg)
In 2018 39,773 people died from gun-related injuries in the US. A mixture of fatalities from suicide, violent crime and accidents. In the same year, 56 people died of gun-related injuries in the UK. Even when you allow for the fact the US has a population that is about 5 times that of the UK, the difference in gun-related deaths is very significant.
Consider the gun-ownership table opposite and bear in mind the rate of UK gun ownership is 5.1 per 100 residents.
Worksheet questions
Questions
a. Explain why gun ownership leads to negative externalities. [4]
The negative externalities associated with gun ownership include gun-related violent crime and accidents.
b. Explain why external costs of consumption can lead to market failure. [10]
Answers should include:
- Definitions of external costs and market failure.
- A diagram to show the external costs of consumption leading to market failure because there is an over-allocation of resources. This is shown in the diagram attached where the socially efficient output (MSB = MSC) at Q* is below the market output Q which leads to an over-allocation of resources.
- A real-world example of external costs of consumption or negative externalities in the firearms market in the US.
- An explanation that the negative externalities associated with gun ownership occur because of the spillover costs on third parties where people are the victims of gun crime and accidents. This means the MSB curve is below the demand curve and there is an over-allocation of resources at the market output of Q in the diagram. This means the market is not producing at the socially efficient output where MSC = MSB and there is a welfare loss shown by the yellow triangle.
Investigation
Discuss with your class how significant the negative externalities associated with gun ownership in the US are?
External benefits or positive externalities
External benefits are the spillover benefits that positively impact third parties as a result of the consumption or production of a good or service. They can be divided into two types: production external benefits and consumption external benefits.
Production external benefits
Production external benefits occur as a result of the production of a good or service. For example, if a major new car factory opens in a town.
Marginal private benefits
If a new car factory opens in a town it may employ local workers in the factory, use local businesses that provide services, and purchase raw materials and components from local producers. These are private benefits because they benefit the stakeholders directly associated with the location and operation of the car factory.
External benefits
The new car factory may also bring external benefits when it is set up in the town. For example, the workers from the car factory spend their income by using services in the town such as shops and restaurants. The car factory may also set up training schemes for local workers which is a private benefit to those workers, but an external benefit when those skilled workers become available to other businesses in the area. The car factory could also improve local infrastructure when new roads are built and broadband speeds are increased. These developments will also benefit the community in the town
Production external benefits and market failure
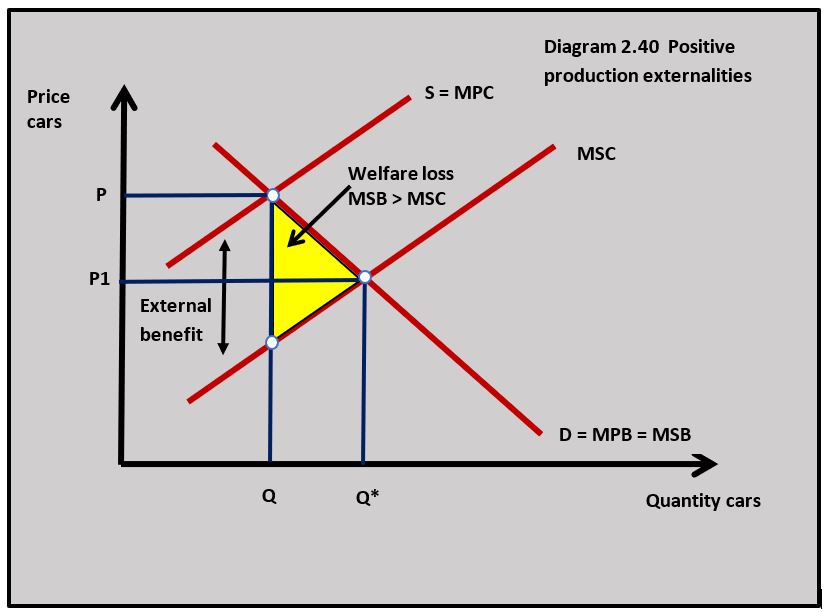 The external benefits are not included in the supply curve (private cost) for the car factory, but when the external benefit is added to the supply curve, the marginal social cost curve exists to the right of the supply curve. This is shown in diagram 2.40. We assume that there are no other external costs and benefits when consuming the cars.
In the car factory example, the market output exists where demand equals the supply of cars at price P and output Q in diagram 2.40. The socially efficient output where marginal social cost equals marginal social benefit at output Q* in diagram 2.40. The market has failed because the socially efficient output Q* is above the market output Q. There is an under-allocation of resources in the market.
Welfare loss
The yellow shaded area in diagram 2.40 is the welfare loss to society because of the under-allocation of resources. The marginal social benefit from the car factory is greater than the marginal social cost at each level of output from Q to Q*. For extra units produced from Q to Q*, the benefit to society is greater than the cost. By only producing at Q society is missing out on the welfare more resources being allocated to the market would bring.
Calculating the welfare loss (HL only)
The car factory's welfare loss can be calculated by working out the area of the yellow welfare loss triangle in diagram 2.40. In this case, the data from the car factory example is:
- Q: 50,000 units
- Q*: 75,000 units
- MSC at Q: $9,000
- MSB at Q: $12,000
Calculation:
(Q* - Q) x (MSB – MSC) / 2 = welfare loss
(75,000 - 50,000) x ($12,000 - $9,000) / 2 = $37.5 million
Inquiry case example 
The Hong Kong–Zhuhai–Macau Bridge
On 24 October 2018, the Hong Kong–Zhuhai–Macau Bridge was opened. It is a 55km (34 miles) bridge that included an undersea tunnel and four artificial islands. It is the longest sea-crossing by a bridge in the world. The project cost $18.8 billion.
The improved connectivity brought about by the bridge will bring significant social benefits to Hong Kong and Macau. Sectors such as tourism, finance and logistics will see huge advantages from the bridge.
Questions
a. Outline two private benefits that might arise from the Macau bridge. [4]
Private benefits would be gained by any two of the following stakeholders:
- Car drivers who can travel more quickly between Hong Kong and Macau
- Workers who are employed on the bridge
- The profits earned by the construction firms that built the bridge
- Construction workers who were paid to build the bridge.
a. Explain how positive externalities resulting from the Macau bridge might affect the tourism sector in Macau. [4]
The positive externalities that arise from the Macau bridge are the spillover benefits that affect third parties. In this case, it would be the tourism sector in Macau. If it is quicker and easier for visitors to travel to Macau from Hong Kong then this could increase the number of tourists. This would be good for businesses in Macau like hotels, restaurants, bars and leisure facilities who will achieve higher sales and profits.
c. Explain why positive externalities are considered to be a market failure. [10]
Answers might include:
- Definition of positive externalities and market failure.
- A diagram to show how the external benefits from the construction of the Macau bridge mean that the MSC curve is below the MPC curve which means the socially efficient level of output where MSB equals MSC at Q* is below the market output of Q.
- An explanation of how the Macau bridge will lead to external benefits such as higher levels of tourism in Macau along with improved levels of business efficiency as workers and freight can be moved more quickly between Macau and Hong Kong.
- An explanation of that the external benefits associated with the Macau bridge will mean that in a free market situation the bridge may not have been built and the socially efficient level of output would not be achieved and this would lead to a market failure. The welfare loss associated with the Macau bridge is shown by the yellow shaded area in the diagram.
Investigation
Research another infrastructure project that might have similar private and external benefits.
Consumption external benefits
Consumption external benefits occur when a good or service is consumed and there are spill-over benefits on third parties. For example, we often see external benefits in the market for healthcare goods and services when there are benefits to people beyond those who consume healthcare goods.
Marginal private benefits
For example, when people purchase a flu vaccination they benefit because they are less likely to catch the flu. This is a private benefit to these consumers, and each extra unit of the vaccination consumed is a marginal private benefit.
Marginal social benefit
Other people (third parties) in society also benefit because with fewer flu carriers, there are fewer people to catch the flu from. The people who are less likely to catch the flu because of other people’s vaccinations represent an external benefit from the consumption of the flu vaccine.
Consumption external benefits and market failure
 The demand curve represents the private benefits from the flu vaccine. When we add the external benefits, we get the marginal social benefit curve. If we assume that there are no other externalities associated with the production of the flu vaccine, then the supply of the marginal private cost curve equals the marginal social cost curve.
Diagram 2.41 illustrates the market for the flu vaccine. The market output is at the point where demand equals supply or marginal private benefit equals marginal private cost at output Q. The socially efficient level of output is where marginal social cost equals marginal social benefit at Q*. This means that the market output Q is below the socially efficient output at Q* and there is an under-allocation of resources.
Welfare loss
The yellow shaded triangle in diagram 2.41 represents the welfare loss to society from the flu vaccination. The marginal social benefit from the consumption of the vaccine is greater than the marginal social cost at each level of output from Q to Q*. This means from each extra unit of vaccine consumed between Q and Q*, the benefit to society is greater than its cost. By only producing at Q, society is missing out on the welfare from more resources being allocated to the market.
The vaccine's welfare loss can be calculated by working out the area of the yellow welfare loss triangle in diagram 2.41. In this case, the data from the vaccine example is:
- Q: 1.5 million units
- Q*: 5.6 million units
- MSB at Q: $8.00
- MSC at Q: $2.50
Calculation:
(Q* - Q) x (MSB – MSC) / 2 = welfare loss
(5.6m - 1.5m) x ($8.00 - $2.50) / 2 = $11.275m

A vaccine for COVID-19 could be ready as soon as September, according to a professor from Oxford University. Sarah Gilbert is a professor of vaccinology and says that she is "80% confident" a COVID-19 vaccine being developed by her team will work. Professor Gilbert has said that human trials are set to take place within the next fortnight and that she has been working seven days a week to get a vaccine rushed through.
The development of a vaccine is seen as crucial in the global fight against COVID19. Not only will the vaccine benefit those who will take it but for the wider population as well. The World Health Organisation has estimated that for each person who contracts the virus they will pass it on to 3 others. Sarah Gilbert’s team at Oxford is part of a global effort to find a vaccine for coronavirus, which has killed hundreds of thousands of people around the world, according to Johns Hopkins University.
Worksheet questions
Question
Explain why the Covid19 vaccine is an example of market failure. [10]
Answers should include:
- Definitions of market failure and positive consumption externalities.
- A diagram to show how the external benefits from the consumption of the vaccine mean that the MSB curve is above the MPB curve which means the socially efficient level where MSB equals MSC at Q* is below the market output of Q. The welfare loss associated with the vaccine is shown by the yellow shaded area in the diagram.
- An explanation that the positive externalities from the Covid19 vaccine result from the lower infection rates from vaccinated people who do not pass the virus onto others which reduces overall levels of covid. The positive externalities from the vaccine mean MSB is above MPB. This means there is an under-allocation of resources in a free market for the Covid19 vaccine where output is at the point where MPB equals MPC which is below the socially efficient output where MSC equals MSB. Because the MSB does not equal MSC the market fails and society's welfare is not maximised.
Investigation
Investigate the external benefits of a vaccine against another disease.
Which of the following statements best describes market failure?
Which of the following statements is not true about negative externalities?
Negative externalities cause an over-allocation of resources.
Which of the following goods or services is the most likely to lead to negative externalities of consumption?
Mobile phones have consumption and production negative externalities associated with them.
In the diagram, which of the following is not true?
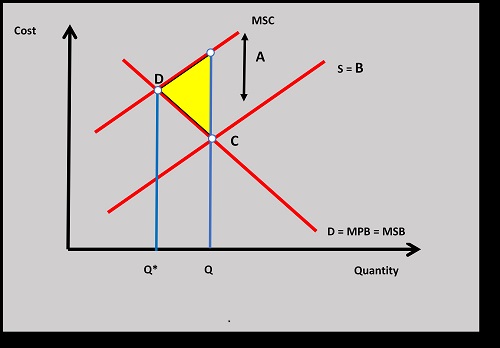
The market is in equilibrium (D = S) at point C, so the consumer and producer surpluses are maximised.
What is the best description of the welfare loss associated with a negative externality? It is the:
The welfare loss of a negative externality occurs when MSC > MSB.
Which of the following goods and services is the least likely to be associated with significant consumption positive externalities?
Cinemas may be associated with some positive externalities but they will not be as significant as the other options.
Which of the following is untrue in the diagram?
.jpg)
There is an overallocation of resources in a free market because the socially efficient output where MSB=MSC is at Q* which is below the market output at Q.
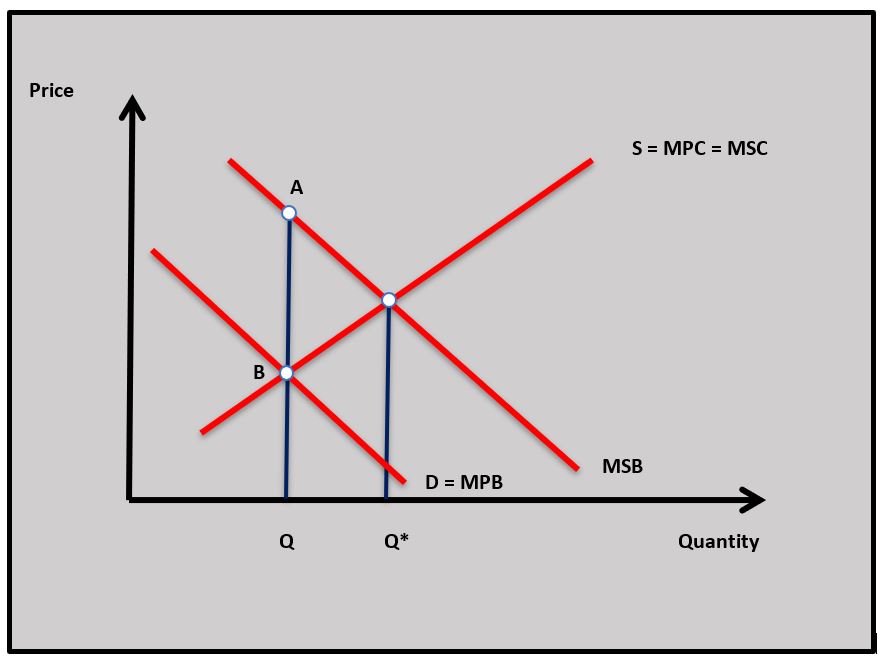
The difference A and B at output Q is where MSB is greater than MPB and this is the external benefit.
The external benefits of healthcare affect third party individuals outside those people who directly benefit from the healthcare they consume. This means the:
When there are external benefits of consumption it means social benefits are greater than private benefits.
The data shows the forecasted costs and benefits of building a new bridge:
- Private costs
$ 150m - External costs
$ 40m - Private benefits
$ 130m - External benefit
$ 20m
From the data, it can be concluded that:
Social costs (
 Twitter
 Facebook
 LinkedIn