 IB Docs (2) Team

Factors of production
Introduction
 This lesson introduces the economic factors of production. Your students will already be aware of the notion that a nation possesses certain factors or resources which they use to produce goods and services. They will probably just not know the term factors of production. Deliver this lesson in terms of the factors of production consisting of those things that businesses need to operate. At an advanced level students should make the link between the quality of the factors of production available to a nation and the quality and number of goods and services that a country can produce. Explain that simply put, the wealthiest nations have access to greater production factors in the economy. Some of these factors of production such as land are relatively fixed where as capital and labour can be improved through government action.
Enquiry question
How do economists use production possibilities curves (production possibilities frontiers) to illustrate the concepts of scarcity, choice, opportunity cost.
 Teacher notes
Lesson time: 80 minutes
Lesson objectives:
To develop an understanding of the concept of factors of production and an explanation of how PPF diagrams can be used to illustrate the concepts of
scarcity, choice and opportunity cost.
Teaching notes:
1a. Opening activity - begin the lesson with the introductory exercise, which asks students to consider what factors of production are employed in the production of a good or service that you will provide. (15 minutes)
Watch the short video and then answer the questions that follow (20 minutes).
.jpeg "https:www.pexels.com") 2. Processes - technical vocabulary - The students can learn the vocabulary and concept of the factors of production reading the class notes and completing the exercise on the factors of production available in each nation. Before completing the exercise show the power point presentation on factors of production.
2. Processes - technical vocabulary - The students can learn the vocabulary and concept of the factors of production reading the class notes and completing the exercise on the factors of production available in each nation. Before completing the exercise show the power point presentation on factors of production.
3. Processes - Complete activities two, three and four, the first is a point for discussion and the next two explain the differences in living standards between different nations with seemingly similar natural and geographical advantages. The aim of this exercise is to consider why nations have different levels of success utilising the factors of production available.
4. Reflection - This reflection asks students to consider the current state of their own economy in terms of a PPF curve. These are included on the class handout. (15 minutes)
5. Show the video activity and then play the PPF game, which introduces the concepts of opportunity cost and production possibility frontier curves. (30 minutes)
6. Assessment - this page contains two suggested homework exercises with mark schemes included.
 Key terms:
Factors of production - resources or inputs used in the production process to produce goods and services - land, labour, capital and entrepreneurship.
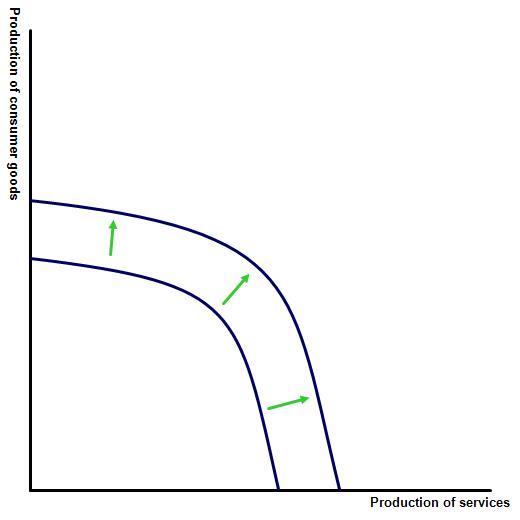
Production possibility curves - also called production possibility frontiers illustrate the maximum possible output combinations of goods or services an economy, when all resources are fully employed. A shift right in the PPF curve represents a rise in either the quantity and / or quality of the production factors.
The activities on this page are available as a PDF file at: ![]() Factors of production
Factors of production
1. Opening activity
Take out a food item e.g. a chocolate bar or a piece of fruit. Have the students brainstorm what was necessary to make the product.
Now review and discuss their response answers and explain that the aim of the lesson is to learn what goes into making products, something that economists call the 'factors of production.'
Have your class label a page in their notebooks with this title, before watching the following short video. While watching the video your classes can label each of the factors of productions identified in the video.
Activities: Production possibility frontiers (PPF / PPC)
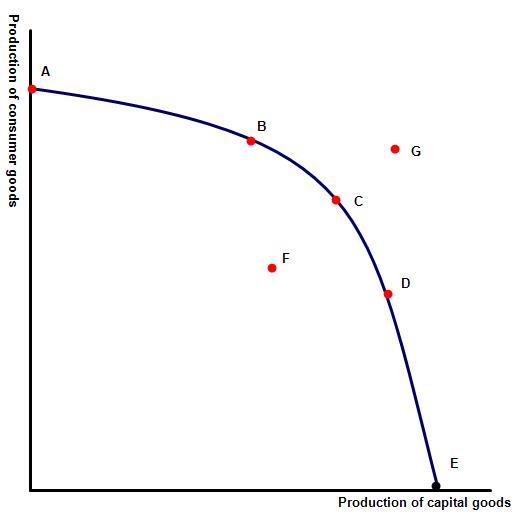 The diagram to the left is sometimes called a production possibility curve (PPC) and illustrates a graphical representation of scarcity. A PPC curve shows the maximum combinations of goods and services that an economy can produce. This presumes that all the resources in the economy are being used efficiently and the supply of technology is fixed. This can also be referred to as maximum or potential output.
The economy pictured above has sufficient resources (factors of production) to produce either capital goods or consumption goods.
(1) What combination of capital and consumer goods can this economy produce?
- they can focus entirely on the production of consumer goods (point A)
- entirely capital goods (point E)
- a combination of these goods and services (points B, C or D).
- point F, or anywhere else inside the PPF curve, which represents the economy when there are unemployed resources in the economy.
(b) Which combination of goods are currently unavailable to the economy, given its current production factors?
They cannot produce at point G, or anywhere else outside of the PPC / PPF, but may very well be achievable in the future.
Activity 2
Examine the following powerpoint which then includes a discussion question on the last slide. ![]() Factors of production
Factors of production
.jpg "The Bosphorous, Istanbul") Activity 3
Activity 3
Several countries have vast resources of certain factors of production. For instance some of the gulf states have vast oil wealth. This is an example of a region of the world well endowed with the production factor land. A number of Asian countries e.g. Vietnam and China have achieved rapid economic growth thanks to an abundance of cheap, relatively skilled labour while America, Japan and Northern European countries enjoy a capital advantage over many other parts of the world.
Research the following countries - Taiwan, Canada, Qatar, Switzerland, Chile, South Africa, Turkey. With which factor of production is each country well endowed?
Taiwan - Labour which is highly skilled and plentiful
Canada - Land through its mineral resources and capital
Qatar - Land through its vast gas reserves
Switzerland - Capital
Chile - Land through a climate and soil which is ideal for growing
South Africa - Land through its vast mineral resources
Turkey - Labour which is skilled, plentiful and cheap for its relatively high skill level.
Activity 4
(a) A number of countries have enjoyed considerable wealth based on products extracted from the land e.g. oil, gas and mineral resources. How might those nations struggle to maintain their standard of living once those natural resources are diminished?
History is littered with nations whose wealth has been primarily based on mineral resources e.g. NAIRU, who have then found it difficult to maintain this standard of living once those resources are diminished. For this reason a number of oil rich nations have invested their current oil wealth in 'Sovereign wealth funds', hoping that this will protect them in the future.
(b) Explain the likely correlation between investment by governments in human capital - education and training and growth in the economy?
There is a positive correlation between the two variables.
(c) Does money in the bank count as 'capital'
Some economists also include the money available for investment purposes as capital as well as the inventory of a business.
Activity 5
Use what you have learnt about factors of production to explain differences in living standards between different nations with seemingly similar natural and geographical advantages. Which factor of production do you think is the most important in terms of the development of different nations?
Hint:
An example might include one that I provide to my students, where I currently work in eastern Turkey, who often ask me to explain why their nation is poorer than many in Europe and why wages are significantly lower. I use the following example using factors of production.
I ask the students to imagine that the government has agreed a $ 10m contract to build a new road, bridge or telecommunications cable e.t.c. I then explain that in North America or Europe this might be completed with perhaps 100 workers and a significant amount of sophisticated capital machinery. The job can be completed in a number of weeks and the $ 10m is then the revenue enjoyed by the business and is received as factor rewards - wages, profit e.t.c.
By contrast in a middle or low income nation the level of capital available to complete the project is lower. This could be evident in either the number of machines used in the construction process or the quality of the available machinery. The skill level of each worker on the project may also be lower. What this means is that to complete the same project, in the same time period, requires significantly more than 100 workers to complete the tasks. Once the project is finished the $ 10m revenue is then shared by a larger number of stakeholders. Naturally this means that each worker on the project receives less as a reward and the output generated per worker is lower.
Activity 6: Reflection
Draw a PPF diagram for your nation, labelling the two axis. Draw the point on the PPF diagram which you think represents the current economic position of the country where you are based? Consider the number of unemployed people, land, empty office space e.t.c. present in the economy before providing your response.
 Important note about the shape of the PPF
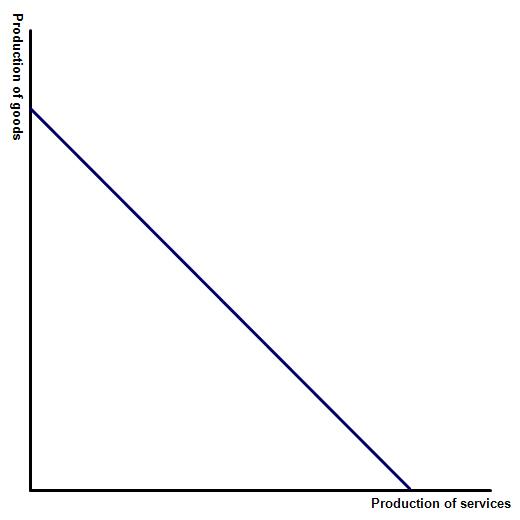
Many of you may have noticed that the PPF curve is not a straight line but instead a curve. This is because the factors of production are not perfect substitutes for each other. So it is not a straight forward process for a country to easily switch production factors from the production of one product to another. In the diagram above a country can produce either capital goods or consumer goods. Many factors of production e.g. factory and office space, skilled engineers, energy supplies can easily be switched between the production of one product and another. However, some resources are simply more suitable to the production of capital goods than consumer goods or vice versa. This means that when a factor of production is switched from the production of one good to another then the opportunity cost rises - i.e. the output lost is greater than the production benefit.
Examples might include land suitable for agriculture only or labour with a narrow set of skills.
7. Video activity
Watch the following short video before completing the activity which follows:
Production possibility frontier game
 This game was created for Economics students at Swansea University and introduces the concepts of opportunity cost and production possibility frontier curves. In this game involves your students will create their own PPF curves.
Running the Game
We start the game with an imaginary economy, IB land which produces just two goods – manufactured goods (coloured paper balls) & agricultural goods (white paper balls). The workers are represented by the students in the room.
The two sets of paper balls are placed into separate containers in the middle of the room. Each container should be labelled 'Raw materials'. You will also place two empty containers (for finished goods) at each end of the room. Your workers will produce a unit of either manufactured or agricultural goods when a ball is moved from the raw material container to one of the finished good containers. The students must stand in a “production” line and pass the ball along the line. Each student must hold every ball but can only hold one ball at a time. The containers need to be a fair distance apart and each student should be far enough apart so that they can only just reach to pass the balls to each other.
Production takes place in sessions with each session consisting of 30 seconds of production time. Initially all of the workers should produce just one of the goods, before gradually moving to the other production line. Once a session is completed, return all the balls to their original containers and plot the output from each session to create your PPF curve.
Variations
This game should be run for a number of sessions, with the results plotted against the original PPF curve. If the class contains sufficient numbers then more workers can be added to the chain, which should have the effect of shifting the PPF curve outwards. Alternatively students may handle more than one ball at a time, representing the impact of an increase in training on the production possibility frontier.
 8. Link to the assessment - examination practise
This is an opportunity to provide your classes with two practise exam questions, based on paper 1 type questions. Both are section (a) in type and can be graded out of 10. A rubric has been included for this purpose. If this exercise is given as a class exercise then you should set a time limit of one hour to complete both questions (including reading time).
Suggested homework activity(s)
1. Use a production possibility frontier (PPF) diagram to explain the relationship between factors of production, economic goods and opportunity cost? [10 marks]
2. Use a production possibility frontier (PPF) diagram to explain the difference between a movement along a production possibility frontier (PPF) and an outward shift? [10 marks]
Available as a handouts at:
The mark schemes for both activities are available at: Guidance for answering the homework question
A blank template for helping to answer the homework activities can be uploaded at: ![]() Essay template
Essay template
 Twitter
 Facebook
 LinkedIn