 IB Docs (2) Team

Profit in perfect competition (HL only)
 Introduction
Your students will already have learnt to draw demand curves in the first part of the course but they will also need to practise drawing the unique demand curve for a perfectly competitive firms. Something that IB students will sometimes confuse is that many will remember that while firms perfectly competition will make normal profits only, in the short run all levels of profit are possible − normal profit, abnormal profits or a firm may be making a loss.
Enquiry question
Why will firms in perfect competition make normal profits in the long run?
Lesson notes
Lesson time: 80 minutes
Lesson objectives:
Illustrate and explain the profit maximisation level in the short run.
Explain, using a diagram, why, in the long run, a perfectly competitive firm will make normal profit (zero economic profit).
Explain, using a diagram, how a perfectly competitive market will move from short run equilibrium to long-run equilibrium.
Teacher notes:
1. Beginning activity - begin with the opening activity and allow 20 minutes for your classes to complete the question and discuss the video. (20 minutes)
2. Processes - technical Vocabulary - the students can learn the key concepts from the video and then completing activities 1 and 2, which should take 20 minutes to go through and discuss. You may need to stop half way through and recap between the short run and long run scenarios. (20 minutes)
3. Practise activities included on the handout should take around 30 minutes.
4. Final reflection exercise - contains a relevant paper one style question on this topic that your students can look at and discuss. This topic of course can be included on papers one and three of the examination and this page contains both types of questions to practise on. This activity could also be set as a homework or classwork exercise. (10 minutes)
Key terms:
Normal profit - when a firms revenue is sufficient to cover the firms costs, including the opportunity costs i.e. AR=AC.
Economic / abnormal profit - when a firms revenue is higher than the firms costs, including the opportunity costs i.e. AR > AC . This can also be called supernormal profit.
Loss - when a firms revenue is lower than ıts costs, including the opportunity costs i.e. AR < AC.
Profit maximising level of output - where MC=MR.
The activities on this page are available as a class handout at: ![]() Profit in perfect competition
Profit in perfect competition
Activity 1
Start by watching the following short video which explains how to illustrate profit on a perfectly competitive diagram and then draw perfectly competitive diagrams making normal profit, a firm making supernormal profit and finally a loss making firm.
Correct response:
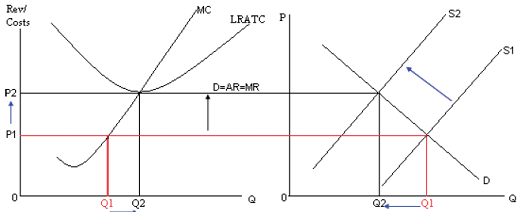
 Notice how the price that the individual firm charges is derived from the industry equilibrium − individual businesses are price takers remember and therefore 'take' the prevailing market price.
The perfectly elastic demand curve is horizontal (as you will have learnt during earlier sections) and the firm, like all profit maximising firms, produces at where MC=MR.
On the diagram AR = AC at price P and so the firm is making normal profits.
 You will notice again that in diagram 3, the price and output for the individual firm are derived from the industry supply and demand. In this example, however, the market price (P) or AR is above the AC and the profit is shown by the blue shaded area or P − C x 0Q. The firm is making sufficient revenue from each product sold to cover all of their costs, including the opportunity costs associated with the business.
 In the last example our perfectly competitive entrepreneur is receiving a loss on the business in economic terms. As the diagram illustrates the firm is receiving price (P) for their good or service but the cost of producing each unit is represented by C, derived from where the output intersects the AC curve. In this example the loss can be identified as C − P x 0Q.
Activity 2: Moving from the short run to the long run
1. When a firm makes abnormal profits, other businesses / entrepreneurs will want to join the industry.
(a) illustrate how this will affect the overall level of supply in the industry?
(b) How will this impact on the level of profit made by the business in this industry in the long run
 As the industry moves from the short run to the long run, more and more entrepreneurs will enter the industry, forcing industry supply to gradually rise, illustrated on the diagram by a rise in market supply from S1 to S2 and a fall in market price from P1 to P2. This will continue until the abnormal has disappeared and normal profits are made.
(c) Will existing firms in the industry be able to prevent the new entrants from joining the market?
No, there are no barriers to entry or exit within this industry.
2. When a firm makes losses, some of the businesses in the industry will wish to leave the industry.
(a) illustrate how this will affect the overall level of supply in the industry?
(b) How will this impact on the level of profit made by the business in this industry in the long run
 Faced with losses many individual firms will close down and seek alternative sources of income. While initially the loss of businesses from the industry has little immediate impact, as each firm is too small to affect the industry supply, as the number of firms leaving the industry continues the supply will gradually reduce, illustrated on the market diagram by a shift in supply from S to S1, forcing prices back up to the point where normal profits are being made. This would be represented by a rise in price from Pe to Pe1. Firms will continue to leave in numbers until the losses in the industry have gone and normal profits have once again been resumed at where ATC = AR (price).
Activity 3: Paper three type questions
(a) The following table represents the demand and supply schedule for a firm in perfect competition, where the price is set at $2 per unit and FC are equal to $15.
| Output | TC$ | MC$ | MR$ | AR$ | AC$ |
| 50 | 130 | 2.3 | 2 | 2 | 2.6 |
| 100 | 240 | 2.2 | 2 | 2 | 2.4 |
| 150 | 330 | 1.8 | 2 | 2 | 2.2 |
| 200 | 400 | 1.4 | 2 | 2 | 2 |
| 250 | 500 | 2 | 2 | 2 | 2 |
| 300 | 660 | 3.2 | 2 | 2 | 2.2 |
| 350 | 840 | 3.6 | 2 | 2 | 2.4 |
| 400 | 1,040 | 4 | 2 | 2 | 2.6 |
| 450 | 1,350 | 6.2 | 2 | 2 | 3 |
(a) Complete the following table and then illustrate your responses on the graph paper provided. For MC you need only include output levels 300 - 450.
(b) Highlight where the firm would produce?
(c) Explain why the MC initially falls before rising sharply.
Specialisation then the law of diminishing return.
(b) Following a fall in demand for the good, the price falls to $1.40. Redraw the table given the new selling price.
| Output | TC$ | MC$ | MR$ | AR$ | AC$ |
| 50 | 130 | - | - | - | - |
| 100 | 240 | 2.2 | 1.4 | 1.4 | 2.4 |
| 150 | 330 | 1.8 | 1.4 | 1.4 | 2.2 |
| 200 | 400 | 1.4 | 1.4 | 1.4 | 2 |
| 250 | 500 | 2 | 1.4 | 1.4 | 2 |
| 300 | 660 | 3.2 | 1.4 | 1.4 | 2.2 |
| 350 | 840 | 3.6 | 1.4 | 1.4 | 2.4 |
| 400 | 1,040 | 4 | 1.4 | 1.4 | 2.6 |
| 450 | 1,350 | 6.2 | 1.4 | 1.4 | 3 |
(a) Will the firm change its output level as a result of the fall in price?
The firm will reduce its output level to 200 units, reflecting the new output level where MC=MR.
(b) Calculate the level of loss made by the business at the new price level.
200 x $0.6 = $120
(c) Explain what will happen to this firms revenue and costs in the long run.
In the long run, firms will disappear from this industry, reducing industry supply which will increase the market price back up to $2 again, the price required to maintain normal profits in the industry.
4. Link to the assessment
Examples of paper one questions include:
Part A
Explain why perfectly competitive firms will always make normal profits in the long run? [10 marks]
Command term: Explain
Key terms to define: normal profit, short run, long run, barriers to entry.
Many businesses at various times, though a combination of market conditions and external circumstances, will find themselves in a position where the business is making either a loss or a situation where they are making abnormal profit.
In monopoly as well as oligopoly market structures the losses or excessive profits can be retained in the long run, because firms in those industries are able to maintain high barriers to entry and exit which maintains market supply at the same level.
By contrast in perfect competition no such barriers exist. Therefore during periods when individual businesses are making a loss in the short run firms will leave the market to seek alternative employment and market supply will be reduced. Firms will continue to exit the industry until an equilibrium price is reached sufficient to provide firms with normal profits where AR = AC. Similarly in periods when market conditions mean that individual firms are making abnormal profits, new firms will enter the market and the price will fall to a level where the abnormal profit will disappear.
Part B
Using real world examples evaluate the view that in some circumstances monopolies can be more beneficial than industries operating under perfect competition. [15 marks]
.jpg)
Command term: Evaluate
Evaluate requires IB students to consider the relative strengths and weaknesses of the above statement.
Key terms to define: Monopoly, perfect competition, natural monopoly, economies of scale.
Relevant real life examples might include a comparison of different markets, one where the candidate believes is best served by a monopoly e.g. postal services and examples of monopolies where the consumer does not receive any obvious benefit.
Evaluate means that the response must consider the merits of both sides of the argument. For example arguments against this statement are that monopoly businesses, due to their size and market power, are able to restrict market supply and so push up prices to ensure abnormal profits are made. Furthermore, barriers to entry will also ensure that the level of abnormal profit will be maintained, forcing the consumer to pay a higher price for less variety of goods and services. This is illustrated on the diagram to the right, where the equilibrium level of price and output in 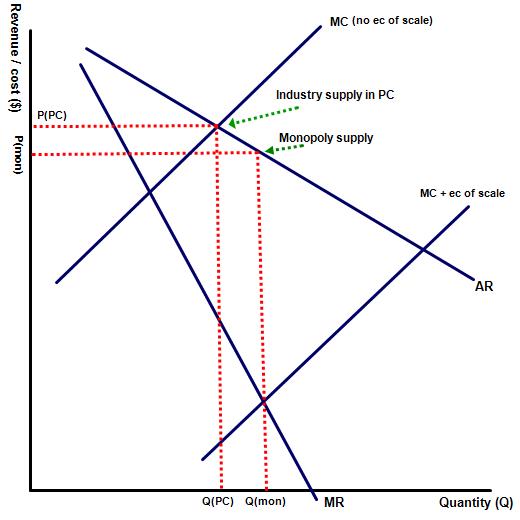 monopoly are represented by Q (mon) and P (mon), making the consumer worse off than under a perfectly competitive market.
On the other hand monopoly business are likely to enjoy the benefits of economies of scale and in situations where those gains are significant and passed onto the consumer in the form of lower prices then the monopoly may be more beneficial than a competitive industry. In diagram two output is higher and prices lower under an industry dominated by one monopoly.
Examples of this might be natural monopolies e.g. telecommunications, space travel or industries such as smart phones and pharmaceuticals, where abnormal profits are necessary so that the business can invest sufficient funds into research and development.
 Twitter
 Facebook
 LinkedIn