 IB Docs (2) Team

Disequilibrium unemployment
.jpg) Introduction
Introduction
This lesson discusses disequilibrium unemployment which comes in two types - real wage unemployment as well as cyclical unemployment. This page also asks students to consider whether real wage unemployment exists in the real world or not? Specifically does the imposition of a minimum wage and generous out of work benefits contribute to real wage unemployment or not?
Enquiry question
What types of unemployment are present when the economy is not in equilibrium (full employment).
Lesson time: 70 minutes
 Lesson objectives:
Explain, using a diagram, that cyclical unemployment is caused by a fall in aggregate demand and that real wage unemployment occurs when labour market imperfections preserve a higher real wage rate than the equilibrium real wage rate.
Teacher notes:
1. Beginning activity - start with the opening question and then discuss this as a class. (Allow 10 minutes)
2. Processes - technical vocabulary - the students can learn the background information on real wage unemployment from the opening video and the questions on activities 1 and 2 plus the list of key terms. (Allow 20 minutes)
3. Application of theory - activities 4 and 5 develop the theory. (10 minutes)
4. Technical vocabulary - the students can learn the background information from the video and questions on activity 6 Allow 10 minutes.
5. Application of theory - activities 7 and 8 develop the theory. (10 minutes)
6. Final activity - activity 9 contains a paper one style question (10 minutes)
Opening activity
Consider whether the individual supply of labour is likely to be PES elastic or inelastic?
 Many economists believe that on an individual level the curve is U shaped with initial rises in price (wage levels) resulting in more workers in the market. However, after a certain wage level, workers reduce their hours of work as they can earn their target income from a lower number of hours.
Key terms:
 Demand for labour - defined as the number of workers that firms are willing and able to hire at a given wage, in a given time, ceteris paribus and is called the aggregate demand for labour.
Supply of labour - called the aggregate supply of labour and represents the number of people willing and able to provide their labour at a given price (wage), in a given time, ceteris paribus.
Disequilibrium unemployment − when wage levels being are pushed above the equilibrium and at this wage level the aggregate supply of labour is greater than the aggregate demand for labour.
Demand deficit unemployment / cyclical unemployment - this type of unemployment is caused by a lack of demand in the economy. Unlike the other forms of unemployment, which operate separately of national income, cyclical unemployment generally occurs following a period of falling economic activity or negative economic growth.
Real wage / classical unemployment - occurs when labour market imperfections preserve a higher real wage rate than the equilibrium real wage rate.
Important note about the labour market
With the level of demand in the labour market including the demand for all types of workers (from nurses to cleaners and brain surgeons) and the supply of labour representing the total number of available workers in the economy, the demand and supply curves are labelled both aggregate demand as well as aggregate supply.
The activities on the page are available as class notes at: ![]() Disequilibrium unemployment
Disequilibrium unemployment
Activity 2: The labour market
 The diagram to the right shows the market for labour.
(a) Why is the aggregate supply of labour directly related to the available wage level.
As the wage level rises more workers are willing and able to supply their labour.
(b) Why is the aggregate demand for labour inversely related to the available wage level.
The number of workers that firms are willing and able to hire increases as the price of labour falls.
(c) What determines the overall level of aggregate demand in the economy?
The skill level and productivity of the workforce. This is because firms will hire workers up to and including the point where the MC (wage) of the last worker = MR (the additional revenue that the worker generates).
(d) What determines the overall level of aggregate supply in the economy?
The supply is determined by the size of the available workforce as well as the opportunity cost of working, which is equal to the other alternatives available, for instance access to training or education or the availability and size of welfare benefits. When the wage from employment rises, then working becomes a more attractive option than the other alternatives.
Activity 3: Real wage unemployment
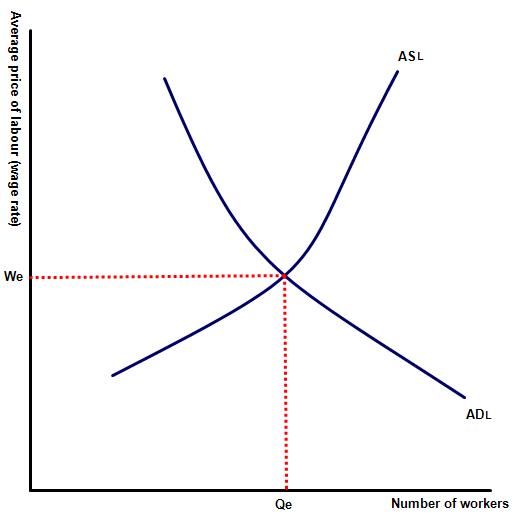
The diagram to the right illustrates the market for labour in equilibrium.
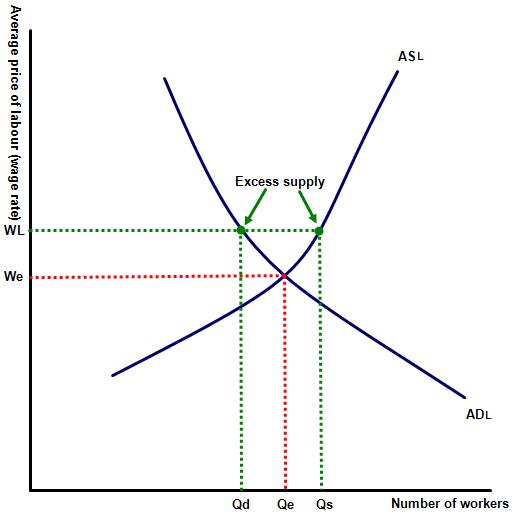
(a) Illustrate the impact on the market for labour when wages are forced above We, showing the excess supply of labour in the economy (real wage unemployment).
(b) Suggest some of the reasons that wages may have risen above the equilibrium level.
The price of labour could have been raised by the imposition of a minimum wage (minimum price for labour), above the equilibrium level or by successful collective bargaining by labour unions. Alternatively the rise in average wage levels could be the result of generous unemployment benefits, which prevents some workers from accepting a job at a wage below this level.
(c) What policies might a government employ to reduce the level of real wage unemployment
The solutions to this type of unemployment include abandoning the minimum wage, reducing the power of the trade unions and the scrapping of out of work benefits.
(d) What are the social and economic costs involved with a government decision to reduce out of work benefits in the economy?
In economic terms the costs of such a policy are probably minimal. Families receiving out of work benefits will probably have a high MPC and so the transfer payments made will circulate around the economy. However, given that such payments are not new money but instead simply diverted from tax payers this benefit is likely to be small.
A bigger cost to the society of cutting out of work benefits would the social costs for families who may be forced to live without an income for a period of time. Such a policy is likely to provide a strain on the families involved as well as very likely lead to a rise in crime and other anti social behaviours.
Activity 4: The effect of minimum wage on unemployment
Look back at the page on minimum price at: Minimum price for labour and observe again the likely impact of minimum wage legislation on unemployment.
Now observe the following table which records the UK unemployment rate between 1980 and 2016 and decide whether this supports the view that the imposition of a minimum wage will necessarily raise unemployment levels. The UK government introduced a minimum wage in 1997.
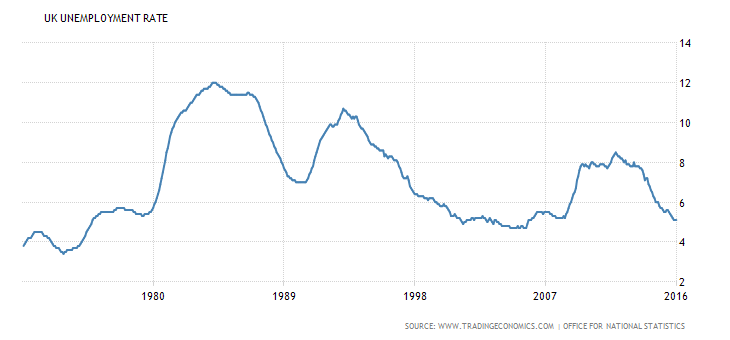
 The example of the UK would indicate that the imposition of a minimum wage does not appear to adversely affect unemployment rates. Following the introduction of the legal minimum wage unemployment continued to fall in the UK, until the economy went into decline following the financial crisis of 2007.
There is an argument that raising wage levels may price some workers out of a job but this might be compensated by the fact that increasing wages for low paid workers creates demand for goods and services and therefore additional demand for labour. We would normally expect low paid workers to have a high MPC - marginal propensity to consume.
Alternatively both arguments may broadly cancel out meaning that there is no direct correlation between the two variables.
Activity 5: The role of trade unions in real wage unemployment
In addition to artificially high levels of minimum wage and generous out of work welfare benefits many economists and right wing politicians also suggest that collective bargaining by organised groups of workers may also contribute to real wage unemployment, by driving up wages above equilibrium level.
Examine the following table (showing American blue collar wages) and evaluate the merit of this view:
| Year | Average hourly wage of union workers | Average hourly wage of non union workers | Wage difference per hour |
| 2015 | $ 22.76 | $ 19.06 | $ 3.70 |
| 2016 | $ 22.90 | $ 19.21 | $ 3.69 |
| 2017 | $ 23.02 | $ 19.51 | $ 3.51 |
| 2018 | $ 23. 47 | $ 20.02 | $ 3.45 |
| 2019 | $ 24.10 | $ 20. 71 | $ 3.39 |
Source: www.bls.gov
Just as with minimum wage there is no definitive proof that trade unions reduce employment levels in the economy. However as the table above shows unions clearly are effective at raising remuneration levels for their members. Part of the trade unions role is also to battle with employers to protect jobs and this may play a part in raising employment levels. There is also the same plausible argument, which relates to the imposition of a minimum wage. This states that the additional wage earned by members of the union will be spent in the economy, raising levels of aggregate demand and contributing to demand for labour.
Activity 6: Cyclical unemployment
Watch the following short video and then answer the questions that follow:
(a) Define cyclical unemployment?
Unemployment caused by a fall in AD within the economy.
(b) Why is there a relationship between aggregate demand in the economy and the rate of cyclical unemployment?
When AD is low, profits are lower and both capital and labour are idle, meaning that the economy is operating below its maximum.
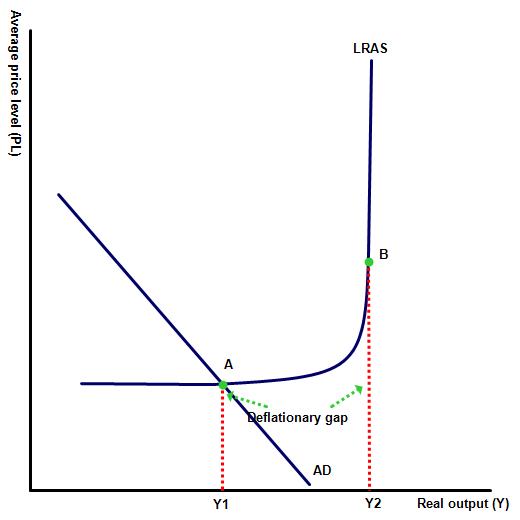
(c) Illustrate using a appropriate diagram why, when the rate of GDP growth in the economy falls, unemployment rises very quickly. However, when GDP starts to rise again employment recovers only very slowly.
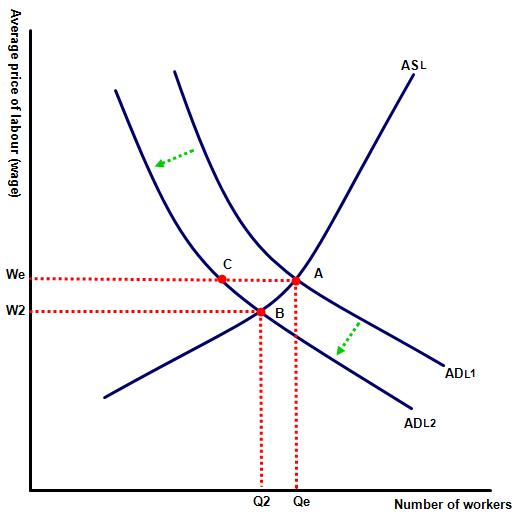 This is because of sticky wages. Normally when demand falls in any market the price would reduce, allowing the market to clear at a new equilibrium. However, the labour market does not operate so efficiently, with workers reluctant to accept lower wages, especially when there are sufficient out of work benefits available and / or trade unions are successful in bargaining up wages, even in recession. Employers for their part are very reluctant to reduce nominal wage levels and will generally only allow them to fall in real terms. This all prevents the market from clearing when AD falls.
This means that following a fall in the AD for labour, the market does not clear at point B, as would be the case in the market for other products. Instead wages remain stuck at We causing A to C unemployment.
Activity 7
Watch the following short video, taken from the Australian news and then discuss the reasons why unemployment in the country may be rising?
Real wages are falling as economic growth slowed during the financial year. GDP only rose by 1% in this period - lower than the rate of inflation. As a result the unemployment rate rose to 6.6% as jobs growth slowed. Consumption is rising in the economy but hopes for falls in unemployment seem unlikely as businesses 'take up slack in capacity' rather than taking on new employees. The ANZ boss has highlighted the frustration brought about by resistance to changes in the labour market, which he blames for the reluctance of companies to hire. Australia is known for its generous welfare benefits system and high minimum wage which many Conservative politicians claim makes many young Australians reluctant to take up low paid work. This type of unemployment is an example of classical or real wage unemployment.
Activity 8: The link between GDP and unemployment
Examine the following table for the Eurozone economy and then complete the simple tasks which follow.
| Year | GDP growth | Unemployment rate % |
| 2019 | 2.5 | 7.3 |
| 2018 | 2 | 7.2 |
| 2017 | 2.5 | 7.9 |
| 2016 | 2 | 10.5 |
| 2015 | 2.4 | 11 |
| 2014 | 0.8 | 11.9 |
| 2013 | (0.8) | 12.0 |
| 2012 | 1.6 | 10.5 |
| 2011 | 2 | 10.0 |
| 2010 | 3.2 | 10.1 |
| 2009 | (1.3) | 9.1 |
1. On a piece of graph paper plot the rate of unemployment and economic growth in the Eurozone.
2. Evaluate the relationship between GDP growth and unemployment.
Your graph should indicate an inverse relationship between the two variables and this is little surprise. As economic activity is reduced firm's profits fall and many will respond by cutting back on recruitment and possibly wages. Similarly as unemployment rises workers purchasing power is reduced and this forces down the level of gross domestic product. However, there is a clear time lag between GDP changing and the impact on unemployment - the rate of job creation particularly rises very slowly, even when the economy recovers.
Activity 9: Link to the assessment
(a) Illustrate using a diagram the difference between structural and cyclical / demand-deficient unemployment. [10 marks]
Guidance in answering this question
 Command term: Illustrate
The command term illustrate requires responses to use appropriate diagrams to demonstrate the difference between the two types of unemployment.
Responses should include the following in any response:
A definition of both structural and demand-deficient unemployment. Responses should note that cyclical / demand deficit unemployment is caused by a lack of aggregate demand in the economy, where as structural unemployment can be caused by a lack of geographical and / or occupational mobility in the labour market.
A diagram(s) illustrating both types of unemployment. The cyclical unemployment diagram (to the left), should show a deflationary / recessionary gap resulting from a 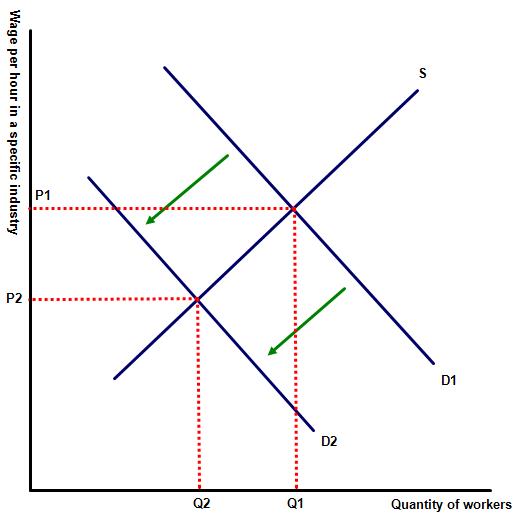 fall in demand in the economy. Alternatively responses could include a PPF diagram with a point clearly marked inside the PPF curve, indicating that the economy is producing below its full employment level.
A structural unemployment diagram should include a fall in demand for certain kinds of labour, illustrated on diagram 2 by a fall in the number of workers in that industry from Q1 to Q2.
Examples of some of the causes of structural unemployment e.g. the decline of some industries due to competition from low wage economies, greater automation or a change in consumption patterns e.t.c.
Responses should also include a recognition that cyclical unemployment is likely to be temporary while structural unemployment may end up permanent without appropriate government action.
An explanation that cyclical unemployment occurs in a recession where as structural unemployment will occur even when the economy is in equilibrium.
(b) Using real world examples, evaluate the view that the use of supply-side policies is the most effective method of reducing unemployment in the economy. [15 marks]
Command term: Evaluate
Key term: Unemployment, supply side policies, demand side policies
The command term evaluate requires a response which compares the effectiveness of supply side policies, in comparison .jpg) with alternative policies (demand side policies) in reducing unemployment.
with alternative policies (demand side policies) in reducing unemployment.
Real world examples should note that the effectiveness of demand and supply side policies depends on the type of unemployment that a government wishes to address.
Responses should include the following:
Examples of supply-side policies that may be used to reduce long term unemployment include measures to improve the nation's infrastructure, investments in human capital as well as increased spending on research and development.
A recognition that supply side measures, unlike demand side policies, are effective in reducing structural unemployment rates, by providing new jobs for workers whose previous skills have become redundant or providing those workers with new skills so that they can compete in the modern jobs market.
Responses should also include an AD/AS diagram illustrating a right shift in the AS curve or an outward shift in the PPF curve, following an increase in aggregate supply in the economy. This is illustrated In diagram one by a growth in productive capacity and real GDP rising from Y1 to Y2, creating more job opportunities as a result of supply side policies.
A recognition that another advantage of supply side policies is that are more likely than other job creation policies at reducing unemployment in the long run, but do not provide a short term fix, sometimes making them less popular with governments.
A recognition that supply side measures, like all economic policies also have some disadvantage e.g. time-lags and the 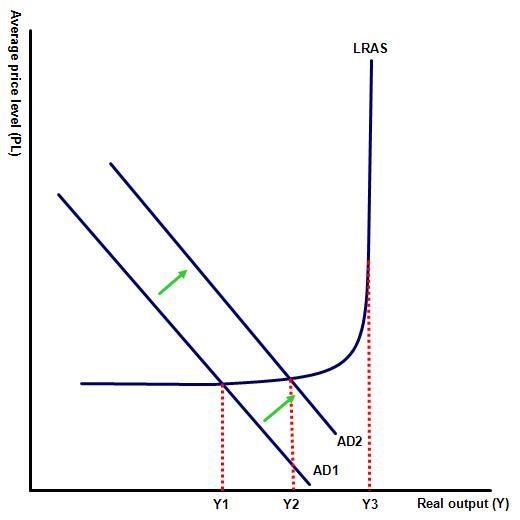 costs associated with large scale investment and government training projects. Another disadvantage is that supply-side policies aimed at increased labour market flexibility or a reduction in access to unemployment benefits may also come at a social cost in terms of a reduction in labour protection or employment security.
In the interests of balance responses should then consider alternative job creation policies, e.g. demand side policies.
An explanation that expansionary demand-side policies can be effective in raising the level of national income / economic growth by increasing one or more of either C, G, I or X. This in turn reduces cyclical unemployment by increasing the demand for labour. Illustrated by diagram two showing a rise in real GDP from Y1 − Y2.
Examples of different monetary and fiscal demand-side policies that may increase either consumption, government spending, investment or net exports.
A discussion of the weaknesses of demand-side policies in reducing unemployment. For example, time-lags, inflationary pressure, higher levels of government debt, increased import levels or crowding out.
A recognition that another significant weakness of demand side policies is that they are only effective in reducing cyclical unemployment levels. Demand side measures are not effective, for example, in reducing levels of equilibrium unemployment.
Relevant real world examples might include fast growing economies such as China, South Korea and Singapore e.t.c. that have successfully employed supply side measures to reduce unemployment levels. Similarly, nations such as UK, USA and Germany have maintained very low levels of unemployment in part a result of labour market de-regulation and cuts to out of work benefits.
 Twitter
 Facebook
 LinkedIn