 IB Docs (2) Team

Unemployment v inflation trade off (HL only)
 Introduction
This lesson looks at the Phillips curve, a diagram which illustrates the relationship between inflation and unemployment. An important note for your classes to understand is that in reality any relationship between the two variables is likely to be between the rate of inflation and cyclical unemployment. Again there is disagreement between the different schools of thought on the relationship between the two variables and hence the shape of the Phillips curve.
Enquiry question
What is the relationship between inflation and unemployment?
Lesson time: 70 minutes
 Lesson objectives:
Discuss, using a short-run Phillips curve diagram, the view that there is a possible trade-off between the unemployment rate and the inflation rate in the short run. (HL only)
Explain, using a diagram, that the short-run Phillips curve may shift outwards, resulting in stagflation (caused by a decrease in SRAS due to factors including supply shocks). (HL only)
Discuss, using a diagram, the view that there is a long run Phillips curve that is vertical at the natural rate of unemployment and therefore there is no trade-off between the unemployment rate and the inflation rate in the long run. (HL only)
Teacher notes:
1. Beginning activity, start with the opening video, which should take around 10 minutes.
2. Processes - technical vocabulary - The students learn the content reading the key terms and the first three activities - allow 20 minutes for this.
3. Reinforcement processes - activity 4 contains a reinforcement activity. (10 minutes)
4. Developing the theory - activity 5 consists of two short videos which provide different perspectives of the question, is the Phillips curve still relevant today? (10 minutes)
5. Applying the theory - activity 6 contains a short response paper three style question. (10 minutes)
6. Reflection activity - activity 7 contains an example of a paper one type question, which you can either print off or project onto the whiteboard. Allocate 10 minutes for this activity.
Key terms:
Phillips curve - an economic concept developed by A. W. Phillips stating that inflation and unemployment have a stable and inverse relationship.
Natural rate of unemployment - The natural rate of unemployment is a combination of frictional and structural unemployment that persists in an efficient, expanding economy when labour and resource markets are in equilibrium.
The activities on this page are available as a PDF file at: ![]() Phillips curve
Phillips curve
Beginning activity
Watch the following short video before completing the activities that follow:
Does the above mean that governments can never reduce unemployment without inflation occurring in the economy?
Hint:
Not necessarily, the answer depends on your perspective - monetarist or keynesian? Monetarist economists would agree with this statement, saying that any fiscal stimulus measures will result in 'crowding out' in the economy, which will push up average prices. Keynesian economists will disagree.
The response also depends on whether there are sufficient unemployed resources in the economy and the type of unemployment that is present in a country - cyclical, frictional, structural or seasonal?
Activity 2: Phillips curve
Watch the following short video and then answer the questions that follow:
(a) What three points can an economy be at?
The economy can have an inflationary gap, a contractionary gap or the economy could be in equilibrium.
(b) Why is the Phillips curve downward sloping in the short run?
Because in the short run there is an inverse relationship between the rate of average prices and the rate of unemployment.
(c) Why is the Phillips curve straight in the Long run?
Because in the long run it is assumed that the rate of unemployment and average prices operate independently of each other.
 (d) Illustrate the following three points on the Phillips curve
- the natural rate of unemployment
- an inflationary gap
- an economy in recession.

Equilibrium point B
Inflationary gap C
Deflationary gap A
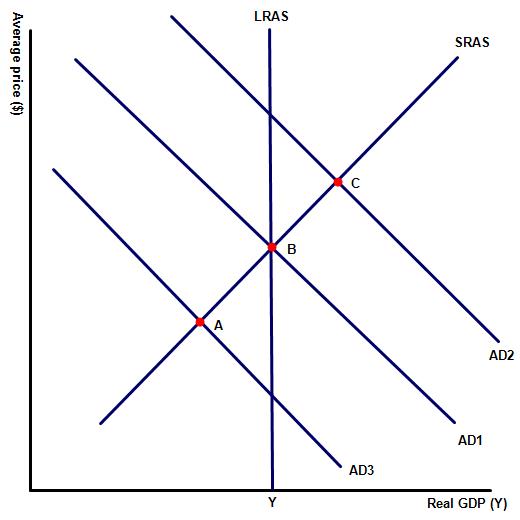
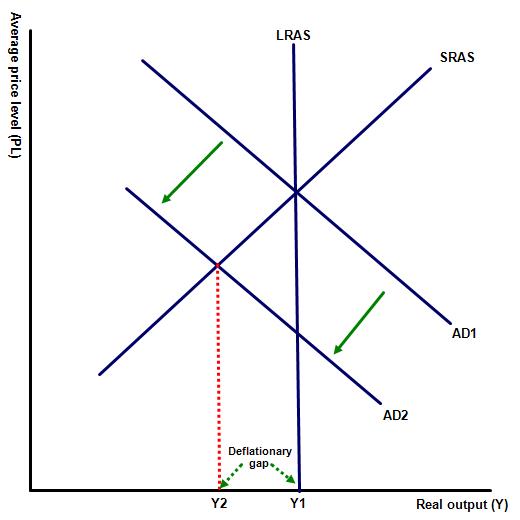
(e) Illustrate the same three points on an AD/AS curve
- the natural rate of unemployment
- an inflationary gap
- an economy in recession.
(f) There is a change in AS in the economy, how would this be illustrated on a Phillips curve
A fall in AS would be illustrated by a right shift in the long run Phillips curve.
A rise in AS would be illustrated by a left shift in the long run Phillips curve.
 Activity 3: Long run Phillips curve
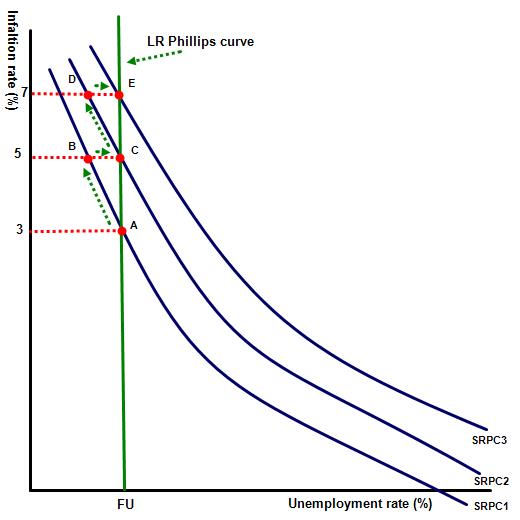
The following questions relate to the Phillips curve illustrated on the right. The economy is at point A.
Explain why there are different levels of inflation at the full employment level, in the long run.
Activity 4: Revision activities
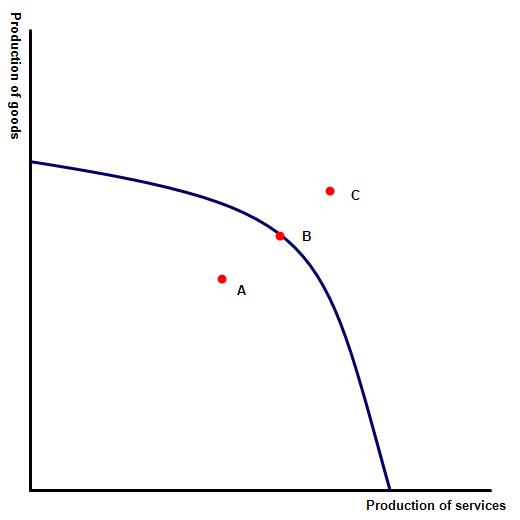
- Draw a PPF curve, a LRAS curve and lastly a SR / LR Phillips curve. Draw the following three points on each curve:
- Point A when the economy is in recession
- Point B where the economy is operating at full capacity and where there is no disequilibrium unemployment in the economy
- Point C when the economy is experiencing an inflationary gap.
Responses should be as follows:

Activity 5: Applying the theory
Watch the following two short videos and then decide yourself if the Phillips curve is really relevant today. The first makes the argument that there is no longer any relationship between unemployment and inflation.
Now for the opposite view:
Activity 6: Paper three type examination question
Draw a graph illustrating the information in the table below. Using a line of best fit connect the points so that it forms a Phillips curve for the USA.
To what extent does the table support the view that inflation and unemployment are inversely related?
If not, what is the relationship between inflation and unemployment in the USA?
Year | Inflation rate % | Unemployment % |
2009 | 1.6 | 9.4 |
2010 | 3.2 | 9.7 |
2011 | 2.1 | 9.0 |
2012 | 1.5 | 8.2 |
2013 | 1.6 | 7.4 |
2014 | 0.1 | 6.2 |
2015 | 1.2 | 5.5 |
| 2016 | 1.26 | 4.9 |
| 2017 | 2.14 | 4.4 |
| 2018 | 2.44 | 4.1 |
| 2019 | 2.30 | 3.7 |
| 2020 | 2.2 | 8.31 |
| 2021 | 6.60 | 4.20 |
.jpg "image: http://fileunemployment.org/") There would appear to be some link between the two variables although more information would be required to answer this question more accurately. Between the economic peak of 2006 / 2007, characterised by low unemployment and the trough created by the financial crisis in 2011, inflation fell from 3.8% in 2007 to 2.1 in 2011. During the same period unemployment rates rose. Interestingly, however, as the American economy picked up and unemployment gradually fell to its natural rate, inflation remained low.
There would appear to be some link between the two variables although more information would be required to answer this question more accurately. Between the economic peak of 2006 / 2007, characterised by low unemployment and the trough created by the financial crisis in 2011, inflation fell from 3.8% in 2007 to 2.1 in 2011. During the same period unemployment rates rose. Interestingly, however, as the American economy picked up and unemployment gradually fell to its natural rate, inflation remained low.
This is because the Phillips curve only records the relationship between cyclical unemployment and demand pull inflation. The low inflation rates in the period 2012 to 2015 could be explained by falling cost push inflationary pressures. This period witnessed low oil and commodity prices, which would have helped keep inflation pressures in check. Falling unemployment rates may also have been partially the result of falling structural unemployment rates as a number of Americans dropped out of the workforce. In summary there may be a link between the two variables but the relationship is far more complicated than A.W Phillips originally stated.
Activity 7: Link to the assessment (paper one type)
(a) Explain why governments may pursue the macroeconomic goals of low inflation and low unemployment. [10 marks]
 Command term: Explain
Key terms to define: Inflation, unemployment
Maintaining a low rate of inflation and low unemployment are both macroeconomic goals of a government. The advantages of maintaining a low rate of unemployment is as follows:
One reason for this is that high levels of employment means higher levels of consumption, investment, tax revenue and national income as a nation is operating closer to its productive capacity - high unemployment in an economy means more of the nation's resources are not utilised, illustrated on the diagram by a loss of output equal to Y1 - Y2.
In addition to the economic costs of high employment there are also significant social benefits to high employment levels. A fully employed workforce is likely to be a happier, more productive population, while unemployment can be associated with higher rates of family breakdown, depression, higher poverty and increased crime levels.
On the other hand, a low and steady rate of inflation is also beneficial to an economy. One reason for this is that it maintains purchasing power, while those on fixed incomes will also find it easier to maintain their current level of real income.
A low rate of inflation also encourages saving, which means that the level of savings available for investment increases.
When inflation within an economy is lower than its trading partners then over time the goods and services produced in the country will gain competitiveness, leading to a rise in exports and a fall in import levels.
In times of low inflation banks are able to keep their interest rates low, which encourages investment. Low rates of inflation produce certainty for businesses which encourages more entrepreneurs to invest.
In conclusion, the ideal point for any economy would be represented by point B on the Phillips curve, rather than A or C.
(b) Using real world examples, discuss the view that there will always be a trade-off between the twin objectives of low inflation and low unemployment. [15 marks]
Command term: Discuss
Key terms to define: Inflation, unemployment
The command term discuss requires a response which considers the two opposing views - one monetarist / free market perspective that believes that unemployment and average prices operate independently of each other and the keynesian view that believes there will be a trade off between the two macroeconomic objectives.
A suitable real life example might include nations such as USA, UK that have successfully managed to maintain low rates of both inflation and unemployment, through the successful maintanance of supply side policies. Similarly, a response might focus on a nation that has struggled to maintain a low rate of either, e.g. Turkey and the Ukraine which has struggled to control its average price levels.
The keynesian view can be illustrated by the short term Phillips curve, represented by diagram 1. At point A unemployment is high but the level of inflation is low. The rationale for this is that in times of high unemployment there is significant spare capacity in the economy and there is little pressure on production costs. At this point demand for products is also likely to be low and so there is unlikely to be significant demand pull pressure in the economy.
However, as the economy expands and cyclical unemployment disappears from the economy there are less spare resources that can be utilised and firms are forced to outbid each other for scarce labour, land e.t.c, forcing up average prices. At the same time demand pull inflationary pressures are likely to emerge in the economy as real income levels rise. At point C the economy is on the limit of its productive capacity and firms are unable to raise their own output levels further without another firm having to reduce theirs.
In free market economic theory, however, average prices and unemployment are independent of each other, with the long run relationship represented by a vertical line (LR Phillips curve). This is because from a free market / monetarist perspective any level of unemployment in the economy is a short term occurrence, part of the economy's natural cycle. In the long run the economy's natural stabilisers will bring the economy back into equilibrium and the only unemployment present in the economy would be frictional and structural - part of a nation's natural rate of unemployment, illustrated on the diagram by NAIRU (non accelerating inflationary rate of unemployment).
 Twitter
 Facebook
 LinkedIn