 IB Docs (2) Team

Inflation
 Introduction
This lesson compares two different types of inflation and examines the tools available to a government, to help reduce inflationary pressures in the economy. There is also a short activity which considers the two perspectives of inflation, monetarist and keynesian.
Enquiry question
What is inflation and how is it caused? What measures can a government take to reduce the rate of inflation in the economy?
Lesson time: 90 minutes
 Lesson objectives:
Distinguish between inflation, disinflation and deflation.
Explain, using a diagram, that demand-pull inflation is caused by changes in the determinants of AD, resulting in an increase in AD.
Explain, using a diagram, that cost-push inflation is caused by an increase in the costs of factors of production, resulting in a decrease in SRAS.
Evaluate government policies to deal with the different types of inflation.
Teacher notes:
1. Beginning activity, start with the opening question, which should take around 10 minutes.
2. Processes - technical vocabulary - The students learn the content reading the key terms and completing first activity - allow 15 minutes for this.
3. Reinforcement processes - activity 3 contains a graphing exercise, drawing both types of inflation on a diagram. (15 minutes)
4. Developing the theory - activity 4 develops the theory by comparing keynesian and monetarist views of inflation. (15 minutes). This activity can be linked to theory of knowledge as the schools of thought provide different explanations for the same event - a rise in average prices. How can we prove either theory is correct?
5. Applying the theory - activities 5 - 7 apply the theory to measures used by governments to reduce inflationary pressures in the economy. (20 minutes)
6. Reflection activity - activity 8 contains a paper one style examination question. (10 minutes)
7. Fun powerpoint - activity 9 is a short video looking at historical records of inflation in different nations. (5 minutes)
 Key terms:
Inflation is a sustained increase in the general or average level of prices.
Deflation is a sustained decrease in the average level of prices (general price level) in an economy.
Disinflation - when the rate of inflation falls, this is not the same as deflation as prices are still rising but at a slower rate than before.
Demand pull inflation - the result of when rises in AD are greater than the countries ability to produce those goods and services.
Cost push inflation - the result of a rise in production costs.
The activities on this page can be accessed as a PDF file at: ![]() Inflation
Inflation
Beginning activity
Start with a simple revision exercise by drawing two short run aggregate supply and aggregate demand curves. On the first illustrate the impact of a rise in production costs in the economy. Now on the second show the effect on one of these diagrams of a rise in economic activity in the economy.
If you have drawn these diagrams correctly then you should see a rise in average prices (inflation). You will have drawn both types of inflation - cost push (supply side) inflation and demand pull (demand side) inflation.
Activity 2
Start by watching the following short video and then answer the questions that follow:
(a) What are the two causes of inflation identified in the video?
Demand pull and cost push inflation. The video identifies examples of cost push inflation as being a rise in production costs while demand pull inflation is a result of a rise in AD, perhaps because a nation is getting richer.
(b) What is the ideal rate of inflation for an economy? Wouldn't an inflation rate of 0 be ideal for a country?
Many economists and central banks believe that the ideal rate of inflation in the economy is around 2%. 1% runs of the risk of deflation, 3% is a little too high and therefore by default 2% feels about right. The USA in 2018 had an inflation rate of 1.9% while the Euro zone as a whole closer to 1.5%.
If inflation is too low because without inflation there is little incentive for businesses to invest and little incentive for individuals to purchase property of other assets. In fact without any inflation, knowing that the value of money will stay constant, many individuals may simply choose to place their money in the bank and let it sit - and this reduces the level of economic activity in the economy.
On the other hand, as the video highlighted inflation above this figure is also bad for the economy. If prices are rising too fast then this brings instability to the market - savers will be wiped out as the value of their savings falls while reckless consumers will be rewarded for their fecklessness.
Activity 3: Demand pull and cost push inflation
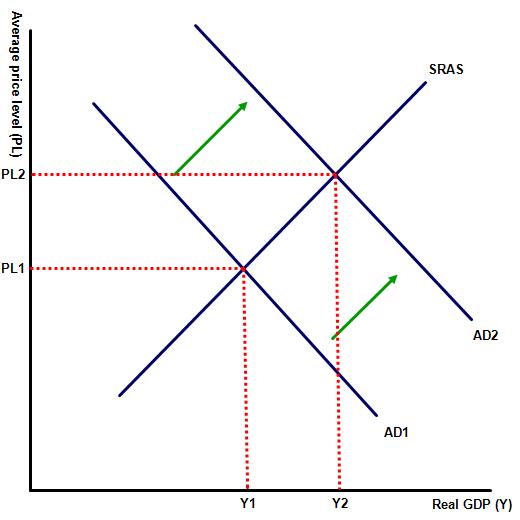
(a) Why do many economists regard demand pull inflation as good inflation?
While a rise in average prices is itself not positive it is at least a consequence of a rise in economic activity. This is shown in diagram 1 by the rise in prices (inflation) from PL1 to PL2, caused by a rise in aggregate demand from AD1 to AD2 and a rise in real GDP from Y1 to Y2.
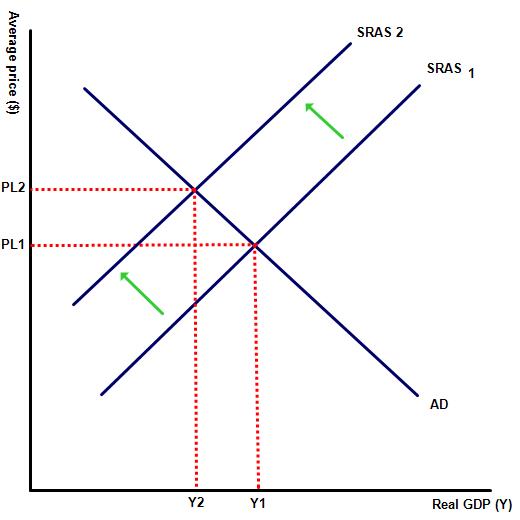
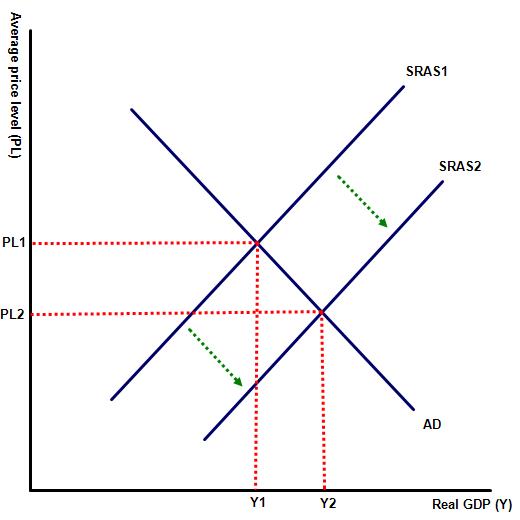
(b) Why do economists regard cost push inflation to be 'bad inflation'?
When a country experiences cost push inflation, the rise in average prices comes with a fall in real GDP or national income.
(c) Is demand pull inflation really good?
Probably not, but it is certainly better than cost push inflation. Governments would certainly be more likely to tolerant a small rise in the inflation level above its target rate, if that were demand pull inflation.
(d) Provide examples of some of the causes of both types of inflation.
Examples of factors that might cause a rise in demand pull inflation:
- a rise in income levels
- loose monetary policy (very low interest rates)
- printing of money (quantitative easing) by Central banks.
Examples of factors that might cause a rise in cost push inflation:
- supply side shocks such as sharp rise in oil or commodity prices
- a deterioration of the currency price
- a rise in labour costs (without a corresponding rise in productivity rates).
Activity 4: Keynesian v Monetarist view of inflation
Start with the following video and the complete the activities which follow:
(a) What is the Fischer equation:
MV=PT or money supply times the velocity of circulation = the rate of prices over time.
(b) Explain the difference between keynesian and monetarist views of inflation?
Keynesian economists believe that any rises in private consumption, government spending, investment or exports will result in demand pull inflationary pressures. When aggregate demand exceeds aggregate supply at the full employment level an inflationary gap arises. The larger the gap between the two variables, the more rapid the inflation.
By contrast monetarist economists argue that inflation is caused instead by a rise in the money supply. Because any rise in the money supply will cause inflation and not an increase in GDP then governments should maintain a stable money supply to ensure price stability.
(c) Which of the two inflation perspectives (keynesian or monetarist) do you believe is the more correct?
 There is of course no definitive answer to this question. They are both normative statements and cannot be proven or unproven. The only data that can be used to answer this question is based on empirical evidence. Take for example the GDP growth and inflation figures for the UK, illustrated on the graph to the right.
There would appear to be a strong positive correlation between both variables, indicating a strong link between the level of AD and the rate of average price change. This strongly supports the keynesian view of inflation.
However, monetarists could just as easily argue that the rate of change in the money supply also mirrors the rate of GDP and therefore, their assertion that inflation is the result of rises in the money supply, rather than AD, also has merit.
Monetarist economists could easily argue that during periods of rapid economic activity the money supply will also rise as the velocity of circulation increases. Similarly we would expect the velocity of circulation to slow down during a period of slow economic growth.
 Activity 5: Reducing inflationary pressures
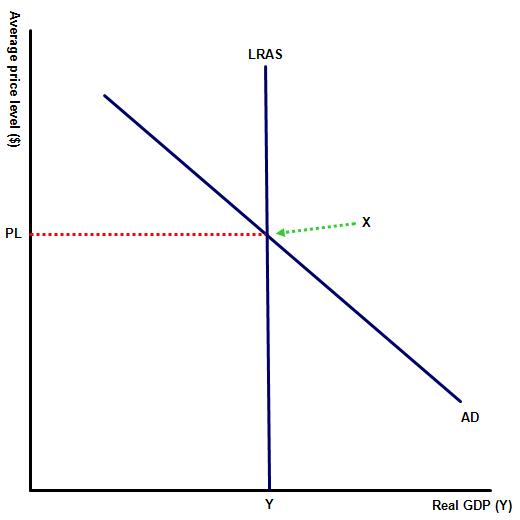
The diagram to the right illustrates an economy in equilibrium.
(a) Identify some of the supply side measures that a government might employ to reduce the rate of inflation in the economy. Illustrate this on your diagram.
Short run measures:
- increasing the value of the currency so that imports are cheaper to purchase
- reducing interest rates so that firms can borrow more at lower rates (increasing capital)
- domestic subsidies.
Long run measures:
- increasing the productivity of labour by investing in skills and training (making labour more productive)
- investing in improved technology (making capital more efficient)
- investment in infrastructure so that goods and services can be transported more easily (making land more efficient).
.jpg)
(b) Identify some demand side policies that might reduce inflation within the economy? Illustrate this on a diagram, showing the fall in real output.
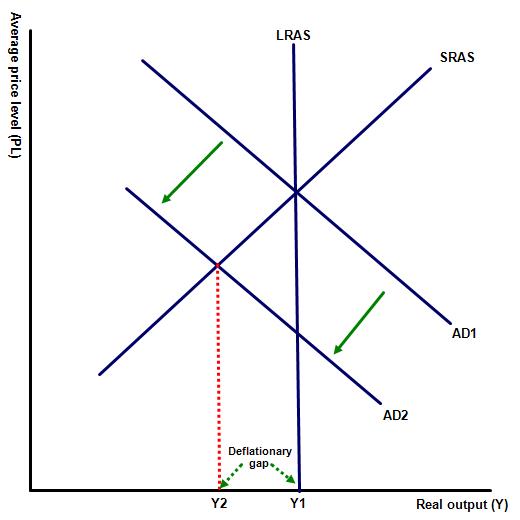 Deflationary fiscal and / or monetary policy or a fall in aggregate demand caused by an external event.
Activity 6: The difficulty of reducing inflationary pressures
Complete the following table which outlines some of the difficulties that governments have in managing inflation:
| Policy measure | Supply side / demand side policy | Cost of the policy |
| Investing in skills and training (making labour more productive) | Supply side | Such a policy is only effective long term. Any government may not see a return on such a measure for many years. |
| Reducing government spending levels | Demand side (fiscal policy) | This policy will have an impact on a number of people in the electorate. Some of which might be the most vulnerable in society those effected by the cuts are likely to take out their disappointment during their next opportunity to vote. |
Increasing the value of the currency so that imports are cheaper to purchase. | Supply side | This policy will reduce import prices but will also make exports more expensive to purchase overseas. Such a policy may have a negative impact on net exports. |
| Raising interest rates in the economy | Demand side (monetary policy) | Higher mortgage and loan repayment costs, falling output levels and higher cyclical unemployment in the economy. |
Investing in improved technology (making capital more efficient) | Supply side | The economy may not see a return on such a measure for several years. The increased technology (if labour saving) might also cause increases in structural unemployment rates. |
| Raising tax levels | Demand side (fiscal policy) | Lower disposable income levels. Such a policy is very unpopular politically. |
| Investment in infrastructure so that goods and services can be transported more easily (making land more efficient). | Supply side but also fiscal policy | Long term this policy might reduce cost push pressures but might also add to demand pull measures through increases in aggregate demand. |
| Domestic subsidies | Supply side | Such a policy will have to be financed out of higher taxes or cuts to government spending elsewhere. This policy is probably a very short term measure. |
Activity 7: Link to the paper one assessment
An examples of typical paper one question includes:
Part (a)
(a) Illustrate the difference between cost push and demand pull deflation. [10 marks]
Command term: Illustrate
Key terms to define: Cost push deflation, demand pull deflation
The command term illustrate means use diagram (s) to explain the difference between the two concepts.
Cost push deflation is sometimes called good deflation and is illustrated on diagram 1 by a right shift in the AS curve, leading to lower average prices (PL1 to PL2) as well as higher real output levels (Y1 to Y2). On the diagram the rise in LRAS results in a fall in average production costs, meaning that producers are more willing and able to produce goods and services at the same price. Examples of factors that can lead to cost-push deflation include a rise in currency value, making imported goods cheaper; a fall in oil prices; or an improvement in productivity resulting from technological advancement.
 Demand-pull deflation is often called bad deflation and would be illustrated by a fall (or left shift) in the AD curve, leading to an output or deflationary gap.
Demand pull deflation, like cost push deflation reduces average price levels in the economy but does at the expense of real GDP, illustrated on diagram 2 by a fall in average price level from PL1 to PL2 and a decrease in real GDP from Y1 to Y2.
Examples of factors that may cause a fall in aggregate demand include:
- a rise in interest rates / contractionary monetary policy
- a fall in government spending or a rise in tax rates
- external factors such as a global or regional slow down in economic activity.
Part (b)
Using real life examples, evaluate different policies that a government might implement to reduce inflationary pressure in the economy. [15 marks]
Command term: Evaluation
Key terms: Cost push inflation, demand pull inflation
 In this example the command term evaluate means weighing up the strengths and weaknesses of the statement and reach a conclusion supported by evidence.
Real life examples might include nations that have successfully maintained a low rate of inflation over a period of time e.g. the role of the European central bank in maintaining a low rate of interest throughout the Eurozone.
Supply side (cost push) inflation is caused by rising production costs in the economy and can only effectively be brought under control by the implementation of supply side policies. This is illustrated by the first diagram, where a government has successfully managed to reduce production costs, using supply side policies and average price levels have fallen from PL1 to PL2. Note that this is a fall in the rate of average price rises (disinflation) and not deflation which represents an economy with falling prices or an inflation rate below zero.
Examples of supply side measures that might be effective include:
- increasing the productivity of labour by investing in skills and training (making labour more productive)
- investing in improved technology (making capital more efficient)
- investment in infrastructure so that goods and services can be transported more easily (making land more efficient).
However the above are long term measures, taking years to take effect. In the short run AS can be increased by the following range of measures:
- increasing the value of the currency so that imports are cheaper to purchase
- reducing interest rates so that firms can borrow more at lower rates (increasing capital)
- domestic subsidies.
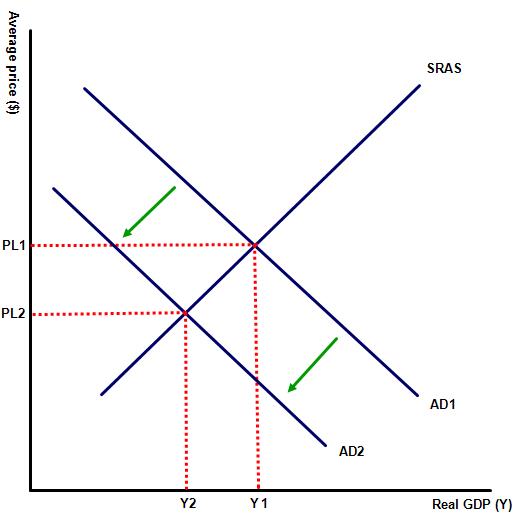 In terms of demand pull inflation, governments can reduce inflationary pressure by reducing aggregate demand levels in the economy. This can be achieved by a combination of contractionary fiscal and monetary policies. This is illustrated on diagram 2 by a fall in aggregate demand from AD1 to AD2.
Fiscal policies might include raising taxes and / or reducing government spending levels. Of course such a policy is difficult for any government to implement. Raising taxes is very unpopular politically and simply reducing public spending levels will also have an impact on a number of people in the electorate. Those voters are likely to take out their disappointment at any cuts to government services during their next opportunity to vote.
Monetary policies,therefore, are the most widely used measure and governments can reduce inflationary pressures in the economy by reducing the money supply and / or increasing interest rates. Though it is important to note that a number of governments no longer directly control monetary policy, with control of the money supply and interest rates instead under the control of an independent Central bank.
From a monetarist perspective a government wishing to keep inflationary pressures in check must ensure that growth in the money supply rises no quicker than the rate of economic growth in the economy.
Real life examples might include nations that have successfully maintained a low rate of inflation over a period of time e.g. EU, USA and the UK. For example, a response might discuss the role of the European central bank in maintaining a low rate of interest throughout the Eurozone.
A suitable conclusion would note that the appropriate course of action would depend on the type of inflation and must also consider the impact on other macroeconomic indicators.
Activity 8: Which countries in the world have the worlds highest inflation rate?
 Twitter
 Facebook
 LinkedIn