 IB Docs (2) Team

Consequences of economic growth
 Introduction
This lesson looks at the positive and negative consequences of the third macroeconomic objective, economic growth. Many of your students will be from economies that have experienced rapid economic growth or at least be familiar with nations that are. They should be able to draw on their own experiences in terms of the positive and negative impact on those nations - these may be economic as well as the social consequences of economic growth.
Enquiry question
What are the consequences of economic growth (both good and bad) on living standards and sustainability.
Lesson time: 70 minutes
Lesson objectives:
Discuss the possible consequences of economic growth, including the possible impacts on living standards and sustainability.
Teacher notes:
1. Beginning activity - start with the beginning revision activity, a diagrammatic exercise which should take no more than 15 minutes.
2. Reflection - the opening powerpoint illustrates photographs of development in Dubai. Consider the impact of this development on a range of stakeholders. (5 minutes)
2. Processes - technical vocabulary - students can learn the content watching the videos, reading the key terms and then completing activity 3 and 5, which should take around 20 minutes.
3. Applying the theory - activity 4 focuses on NAURU, a once wealthy nation whose wealth was based on the mining of a rare earth. Years later, the mineral has largely disappeared while the environmental degradation of the island has implications for future generations to come. (10 minutes)
4. Developing the theory - activity 6 considers the relationship between a nation's wealth and income inequality. Does wealth bring benefits for everyone or just a select few? Allow 10 minutes to complete both.
5. Reflection activity - contains an example of a paper one type question, which you can either print off or project onto the whiteboard. Allocate 10 minutes for this activity.
Key terms:
 Economic growth - the growth of real output in an economy over time and it is measured by an increase in real GDP.
Actual growth is an increase in real output for an economy over time. It is measured as an increase in real GDP.
Potential growth is an increase in the potential output of an economy through an increase in the quantity/quality of resources.
Development / living standards - improvements to the quality of life in a nation, measured by GNI per capita, literacy rates and life expectancy.
Structural unemployment - long term unemployment caused as a result of a fall in the demand for a particular type of labor occurring as a result of the changing structure of an economy due to changes in the demand/supply and/or technology. It occurs when there is a mismatch between the skills of unemployed workers and the jobs available or as a result of rigidities in the labor market.
Green GDP - an index of economic growth minus the environmental consequences caused by that growth.
The activities on this page are as available as a PDF file at: ![]() Consequences of economic growth
Consequences of economic growth
Activity 1: Economic growth
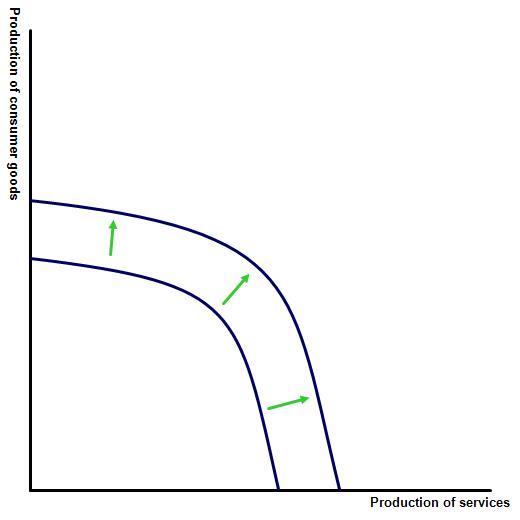
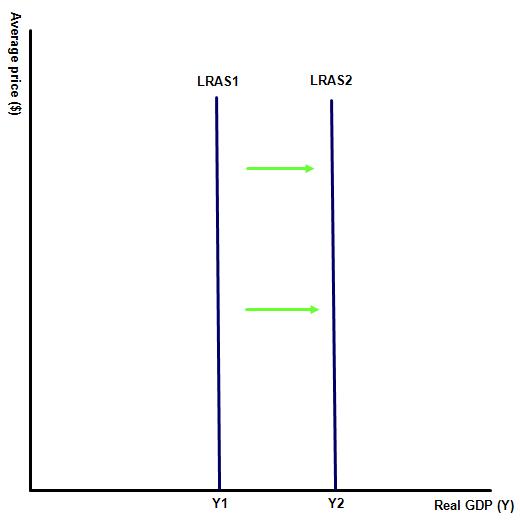
Illustrate the impact of economic growth on AD / AS diagrams as well as the production possibility frontier.
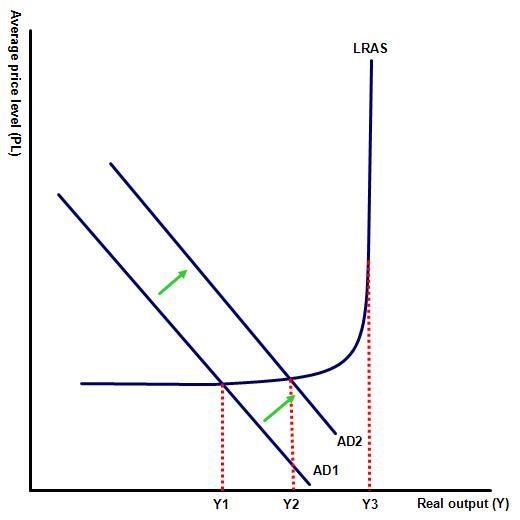
Economic growth can be illustrated by an outward shift in the PPF curve (diagram 1), a right shift in AS, leading to a higher level of real national output (diagram two) or alternatively it may also be represented by a rise in aggregate demand, where following an increase in one or more of the components of aggregate demand real output has risen as more of the economy's unemployed resources are being used - diagram 3.
Activity 2: Development in Dubai
Watch the following presentation focusing on Dubai - ![]() Development in Dubai and consider both the positive and negative consequences on the small nation? Consider the following stakeholders in your response.
Development in Dubai and consider both the positive and negative consequences on the small nation? Consider the following stakeholders in your response.
- a highly qualified worker with the skills to access one of the new jobs that have been created
- a traditional farm worker who is struggling to find work after the introduction of new farm machinery to their workplace
- a close knit family split by having both children move to a far away city to find work
- a fisherman whose daily catch is retarded by declining water quality in the area.
Activity 3: Benefits of economic growth
Watch the following youtube videos and then answer the following question:
'Evaluate the view that economic growth will always deliver greater benefits than costs to the economy'
And now for the alternative view:
Hint:
The costs of growth include greater inequality of incomes, increased pollution, congestion as well as a potential degradation of the water supply and air quality. Possible rises in structural unemployment and the loss of some traditional industries.
On the other hand;
As an economy grows the population has additional resources to purchase health and education services. Governments have additional resources to spend on poverty reduction and improvements to infrastructure, health and public services. Economic growth also leads to happier societies in many cases.
Activity 4: A focus on Nauru?
 During the 1970s and early 1980s, Nauru, a beautiful island in the Pacific enjoyed one of the highest per capita incomes in the world. The population of several thousand, on this 21 square mile island enjoyed incredible wealth, dependent almost entirely on the phosphate deposits that originated from the droppings of sea birds.
Phosphate is one of the most valuable commodities on the planet and the tiny island of Nauru contained vast deposits of it. For several decades the inhabitants were simply handed piles of money every few months from the proceeds of the Phosphate sold all over the world. With the price of phosphate high Nauru was able to import luxury goods from all over the globe. Not only were the residents wealthy by international standards but furthermore, they were not even required to work for their income. However, successive governments made inadequate plans for life after phosphate and the day that every resident on the island dreaded finally came to pass in 2002. By then the countries assets were estimated to have shrunk from Aus $ 1.3 billion in 1991 to just $138 million in 2002. Worse still, decades of mining have destroyed the top soil making it possible to grow crops on only a small area of land along the coast. A once fertile island has gone and the island is now saddled with 90% unemployment and very low living standards.
Questions:
1. In what ways does the example of Nauru illustrate the difference between economic growth, development and green / sustainable development?
2. What lessons can the oil rich nations of the Middle east learn from Nauru?
Activity 5: Does economic growth bring about higher income inequality?
Start by watching the following two short videos and explain whether economic growth is likely to lead to higher rate of inequality or not?
Paul Krugman, being interviewed starts with the statement that there is zero evidence to suggest that the current high rates of equality experienced in the US help economic growth. Since the 1980s when inequality soured many of the lowest income households were left behind.
The opposite opinion
The video explains that in a free market income inequality is natural and healthy for an economy. In USA, for example, all individuals have the freedom to make their own choices. Every individual has different opportunities and are free to explore them as they wish - when individuals become successful and rich everybody benefits.
Activity 6: A closer look at wealth and inequality
The following table ranks a range of nations by both inequality and national income. Is there a relationship between these two variables?
| Nation | GDP | Inequality rank |
| South Africa | Middle income | 1 (lowest equality) |
| Namibia | Middle income | 2 |
| Botswana | Middle income | 3 |
| Suriname | Low income | 4 |
| Zambia | Low income | 5 |
| Russia | Middle / high income | 80 |
| Tonga | Middle income | 81 |
| Bulgaria | Middle / high income | 82 |
| Yemen | Low income | 83 |
| Fiji | Middle income | 84 |
| Slovak Republic | High middle income | 154 |
| Czech Republic | High middle income | 155 |
| Slovenia | High middle income | 156 |
| Iceland | High income | 157 |
| Ukraine | Low middle | 158 |
Activity 7: A focus on India and China
Start by watching the following short video and then complete the activity which follows:
In the video the commentator Dan Celia outlines some of the challenges likely to be presented by a growing Indian economy in the future.
Outline these challenges and using the table below explain whether you believe that Dan's fears are likely to be realised or not?
| 2015 | 2020 | 2025 | 2030 | 2035 | 2040 | 2045 | 2050 | |
| USA GDP $b | 18,036 | 21,927 | 25,308 | 30,914 | 35,319 | 40,457 | 45,553 | 51,370 |
| China GDP $b | 11,182 | 16,458 | 21,900 | 28,852 | 37,635 | 48,605 | 61,775 | 77,730 |
| India GDP $b | 2,073 | 3,297 | 4,629 | 6,433 | 8,852 | 12,061 | 16,171 | 21,466 |
Economists like Dan Celia are understandably concerned about the impact of large scale economic growth in China and India during the first half of this century. If the table above is to be believed and these are only estimates, the rapid levels of industrialisation are likely to lead to severe strains on both energy and food supplies in the future.
Dan highlights India as being a significant player in the future but perhaps his concerns should instead be on China rather than India? According to the data above China is expecting to overtake the US, as the world's largest economy by 2035 - the US and indeed many other Western nations will still boast significantly higher per capita GDPs at this stage.
Predicted GDP in million US$ 2015 - 2050 (Source: Price Waterhouse Coopers)
Activity 8: Link to the paper one assessment
An example of a typical paper one question on economic growth includes:
(a) Explain how demand side policies can be used to achieve long-term rises in potential output. [10 marks]
Command term: Explain
Key term to define: Demand side policies, potential output
Demand side polices would normally be associated with rises in economic growth / real GDP, moving an economy closer to its potential output level, rather than achieving long term increases to productive capacity. This is shown on diagram one by a rise in aggregate demand from AD1 to AD2 which brings an economy closer to its potential output level at Y3.
However, there are instances where an expansionary demand side 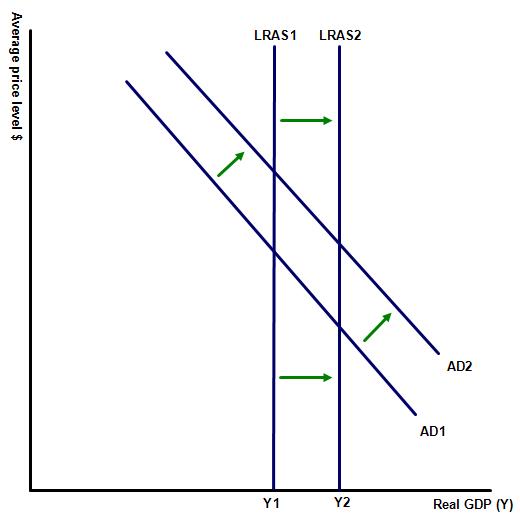 policy can also be effective in improving the productive capacity of a nation. Examples of this include increases in government spending which improve a nation's infrastructure or a reduction in interest rates, making it cheaper for businesses to borrow money to invest in new plant and machinery.
In the above examples the demand side policies would also be effective in raising the productive capacity of the nation through increases in aggregate supply. This is illustrated on diagram 2 by a rise in AD as well as LRAS, resulting in an increase in GDP from Y1 to Y2.
(b) Using real life examples, evaluate the argument that economic growth is always good? [15 marks]
Command term: Evaluate
In this example the command term evaluate requires candidates to make a judgement on the relative costs and benefits of economic growth, including an overall conclusion, based on the evidence submitted.
Real life examples might include nations that have been successful at raising living standards through economic growth e.g. Singapore, South Korea and Rwanda. Responses might also choose to include nations where economic growth has sometimes come at the expense of reduced living standards or where the rise in economic growth brought about a lower improvement in living standards than might have been expected e.g. China, Nigeria and Brazil, where economic growth has come at the expense of the environment.
Responses should include the following:
A definition of economic growth. If this has already been defined in the first part of the question there is no need to repeat the definition, but students are required to refer to this definition at the beginning of this section in order to gain credit for it.
Arguments in support of the view that economic growth is always good. For example, countries with high levels of GDP normally also have a high HDI. This maybe because nations that experience economic growth, will normally have greater resources to invest in infrastructure and improvements in health and education. In many cases economic growth also leads to rises in income levels and employment opportunities.
Examples of nations that have made significant improvements to their quality of life as a result of significant rises in economic growth. Examples might include China or other emerging economies that have experienced sharp falls in poverty and improvements to HDI, following a significant rise in economic growth.
A recognition of the alternative perspective, that why economic growth will often lead to improvements in the HDI, that this is not always the case. For example it could be noted that the collection of GDP / GNI data contains weaknesses. For instance 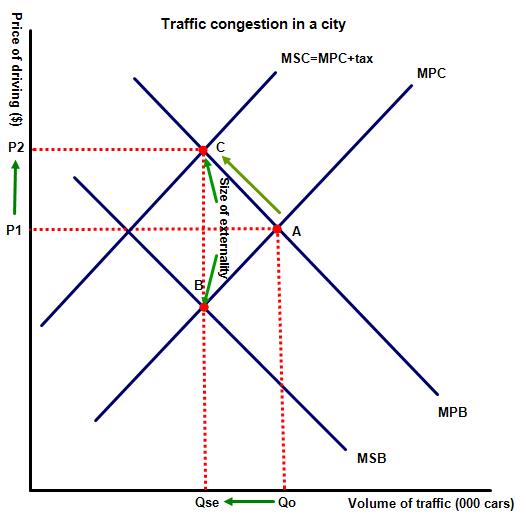 changes to GDP / GNI do not necessarily take account of disparities in the distribution of income or the quality of other non economic indicators of development - e.g. working conditions, life expectancy and other quality of life indicators such as the availability of new products, environmental conditions, defence expenditure, the size of underground economy or the value of non-marketed output e.t.c.
A relevant diagram illustrating the costs and benefits of economic growth, such as the private and social costs of increased consumption of demerit goods, as well as the externalities associated with ths.
Examples of this might be a sharp rise in pollution or traffic congestion within fast growing cities or the fact that some LEDCs, that have experienced high rates of economic growth but have also seen sharp rises in economic degradation or significant gaps in wealth and income inequality. For example, the diagram below illustrates one of the adverse effects of economic growth, a rise in traffic congestion and pollution. The result is an increase in welfare loss, resulting from the increase in consumption of some demerit goods, represented on the diagram above by Qo rather than the socially optimum level of Qse.
A short conclusion weighing up the relative merits of both arguments and the impact upon different stakeholders, as well as the short-term as well as long-term consequences upon sustainability. For example, a conclusion might recognise that while the net welfare effect of economic growth is likely to be positive, some stakeholders, typically the young and skilled will benefit more than others. The conclusion might also recognise that in some cases the positive effects of sustained economic growth, might not lead to higher living standards for a period of time.
 Twitter
 Facebook
 LinkedIn