 IB Docs (2) Team

Unit 3.3(1) Macroeconomic objectives: economic growth

Economic growth is a key statistic used by economists to measure the performance of a country's economy. Economic growth is the increase in a country’s real GDP over a given time period. This is normally one year although governments release growth data quarterly so they can continuously monitor changes in macroeconomic activity. Economic growth means the money value of goods and services produced by an economy is increasing over time.

- Understanding economic growth
- Measurement of economic growth
- Short-run growth
- Actual output
- Long-run growth
- Potential output
- Interpreting growth using the PPC model
- Consequences of economic growth for living standards, the environment and income distribution.
![]() The link to the attached pdf is revision material from Unit 3.3: Macroeconomic objectives: economic growth. The revision material can be downloaded as a student handout.
The link to the attached pdf is revision material from Unit 3.3: Macroeconomic objectives: economic growth. The revision material can be downloaded as a student handout.
Understanding economic growth
Economic growth is the increase in a country’s real GDP over a given time period. This is normally one year although governments release growth data quarterly so they can continuously monitor changes in macroeconomic activity. Economic growth means the money value of goods and services produced by an economy is increasing over time.
Measuring economic growth
The growth rate of an economy is measured as the annual percentage change in the real GDP of a country. The calculation of real GDP using the GDP deflator is covered in detail in Unit 3.1(1). The economic growth rate for a country in 2021 is calculated using the equation:
real GDP 2021 – real GDP 2020 / real GDP 2020 x 100 = 2021 economic growth rate
For example, if an economy had the following real GDP data: real GDP 2020 $960 billion, real GDP 2021 $983 billion
$983 billion - $960 billion / $960 billion x 100 = 2.4%
 China is now the world’s second-biggest economy with a GDP of over 14 trillion US$. It is set to overtake the US and become the largest economy in the world.
Over the last 10 years, it has consistently achieved growth rates in excess of 6% although the Covid19 crisis will probably see a fall in its GDP in 2020.
The rise of China’s GDP has seen it become the most successful country in history at taking people out of poverty. World Bank data shows that more than 850 million Chinese people have been lifted out of extreme poverty in the last 30 years.
Questions
a. Outline what you understand by an economic growth rate of 6%. [2]
An economic growth rate of 6% means the money value of a country's real GDP is 6% greater in the current year than it was in the previous year.
b. Using a circular flow of income diagram explain how economic growth in China would take so much of its population out of poverty. [4]
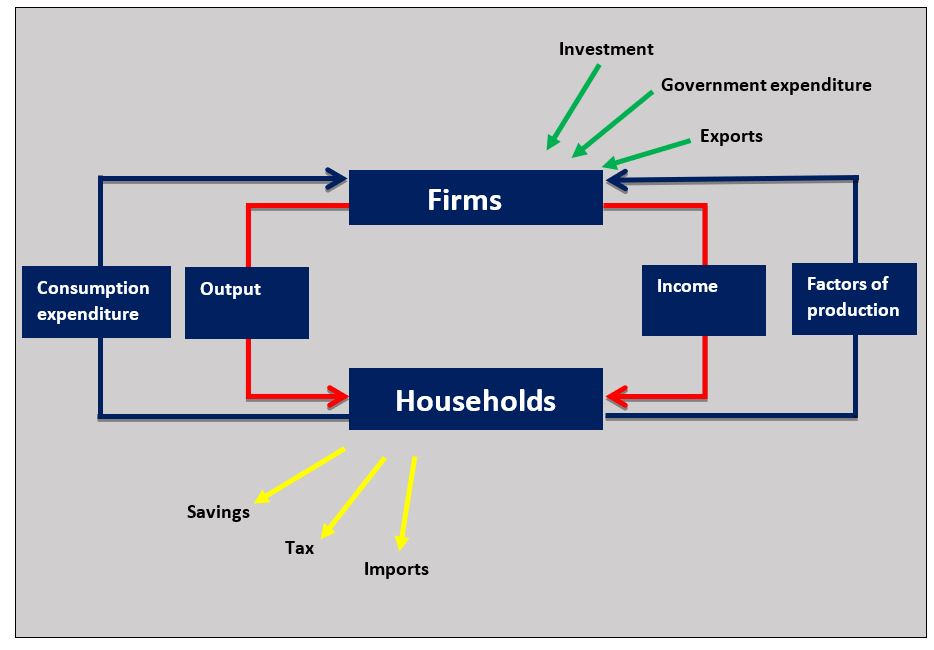 As China's real GDP grows over time its greater output generates more income for its households and this takes many of them out of poverty. The rise in income is shown in the diagram as a flow from firms to households.
c. Using a diagram explain how an increase in aggregate demand might lead to economic growth. [4]
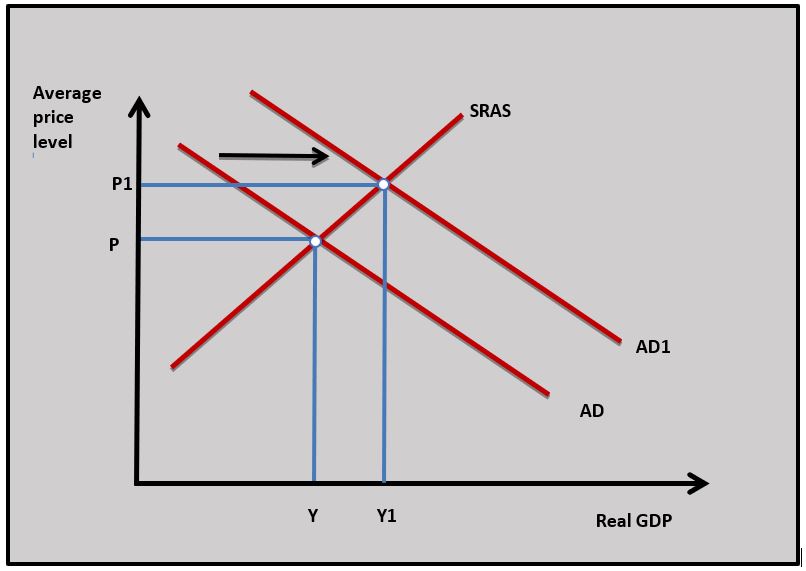 An increase in any one of the components of aggregate demand will increase aggregate demand and lead to a greater value of the output of goods and services in the economy. In the diagram AD increases to AD1 and Y increases to Y1 which represents economic growth.
d. The GDP data in the table is for Country A from 2016 to 2020
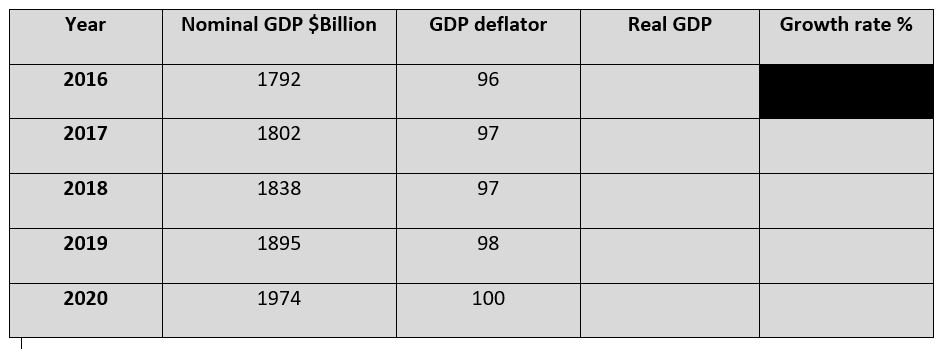
Using the information in the table:
(i) Calculate the real GDP for 2016 – 2020. [3]
(ii) Calculate the growth rate from 2017 – 2020. [3]

(iii) Using a business cycle diagram explain the phase of the business cycle Country A is experiencing in 2017. [4]

In 2017 Country A is experiencing a decrease in real GDP or negative economic growth. This indicates it is in the recession phase of the business cycle which is shown in the business cycle diagram.
Investigation
Many economists look at the rise of India’s economy in a similar way to China. Research the GDP data of India’s economy to see what the similarities are.
Short-run economic growth
The short-run in macroeconomics is the time period when the price level in the economy can change but the cost of factors of production is held constant. Short-run economic growth is determined by changes in aggregate demand and short-run aggregate supply. When there is economic growth in the short run it is described as a change in actual output.
Actual output
The actual output of t he economy is the level of output the economy achieves with its current resource utilisation. It is the value of goods and services produced by an economy with the land, labour, capital and enterprise available. This increase in actual output can also be shown in diagram 3.14 with a movement from F to G inside the production possibility curve.
A rise in actual output in the diagram could be caused by an increase in aggregate demand which shifts from AD to AD1 and this causes real GDP to rise from Y to Y1 in diagram 3.15.
Actual output will increase if:
- There is an increase in aggregate demand and firms produce more and this increases the utilisation of available resources
- Firms experience a fall in production costs which causes the short-run aggregate supply to increase.
Long-run economic growth
The long-run in macroeconomics is the time period when the price level in the economy can change and the cost of factors of production can change. In the long-run economic growth occurs because of an increase in potential output.
Potential output
 The potential output of the economy is the output the economy can achieve if its resources are fully employed. This is the economy’s output from the full utilisation of labour and capital. In reality, the economy will not achieve this level of output because there will always be some unemployed labour and some unused capital. The economy is operating at its potential output on the production possibility curve which is shown in diagram 3.16 at point F on PPC and at point G on PPC1.
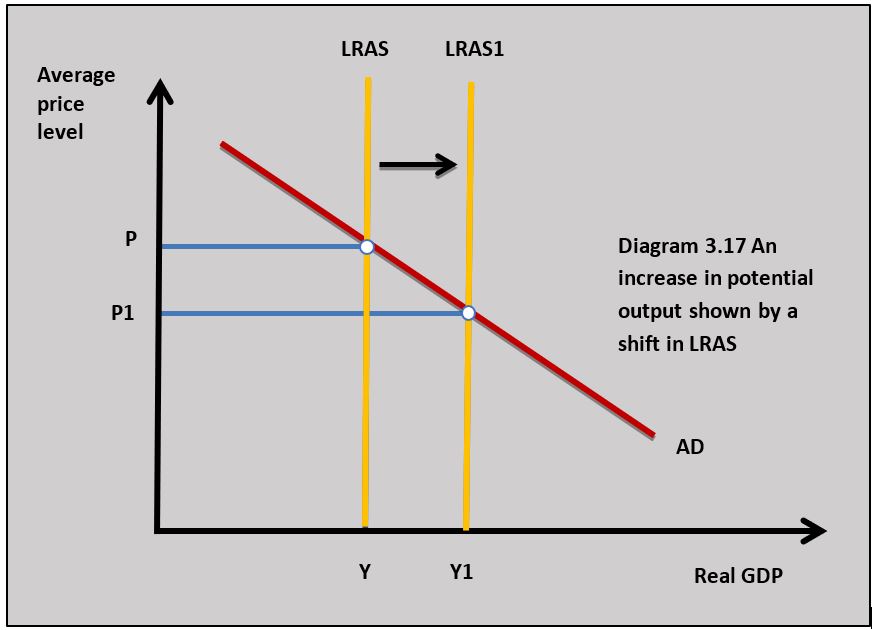
The potential output of an economy will increase if there is an increase in the available resources and an increase in the productivity of the existing available resources. An increase in the potential output which leads to long-run economic growth is shown by the shift outwards of the production possibility curve from PPC to PPC1 in diagram 3.16. It can also be shown by an outward shift in the long-run aggregate supply curve in diagram 3.17.
The following factors could lead to an increase in potential output and long-run economic growth:
- If new natural resources such as oil and gas are discovered or if existing resources can be exploited in a new way, such as the use of genetically modified crops.
- When new labour becomes available in an economy through changes in the birth rate or through immigration.
- An improvement in labour productivity because of an increase in the skill level of the workforce through education and training.
- New investment by firms (factories and equipment) and governments (infrastructure).
- Improvements in the productivity of capital are brought about by technological advances in production such as the use of AI and robots on the production line.
 Research produced by the management consultancy firm, Accenture suggests that artificial intelligence (AI) could double annual economic growth rates by 2035 by changing the nature of work and creating a completely new way for people to work with machines. The impact of AI technologies on business is projected to increase labour productivity by up to 40 per cent by fundamentally changing the way work is done. “AI is poised to transform business in ways we’ve not seen since the impact of computer technology in the late 20th century,” said Paul Daugherty, chief technology officer, Accenture.
We are already seeing how AI has started to change the work done by humans and computers, as well as change how organisations interact with consumers. Accenture’s research demonstrates that as AI develops, it can ‘propel economic growth and potentially serve as a powerful remedy for stagnant productivity’.
Questions
a. Explain the difference between an increase in actual output and an increase in potential output. [4]
- Actual output is the GDP an economy achieves with its current resource utilisation. It is the point of equilibrium national income where aggregate demand equals short-run aggregate supply.
- Potential output of the economy is the output the economy can achieve if its resources are fully employed. This is where equilibrium national income occurs at full employment.
b. Explain how an improvement in technology in an economy can increase its actual and potential output. [10]
Answers might include:
- Definitions of actual and potential output.
- A diagram to show an increase in actual and potential output.
- An explanation that improvements in technology such as AI will reduce business costs and this will cause SRAS to increase the SRAS1 in the diagram and lead to a rise in actual output.
- An explanation that improvement in technology such as AI will mean businesses can increase their capacity to produce. This increases LRAS to LRAS1 in the diagram which leads to a rise in potential output.
Investigation
Research an example of how AI might increase labour productivity in a particular industry.
Benefits of economic growth
Household income
Rising household incomes that result from rising real GDP mean people can afford to buy more goods and services and this increases their material standard of living. The circular flow of income model illustrates how a rise in real output will also lead to an increase in household incomes.
Reduced levels of poverty
Rising incomes for the poorest people in society may lead to a reduced level of poverty as people can afford the goods and services needed to satisfy their basic needs.
Great availability of goods and services
Economic growth means more goods are produced and are available for households to buy. The growth in the availability of televisions, mobile phones, washing machines cars and computers to people on average incomes shows how growth improves people’s material living standards.
Improved public services
Economic growth means firms and households earn more income and pay more direct tax and they also spend more and pay more indirect tax. The higher tax revenue earned by governments because of economic growth means there is more money for them to spend on public services like education, healthcare and infrastructure.
Greater employment
The output of businesses increases as the economy grows which means more jobs are created and this increases the level of employment in the economy.
Costs of economic growth
Sustainability
Economic growth can increase consumption and production negative externalities. Businesses increase output which increases industrial pollution and increased consumption of goods and services by households leads to consumption external costs. This means current economic growth can have a negative impact on the welfare of people in the future.
Income disparities
 As economies grow income disparities often increase as higher-income households experience a rate of increase in income that is greater than the rate of increase in income of lower-income households. Without government intervention to correct inequalities through the tax and benefit system some of the richest countries in the world would have the widest income inequalities.
Inflation
An increase in real GDP that occurs because of an increase in aggregate demand will lead to an increase in the average price level in an economy. This may lead to an inflationary gap and demand-pull inflation when the economy is operating close to or at full employment.
Balance of payments current account deficit
Economic growth caused by rising aggregate demand can lead to a balance of payments deficit. As economic growth leads to rising household incomes people will buy more goods and services and a proportion of them will be imported. The rise in imports can lead to an increased the balance of payments current account deficit.

A UN report suggests Economic growth in Africa is expected to accelerate in the coming years, but the advance is not translating into significantly better living standards across the continent. According to the report, there is a lack of job creation and the broad-based economic development needed to reduce high poverty levels and rising inequality rates in many African countries.
West Africa continues to enjoy the strongest growth on the continent, with an anticipated increase from 6.7% in 2019 to 6.9% this year. The region will continue to attract investment in oil and minerals, especially in Burkina Faso, Ghana, Guinea, Liberia, Niger, Nigeria and Sierra Leone.
Economic growth will be weakest in north Africa, a region racked by political instability, particularly in Egypt, Libya and Tunisia. There are also concerns about the environmental impact of economic growth in African countries with unsustainable land use in agriculture along with industrial pollution from the manufacturing and energy sectors.
Question
Using a real-world example, evaluate the view that economic growth will always lead to improvements in the living standards of the population. [15]
Answers should include: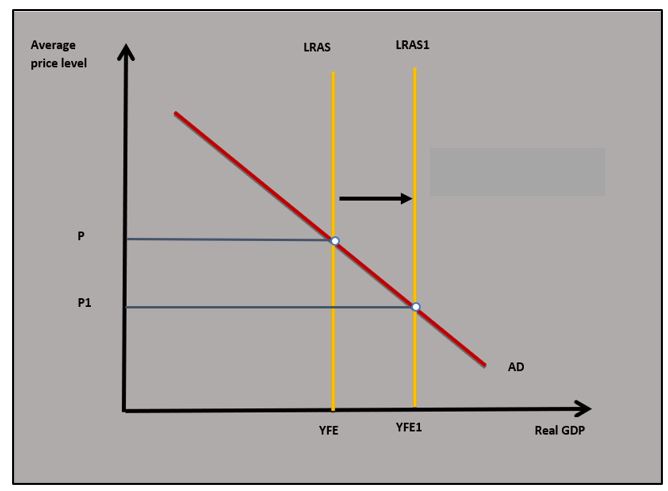
- Definitions of economic growth and living standards.
- A diagram to show economic growth (could be circular flow or AD/AS)
- An explanation that economic growth can lead to the following factors which can improve living standards: rising incomes, falling poverty, reduced unemployment, more investment in infrastructure and better public services such as health and education.
- An example to illustrate the benefits of growth such as an African country from the example above.
- Evaluation might include discussion of the following costs of economic growth that might reduce living standards: negative externalities, unsustainable growth, income inequality, inflation and balance of payments current account deficit.
Investigation
Do some research into a country in Africa to find out the extent to which economic growth is leading to economic development in that country.
One of the consequences of economic growth in the world economy is the rise of the super-rich. In 2010 there were 1,011 billionaires in the world but this figure has more than doubled to 2,095 in 2020. At the same time, the number of people in the world in absolute poverty has also fallen but not at the same rate as the increase in billionaires. In many growing economies the income of the richest in society tends to rise faster than the poorest and this widens inequalities.
If everyone in society is getting better off as the economy grows, does it matter if income inequality is widening?
Using the following data from Country A:
Real GDP 2019
Real GDP 2018
Which of the following is the rate of economic growth of Country A in 2019?
Which of the following is not true about the production possibility diagram?

An increase in potential output causes the PPC curve to shift outwards.
Which of the following is most likely to cause an increase in the potential output of Country X?
An increase in migrant labour in Country X increases potential output by increasing the supply of labour.
Which of the following is least likely to be a benefit of economic growth?
Inequality tends to increase when the economy grows.
Which of the following is least likely to be a cost of economic growth?
Economic growth can lead to rising household income which reduces poverty.
Which of the following is most likely to lead to a rise in economic growth in Country X?
A fall in Country X's exchange rate may increase its exports as its export prices fall and this increases aggregate demand.
Which of the following is the most likely indicator of an oncoming recession?
An increase in saving may reduce aggregate demand and could lead to a recession.
Which of the following is least likely to indicate future economic growth?
An increase in imports reduces aggregate demand and is likely to decrease future economic growth.
Which one of the following is most likely to lead to a rise in a country's potential output in the long term?
An increase in investment can lead to an increase in potential output as productive capacity increases in an economy.
Nominal GDP in Country X increased by 6.9% in one year. Which of the following is true?
A rise in nominal GDP means there is a rise in Country X's money value of output.
 Twitter
 Facebook
 LinkedIn