 IB Docs (2) Team

Unit 1.1: Introduction to Economics
This unit is an introduction to Economics. It starts by looking at the fundamental economic problem of scarcity and develops this by considering how scarcity leads to choice and opportunity cost. The chapter goes on to cover different economic systems that can exist in a country and finishes by looking at the production possibility curve model.
- Economics as a social science
- Difference between microeconomics and macroeconomics
- The economic problem of scarcity
- Unlimited human wants
- Limited factors of production
- Choice
- Opportunity cost
- Economic goods and free goods
- Economic systems of free market capitalism and central planning
- Application of the production possibilities curve model (PPC)
Revision material
![]() The link to the attached pdf is revision material from Unit 1.1: Introduction to Economics. The revision material can be downloaded as a student handout.
The link to the attached pdf is revision material from Unit 1.1: Introduction to Economics. The revision material can be downloaded as a student handout.
What is economics?
Economics as a social s cience
Economics is a social science because it studies human behaviour in relation to the economy. Its concepts, principles and laws are based on empirical (past) evidence. Economists, for example, predict that a fall in the price of smartphones will lead to a rise in the quantity sold because it seems logical based on rational consumer behaviour and there is empirical evidence to support this claim.
Ceteris paribus
Ceteris paribus (other things remaining constant) applies when considering how one economic variable affects another. If, for example, the price of cinema tickets increases, the quantity demanded for them is expected to decrease, assuming consumer incomes and tastes remain the same. Ceteris paribus is important in economic analysis because it allows us to understand how a change in one economic variable causes changes in other variables by excluding other factors that might also affect the change.
Microeconomics and macroeconomics
Microeconomics
Microeconomics is the study of the behaviour of individual markets within the economy, particularly the interaction of consumers and producers. We would, for example, study the growth of the market for electric vehicles or the decline of the coal industry in microeconomic terms.
Macroeconomics
Macroeconomics is the study of the behaviour of the whole economy at a national level. It involves the study of economic issues such as economic growth, inflation, equity and unemployment. Hyperinflation in Venezuela, low unemployment in the United States or high economic growth in Tanzania would all be looked at in macroeconomic terms.
It is important to understand the crossover between macroeconomics and microeconomics, and how effective economic analysis involves an understanding of the interrelationship between the two. Negative economic growth in Argentina last year is a macroeconomic topic that will have microeconomic implications, such as a fall in demand for products in the luxury goods market.
The economic problem
Many economists view one of the central themes of Economics as the study of how society allocates scarce resources to satisfy human wants.
Human wants
Human wants are people’s desire to consume goods and services to derive satisfaction from their consumption. Human wants can be expressed as consumer demand in markets. For example, consumers who buy the music streaming service Spotify want to experience the pleasure of listening to music. A want is a complex mixture of reasons why people buy different products. Consumers who go to an exclusive restaurant want to buy food which is a necessity but for other reasons too. They might go to the restaurant to socialise with others or benefit from the feeling of status generated by going to an exclusive restaurant.
Resources
Resources are the factors of production used to produce goods and services. Resources are often expressed as the factors that determine supply in markets. They include:
Land
Land provides the raw materials used in production, such as oil, timber, copper, etc. In car manufacturing, for example, the plastic, metal and glass used to make a car are made up of different raw materials that come from the land.
Labour
Labour are the workers used in the production of goods and services. An airline, for example, employs pilots, cabin crew, and ground staff, in addition to people who work in marketing, finance and administrative roles.
Capital
Capital is the machinery and equipment used in the production of goods and services. A solar energy provider, for example, utilises solar panels, batteries and transmission infrastructure that provides electricity to its consumers.
Entrepreneurship
 An entrepreneur is a person or people who bring together and manage the factors of production (land, labour and capital) to produce goods or services to make a profit. For example, the entrepreneur Elon Musk has organised the factors of production used to manufacture Tesla cars to make a profit for himself and his organisation.
Scarcity
All the resources used to produce goods and services are in limited supply. This means unlimited human wants are chasing too few resources, which is the central economic problem of scarcity. Gold, for example, is limited in supply which makes it a scarce commodity. The demand for gold comes from its attractiveness as a precious metal for jewellery, its industrial uses and its value as an asset. Gold’s relative scarcity gives it a high price as a commodity. Its current price is nearly $2000 an ounce.
Economic goods and free goods
Economic goods
Economic goods are products produced using scarce resources.
Free goods
Free goods arise because some resources in certain situations are not scarce. Economists consider the air we breathe, sunlight and wind as free goods. Goods and services that are available to consumers at zero price, such as state education, are not free goods because they are produced using scarce resources.
Allocation of resources
The allocation of resources means the distribution of the factors of production to produce different goods and services in an economy. The sale of electric cars, for example, is expected to grow to 40 per cent of all car sales by 2030. This means a movement of factors of production towards the production of electric cars and fewer resources being used to produce petrol and diesel vehicles.
The economic problem and sustainability
One of the key issues of the economic problem is how the use of scarce resources to produce goods and services in the present impacts their availability in the future, as well as the wider implications for the environment. When the Amazon rainforest is cut down to create farmland it causes soil erosion which reduces the amount of productive farmland in the future, increasing its scarcity. Deforestation also has economic costs in terms of climate change, reduced biodiversity and the negative impact on the indigenous community who live in the rainforest.

Hong Kong has the most expensive real estate in the world. It is one of Asia’s leading business and financial centres. The average cost per square metre of an apartment on Hong Kong Island is US$16,000. A $446 million mansion for sale in Hong Kong's exclusive Peak district is one of the most expensive houses ever sold. Renting in Hong Kong is not any cheaper. Family houses in the best areas rent for anything up to US$30,000 per month. Scarcity in the Hong Kong property market is a key reason for its high prices.
Hong Kong is one of the most densely populated areas in the world with a density of 6,659 people per square kilometre, which puts it in the top 3 countries for population density in the world. Lots of people want to live on a relatively small piece of land. It is also a very attractive place to live, with plenty of high-paying jobs, and lots to do and, in its own way, it is a strikingly beautiful city landscape to live in.
Questions
a. Explain the different human wants that create demand for housing in Hong Kong. [4]
People might want to buy housing in Hong Kong for the following reasons: shelter, security, status, investment, near to where they work, close to their friends and family and the pleasure of living in a good location.
b. Outline the four resources used to produce housing in Hong Kong. [4]
The four resources to build housing would be land for building materials, labour to work in construction, capital for building such as cranes and enterprise in the form of construction businesses.
c. Explain how scarcity leads to such a high price of housing in Hong Kong. [4]
Because land is in such limited supply in Hong Kong and demand for housing is so high it makes housing in Hong Kong very scarce and leads to high prices for housing.
d. Explain two consequences of high house prices on individuals in Hong Kong. [4]
High house prices in Hong Kong can have the following consequences for house buyers:
- Housing may be unaffordable for low-income groups
- Housing costs might account for a high proportion of household incomes
- People might be forced to live in lower-cost, poor-quality housing
- People might be forced to live in lower-cost areas of Hong Kong
- It could lead to a rise in homelessness.
Investigation
Research property markets in other major cities to see if scarcity has the same effect on prices.
Choice
Scarcity and choice
Th e central economic problem of scarcity forces different stakeholders in the economy to make choices between alternatives because they cannot get everything they would like to have. An individual might have to choose between going on holiday or buying new clothes, a firm may have to decide not to hire new employees if they invest in new machinery and a government might have to reduce spending on education if it decides to spend more on defence.
Opportunity cost
Opportunity cost is the highest value alternative foregone for the option chosen in a decision-making situation. It arises because of scarcity which forces individuals, firms and governments to choose between alternatives.
The opportunity cost of a decision represents the value an individual or organisation puts on the choice they have made. The more you are prepared to forego to obtain something, the greater the value you put on your choice.
Opportunity cost and different stakeholders
Individuals
This could be where people choose to use their limited income to buy a good rather than spending their money on something else. If someone spends $9 a month on a Netflix subscription then the opportunity cost might be choosing not to use that money to go to the cinema.
Businesses
When businesses use their funds to invest in a project there will be an opportunity cost in terms of an alternative use of the funds. For example, the car manufacturer, Volkswagen, plans to spend 30 billion Euros in the next 5 years on developing electric vehicles. The opportunity cost of this might be using this money to develop petrol or diesel cars.
Governments
Gover nments face an opportunity cost when they are deciding between different items of public expenditure. The US government under Donald Trump, for example, planned to build a wall between the US and Mexico at a cost of $21 billion. The opportunity cost of this might have been spending less on improving America’s roads.
Society
When resources are allocated in an economy, there is an opportunity cost in terms of what else the resources could be used to produce. Japan, for example, plans to increase its provision of electricity generated by renewable sources from 10 per cent now to 25 per cent by 2030. The opportunity cost of this might be less electricity being generated using fossil fuels.
Importance of opportunity cost
Opportunity cost is an important concept in Economics because it allows consumers, producers and governments to assess the implications of the decisions they make in terms of what they are prepared to sacrifice when a choice is made. Opportunity cost allows us to put a value on things. The more we are prepared to sacrifice (the greater the opportunity cost) in a decision-making situation the more value we put on something.
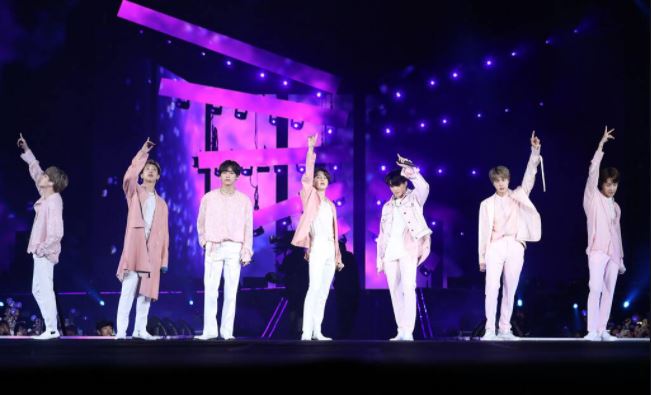 When the Korean pop band, BTS toured the US 2 years ago the average price for a ticket on the secondary market was $478 - over 5 times the official ticket price. BTS's fans have a relatively young age profile and will not be on particularly high incomes. The $478 ticket price would represent a significant sacrifice for them and would be a high opportunity cost. The high opportunity cost for a BTS fan of choosing to buy a ticket and attend one of their concerts shows how much value they put on seeing their favourite artists perform.
Questions
a. Define the term opportunity cost. [2]
Opportunity cost is the highest value alternative foregone for the option chosen in a decision-making situation.
b. Explain how scarcity leads to opportunity cost in the decision to buy BTS tickets. [4]
Scarcity occurs when human wants are greater than available resources. In the case of individuals who want to see a BTS concert the human wants for BTS tickets are extremely high because of the satisfaction, individuals derive from a BTS live performance. The resources available to put on a BTS concert are limited in supply. The high level of wants for BTS tickets relative to their limited supply means the ticket price is high at $478 which means BTS fans have a significant opportunity cost of buying a ticket.
Investigation
Think about an event you or someone else in your class was prepared to make a significant sacrifice to attend.
What was the opportunity cost of attending the event?
Economic Systems
Economic systems and the allocation of resources
An economic system is a way in which society is organised and governed, and how this affects the resource allocation in the economy. Economists often consider the allocation of resources by an economic system in terms of 3 questions:
What goods and services are produced?
This means what goods and services are available to a country’s population such as consumer goods like cars and mobile phones, to wider services such as health and education.
How are goods and services produced?
This question is about ownership of the factors of production used to produce goods and services in the economy. This is normally looked at in terms of private businesses and state-managed enterprises.
Who the goods and services produced are distributed to?
The distribution of goods and services is often related to income distribution in terms of the income individuals receive. For example, the households that earn the highest incomes in society can afford to buy (get distributed) the most goods and services.
Free market economies


What goods and services are produced?
In a free market economy, consumer sovereignty decides what goods and services are produced. Consumer sovereignty refers to the ultimate power of the consumer in the economy to determine resource allocation. If consumers demand a particular good resources will be allocated to produce the product as entrepreneurs see the opportunity to make a profit from selling it to consumers. This process takes place through the price mechanism which is the communication system that exists between consumers and producers in a free market economy.
Consumers, for example, want to go out and drink high-quality coffee and eat food in an attractive café environment. This has probably been the driving factor leading to the growth of the coffee shop market which is supplied by profit-making producers like Costa Coffee, Starbucks and Café Nero.
How are goods and services produced?
Goods and services are produced by firms that are owned by individuals (known as private capital) who look to make a profit by producing those goods or services. Advocates of free market economies argue that competition between private firms means that consumers get a wider choice of goods at lower prices relative to more state-controlled economic systems.
Producers in the sportswear market such as Adidas and Nike manufacture and sell their goods globally. Competition between these two producers, along with other firms in the market, gives consumers the choice of different products to buy at affordable prices.
Who the goods and services produced are distributed to?

Goods and services are distributed in the economy through the price mechanism which acts as a rationing system. People who are willing and able to pay the price for the products available in the market will obtain them. The higher an individual’s income, the more goods and services they can buy. In a free market economy, an individual’s income is determined by the demand and supply for the work they do.
Sports stars like Cristiano Ronaldo and Serena Williams are paid high wages partly because there is such a limited supply of people with that level of talent in their respective sports, meaning that there is high demand for their services. People are willing to pay high prices to watch them play live and through television subscriptions. They also help to sell lots of sportswear and other products.
Evaluation of free market capitalism
Empirical evidence from the last 100 years shows many of the benefits free markets can bring to societies whose economies are based on capitalist principles. The economic success of the United States is often held up as a model of this and in more recent times the adoption markets in China have shown how it can lead to rising prosperity in the population in a relatively short period of time.
Free market capitalism does, however, have significant weaknesses in the form of market failures:
- Externalities
- Merit and demerit goods
- Public goods
- Common pool/access resources
- Asymmetric information
- Monopoly
- Inequity
These market failures are covered in Unit 2.8 of this textbook. Unit 2.8(1): Market Failure – Externalities
Command or planned economies
In planned or command economies the allocation of resources that takes place through the interaction of consumers and producers is replaced by the state. The private ownership of the factors of production is transferred to the government.
What goods and services are produced?
In a planned economy the government or planning authority determines what is produced based on what they believe the people of their country want. In many of the Eastern European countries that adopted a command-type economic system for several decades in the 20th Century, the planners would decide what to produce based on household needs. This could be from the quantity of milk to the number of shoes they forecast the population would need.
How are goods and services produced?
State-managed organisations produce goods and services in a command economy. Once the planners have forecasted the goods and services they need to produce, they then set production targets for industries which become targets for individual producers to achieve. The planners in the former Soviet Union would set industrial output objectives for clothing, and the state-managed enterprises would have to achieve these objectives. Producers were not incentivised by profit but by the desire to satisfy the planners.
Who the goods and services produced are distributed to?
This was one of the most important aspects of the command system for former communist countries in Eastern Europe and Asia. A primary aim for these societies was equality in the distribution of goods and services. This could be expressed as one of socialism’s aims of greater income equality. Countries like the former USSR would focus their distribution of goods and services based on need rather than want. Everyone, for example, in the USSR should have a place to live, access to necessities such as food and clothing, along with the provision of education and healthcare for all.
Evaluation of planned or command economies
Empirical evidence suggests relatively poor economic performance in countries that have adopted a planned economic system such as in Eastern Europe up until the late 1980s. Nations like the former USSR, East Germany and Poland experienced a very slow improvement in household incomes and the overall quality of life of their populations. The weaknesses of planning can be looked at in three ways:
- It is very difficult for a government to efficiently plan the billions of resource allocation decisions that take place every day in an economy.
- Without the incentive to earn high incomes and profits individuals in a planned system are not as motivated to work as hard and innovate in the way they might do in a market system.
- Government-managed systems involve considerable bureaucracy in the management of state-run enterprises which reduces their efficiency.
- Economic decision-making by governments always involves politics and political decisions were often taken instead of the right economic decisions.
Mixed economies
In reality, all economies are a mixture of the public (government) and private sectors. It is just the degree of planning and free market influence on the allocation of resources that differs between countries. The decline of command economic systems in Eastern Europe and Asia in the second half of the 20th century has seen a greater influence for the market in many countries.
Different countries have varying levels of state and private sector involvement in the allocation of resources. The Nordic countries of Norway, Sweden, Denmark and Finland have relatively high proportions of state involvement in their economies, whereas countries like the US, UK and Australia have a greater emphasis on the market. That said, UK government expenditure is still nearly 40 per cent of GDP.
In mixed economies, governments are normally involved in the provision of public goods (police, defence and infrastructure) and public services like health and education. Private firms make up the other commercial sectors of the economy. It should be noted, however, that those private companies are still involved in public services such as healthcare and education.

Research into the Soviet Union in the 1970s, ten years before the end of communism in Eastern Europe, showed the following observations:
- Only two-thirds of Soviet families had a fridge in their home compared to over 90% in Western Europe.
- Soviet households had to wait years to buy consumer goods like fridges, cookers and televisions.
- Five million households in the USSR had cars compared to 100 million in the US.
- Life expectancy fell in the USSR during the 1960s and 1970s.
- 15% of the population lived in areas with pollution 10 times normal levels.
- Using the US measure of poverty over 50% of the USSR population was poor compared to 12% in Western Europe.
- A winter coat in the USSR cost a whole month’s wages.
Questions
Outline the economic system that existed in the USSR in the 1970s. [4]
The USSR used a command economic system where the central planners (government) decided what was produced, state-managed enterprises produced goods and services and the income from the output produced was distributed based on need.
Explain two disadvantages of the economic system adopted in the USSR in the 1970s. [4]
Two disadvantages of central planning for the USSR from:
- It is difficult for a government to efficiently plan the billions of resource allocation decisions
- The lack of incentive for individuals to earn high incomes and profits
- Bureaucracy in the management of state-run enterprises
- Political decisions are taken instead of the right economic decisions.
Production Possibility Curve (PPC)
Definition of production possibility curve
A production possibility curve is a model that shows the maximum relative amounts of two goods a country can produce with a given availability of resources at a point in time.
Economic models are used by economists to help them understand how the economy works. They can be used to explain what has happened in the past and as a basis for making predictions about the future. Production possibility curves are a very simple model that can be used to illustrate the basic economic concepts of scarcity and opportunity cost. The most advanced computer-based models are used by governments and financial institutions to make forecasts about the changes in the economy.
The production possibility curve diagram
The PPC model is based on the relative quantities of any two goods that can be produced by an economy. General markets, such as capital goods and consumer goods, can be used, or more specific markets such as sugary soft drinks and bottled water. The key purpose of the model is to show the relative output of the two goods produced using scarce resources.
In this example, an economy can produce different relative quantities of wine and sugar from its available resources, and this is shown by the PPC in diagram 1.1. The pattern of consumer demand in the economy means that it can produce 160 units of wine and 70 units of sugar simultaneously, and this is shown by point F on the diagram.
Production possibility curves, scarcity and opportunity cost
The PPC curve shows how the output of 2 goods is limited by the scarcity of available factors of production in an economy at a certain point in time. Scarcity means producing more of one good on the PPC leads to an opportunity cost in terms of the other good produced.

Opportunity cost is one of the key concepts illustrated by the model. In diagram 1.1, if the economy produces 200 units of wine it forgoes the production 100 units of sugar. Producing 100 units of sugar would mean giving up the production of 200 units of wine. By producing at point F on the PPC the country produces 160 units of wine with an opportunity cost of 30 units (100 units – 70 units) of sugar. At point F it also produces 70 units of sugar, so there is an opportunity cost of 40 units (200 units – 160 units) of wine.
The shape of the production possibility curve
Increasing cost PPCs
Most of the theory covered in this text uses increasing cost PPCs that are curved outwards because as more resources are allocated to the production of a good, the opportunity cost in terms of the other good foregone increases. This is because some resources are better suited to the production of one good than they are to another. In the PPC in diagram 1.1, increasing the production of wine means an increasing opportunity cost of sugar because some resources are better suited to wine production than sugar production. For example, as more land is allocated to the production of wine from sugar the land will be less and less productive for each extra unit of wine production. So for each extra unit of wine produced, the opportunity cost in terms of sugar production given up gets greater and greater.
Constant cost PPCs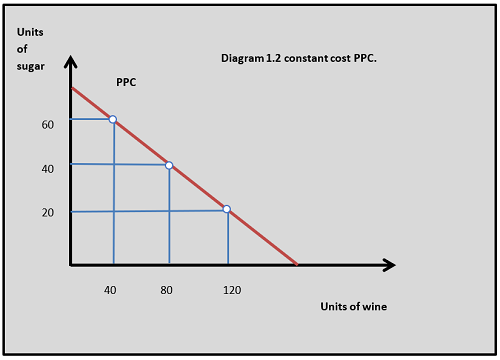
For some aspects of economic analysis, it is easier to use the constant cost PPC curve, where the PPC is a straight line and the opportunity cost stays the same as the output of one good increases and the other decreases. In diagram 1.2 the PPC for wine and sugar production is linear and the opportunity cost remains the same as resources are switched from sugar to wine production. The constant cost PPC model is often used when analysing specialisation in international trade.
Production possibility curves and economic efficiency
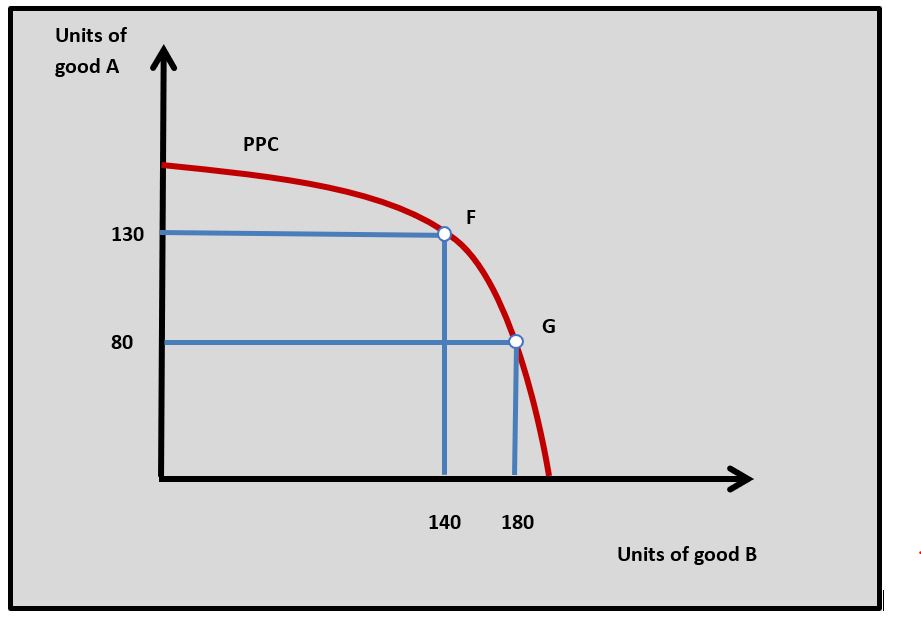
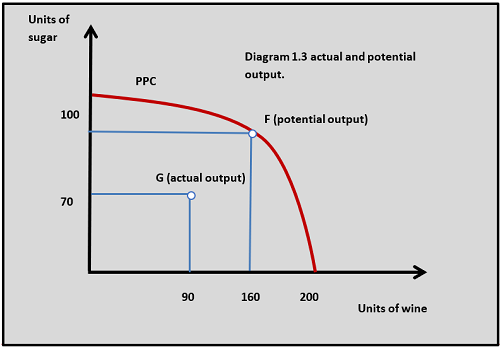 Productive efficiency occurs in an economy when all available resources are being used and they are achieving the highest possible output. This means that the labour force is employed and there is full utilisation of available capital in the economy. All points on the production possibility curve represent a productively efficient use of resources. This is called the potential output of the economy. In diagram 1.3, point F is a productively efficient level of output.
In reality, all economies produce within their PPC because there is always some unemployment and capital that is not being utilised. For example, in Japan last year the rate of unemployment was 2.2 per cent and the lowest it had been in the last 100 years was 1 per cent. The point within the PPC that an economy produces at the current point in time is called actual output. This is shown in diagram 1.3 at point G.
Growth in production possibilities
 One of the key applications of the PPC model is to illustrate growth in production possibilities where the potential output of an economy grows over time. As potential output increases, the PPC shifts outwards and the economy can now produce more of both goods in the PPC diagram. This is shown in diagram 1.4. In the diagram, PPC shifts to PPC1 and potential output increases from point F to point G. This means that the potential output of the economy increases from 70 units of sugar to 85 units and from 160 to 180 of wine.
The growth in production possibilities often occurs because of an increase in available resources or existing resources become more productive. This could be because of greater use of capital, improvements in technology and a more educated labour force. Tanzania, for example, was one of the fastest-growing Economies in Africa last year. One of the key drivers of this is foreign direct investment (FDI) and significant infrastructure improvement, both of these factors would increase Tanzania's potential output.
 America’s military budget has grown for five consecutive years. Republican lawmakers have pushed defence spending well above 3 per cent of GDP. At the same time, the administration has cut domestic programs, such as education. Under its budget plan, the United States is expected to spend more on its military in 2021 than at any point since the Second World War.
Government spending decisions represent clear opportunity cost situations. The administration’s decision to increase defence spending can be viewed in terms of the opportunity cost of fewer funds available for expenditure on education. The reasons for the US government’s decision to spend more on defence may well be viewed in terms of the greater political value it currently places on increased defence spending relative to education.
Questions
a. Outline what a production possibility curve shows. [2]
A production possibility curve is a model that shows the maximum amount of two goods a country can produce with a given availability of resources at a given point in time.
b. Using a PPC diagram explain the effect an increase in US government spending on defence might have on education. [4]
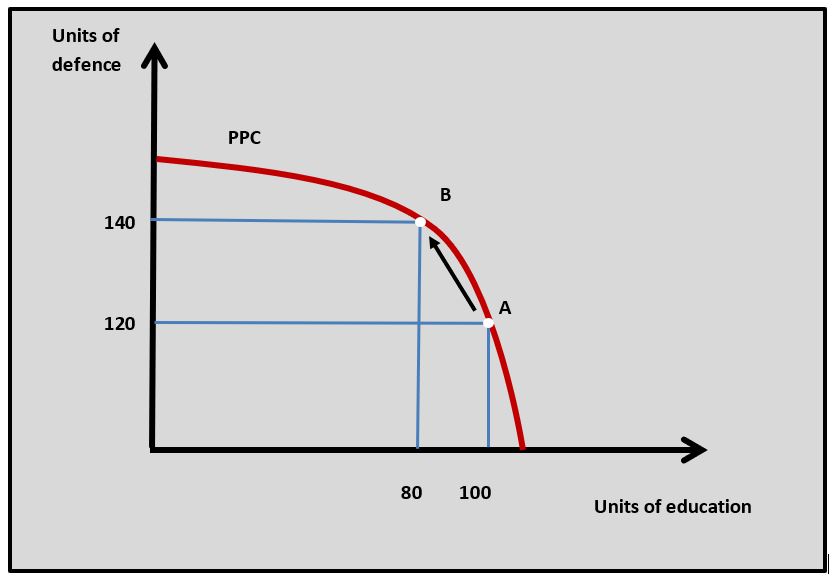 The PPC diagram shows how greater US spending on defence means more resources are allocated to defence goods. With scarce resources in the US economy, this would mean fewer resources being allocated to education goods. This means an increase in resources allocated to defence goods from 120 to 140 units would lead to an opportunity cost of education goods of 20 units (100 units - 80 units).
c. Using the production possibility curve model, explain the concepts of scarcity and opportunity cost in the allocation of resources in national defence. [10]
Answers might include:
- Definitions of scarcity, opportunity cost, PPC, and allocation of resources
- An explanation of scarcity as it relates to national defence in terms of the limited land, labour, and capital to produce defence goods such as tanks, missiles and ammunition.
- An explanation that the allocation of resources to defence can be looked at as the amount of resources allocated to defence production in the economy.
- The explanation is that the limited resources used to produce defence goods lead to choice and opportunity cost. This could be an opportunity cost in terms of resources allocated to education that are foregone if more resources are allocated to defence.
- An example of opportunity cost from the perspective of the US government. If the US government increases the resources it uses for defence then the highest value alternative might be fewer resources being allocated to healthcare.
- PPC diagram to show more resources being allocated from healthcare to defence in the US leading to an opportunity cost in terms of healthcare.
Research another government decision that involves an opportunity cost.
Discuss with your class the economic consequences of the US government's decision to prioritise military spending.
Which of the following is not a factor of production?
Money is not a factor of production - the others all are.
Which of the following is a free good?
A good is free when it exists without the use of scarce resources.
Which of the following is not a characteristic of a pure free market economy?
The only role for the government in a pure free market is to provide a legal framework to support trade.
Which of the following will increase potential output and cause the PPC of a country to shift outwards?
As technology improves in the economy the output from existing resources can be increased.
Using the PPC diagram, which of the following is correct?
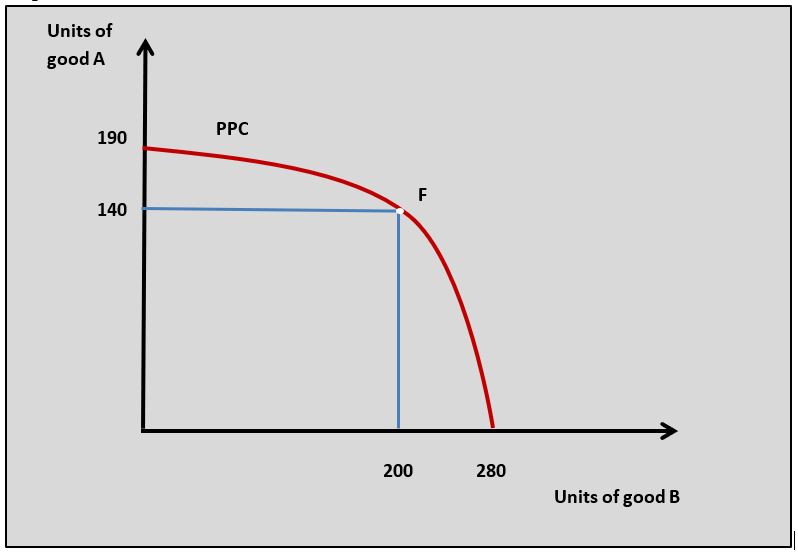
The opportunity cost of producing 200 units of good B is (190 - 140) 50 units of good A.
Using the PPC diagram, which of the following is not true?
This economy could produce inefficiently and be inside the PPC.
Which of the following is the most accurate definition of opportunity cost?
Opportunity cost is the highest value alternative given up to get the option chosen in a decision-making situation
Scarcity of resources in a market economy means that:
Because of scarcity consumers and producers have to make choices and this leads to an opportunity cost.
Economics is a subject that is focused on the study of:
Which of the following is true when scarce resources are allocated efficiently?
Resources are allocated efficiently when it is not possible to increase the output of one good without there being an opportunity cost in terms of the reduced production of another good.
 Twitter
 Facebook
 LinkedIn