 IB Docs (2) Team

Unit 2.2: Supply
 Introduction
This is the second part of the section on market equilibrium. I find that it is better to cover both demand and supply at the same time, rather than focus on each separately as the two concepts come together to form the market equilibrium. Specifically for a market to exist we need to have consumers willing and able to purchase the good or service but also producers who are also willing and able to supply that product. Again the key term here is willing and able. Many individuals may be willing to produce something but are they able?
Supply is fundamentally different to demand because the relationship between the selling price and the amount that producers are willing and able to supply is directly related. In other word, as the price rises then the amount that producers will supply will also rise. Once both demand and supply have been introduced then it makes sense to cover both concepts in greater depth.
Enquiry question
Why is there a direct (positively sloped) causal relationship between the price and quantity supplied for a good or service, ceteris paribus. What are the non-price determinants of supply?
Lesson notes
Lesson time: 1 hour
 Lesson objectives:
An understanding of the direct causal relationship between price and quantity supplied, represented by the supply curve.
An understanding of the factors that result in a change supply / shift the supply curve.
The relationship between an individual producer’s supply and market supply.
Teacher notes:
1. Beginning activity - watch the short video which includes related questions, designed to introduce the concept of supply. (10 minutes)
2. Activity 2 - contains a short practise exercise. (10 minutes)
3. Processes - technical Vocabulary - the students can learn the key concepts through the class handout, which can be printed off and distributed. (10 minutes)
4. Assessment - watch the video and question activity included. I feel that practising drawing the diagrams is an effective way for students to learn the concepts. (20 minutes)
5. Final reflective activity includes an example of a paper 1 type question and additional information on a relevant paper three question. (10 minutes)
Key term:
Supply - the quantity of goods and services that producers are willing and able to produce at a given time, for a given price, ceteris paribus.
The class handout is available as a PDF file at: ![]() Supply
Supply
1. Beginning activity
Start by watching the following short video which explains the concept, before completing the questions which follow:
Question:
You are the production manager of Shell oil company and it is your job to decide on the level of production that you would like the business to aim for. Based on the video that you have just watched outline the possible factors that may influence your decision?
Possible responses include
- the costs of production (the higher these are then the lower the incentive to increase production)
- the opportunity cost of production (the cost of producing other options i.e. alternative products)
- the availability of technology used directly or indirectly in the production process
- expectations of future demand ∕ price levels
- likely government intervention levels (for instance the level of potential support for electric cars, either now or in the future).
Activity 2
Imagine that you set up a business selling cup cakes in your current school. How many cakes would you be willing and able to supply at the following prices?
$1, $1.5, $2, $2.5, $3, $3.5, $4
Plot this on a diagram.
Hint:
The exact figures are not relevant but students should note that the number of cupcakes they may be willing and able to supply should rise as the selling price rises.
 Activity 3
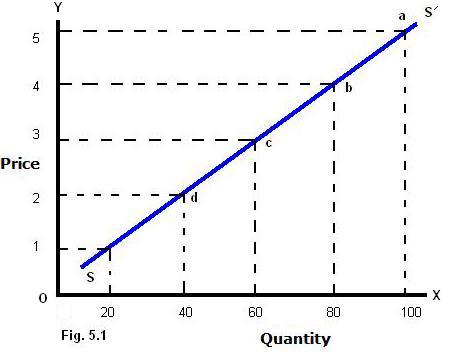
(a) The diagram to the right illustrates a supply curve for a good or service. Explain why the supply curve slopes upwards from left to right.
The more it costs to produce a good or service then the less producers are willing and able to supply the product. For example, on the diagram at a price of 1$, the firm is only prepared to produce 20 units. As the selling price rises then the firm is progressively willing and able to produce more.
(b) Why does the supply for a product require producers to be willing and able to produce the product at each given price?
A business may be willing to increase production when its price rises but it must also possess the required financial and production facilities required to do so - sometimes this is not possible.
Activity 4
Watch the following video, focusing on the quantity supplied of milk in a diary farm, before completing the questions that follow.
Questions:
Using the diagrams in the handout, illustrate the impact on the market for milk under the following circumstances:
1. The market for milk after the government places a sales tax on animal feed?
A fall (left shift) in supply
2. The market for milk following a successful advertising campaign by diary farmers?
A rise (right shift) in demand
3. The market for milk if demand for chocolate and other diary products rises?
A rise (right shift) in demand
4. The market for milk if fuel prices fall?
A rise (right shift) in supply
5. The market for milk following a rise in minimum wage in the country?
A fall (left shift) in supply and also likely a rise (right shift) in demand
6. The market for milk following a rise in wage levels?
A rise (right shift) in demand and a left shift in supply as production costs increase
 5. Link to the examination
Examination questions on supply can also be found in each of the three exam papers, with candidates required to apply the theory of supply to a given situation. Examples of typical questions include:
Paper 1 (part A)
Explain using a relevant diagram why an increase in the price of a good or service will lead to an increase in the quantity supplied but an increase in supply leads to a fall in selling price.
Hint:
This question illustrates the difference between a shift in supply and a movement along the supply curve. This can be illustrated by using two supply curves. On one illustrate the impact of an extension in supply (a rise in quantity supplied caused by an increase in price). On the next draw a right shift in supply to illustrate a rise in the supply of a product and the resulting fall in price.
Paper three (HL only)
On paper three candidates may be asked to illustrate the impact of a change in market conditions on the supply for a good or service, e.g.
i. Illustrate the impact on the market for a product following a government subsidy placed on the good or service?
i. This would be indicated by a shift in supply to the right.
 Twitter
 Facebook
 LinkedIn