 IB Docs (2) Team

Perfectly elastic / inelastic supply curves
 Introduction
This is a continuation of PES theory and looks at the most extreme types of supply elasticity - perfectly elastic and perfectly inelastic supply. Perfectly inelastic supply is the easier of the two to explain. Why not start your class with a simple question, asking your students if they can think of any examples of either. A further advantage of starting your lesson off with this question is that it may incite a response such as 'essential drugs or water, because you always need those regardless of the price'. This means that like many IB students the respondent has confused PED with PES. You will be able to take this opportunity once again to explain the difference.
The lesson finishes with some simple questions for your class to compete.
Enquiry question
What are the characteristics of goods and services with extreme types of supply elasticity - perfectly elastic and perfectly inelastic supply.
Teaching notes:
Lesson time: 45 minutes
Learning objectives:
Explain, using diagrams and PES values, the concepts of perfectly elastic supply and perfectly inelastic supply.
Lesson notes:
1 Opening activity - begin the lesson with the introductory exercise (5 minutes)
 2. Processes - technical vocabulary - the students can learn the vocabulary and the relevant concepts by studying the handout that you will distribute. This contains practise questions and should take no longer than 10 minutes to read.
3. Processes - complete the six activities attached to the handout. This should take around 30 minutes and includes a revision activity.
4. Activity 6 is a revision exercise.
5. Activity 7 is a homework exercise, which can also be completed in class. It contains a paper one (section B) type question that I wrote myself, making it suitable for homework because your classes will not be able to find the mark scheme on line.
.jpg) 1. Beginning activity
1. Beginning activity
Take out a piece of paper and draw two supply diagrams - one perfectly elastic and one perfectly inelastic. Can you think of any examples of products that may be either perfectly elastic or perfectly inelastic with respect to supply.
Key terms:
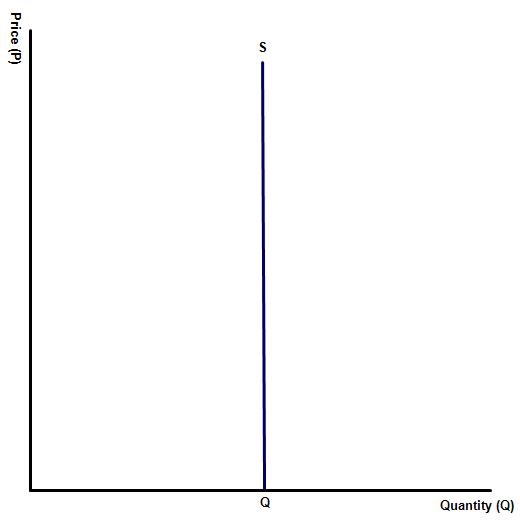
Perfectly inelastic supply - a product with a PES of 0, meaning that following a change in the price of the good or service there would be no change to quantity supplied.
Perfectly elastic supply - a good or service with a PES of infinity. At the market price, quantity supplied will be limitless but at any other price the quantity supplied will fall to 0.
Range of PES values - 0 to infinity
The activities are available as a class handout at: ![]() PES elasticity
PES elasticity
Activities
1. The diagram to the right illustrates a good with a PES of 0. What products would have perfectly inelastic supply?
Examples of perfectly inelastic goods include tickets for a sports stadium or a music concert, where there are a fixed number of seats, regardless of the price. A small number of goods are also sold as limited edition goods, meaning that a fixed number of the units are produced each year. An example of this might be a small range of luxury cars.
 Activity 2
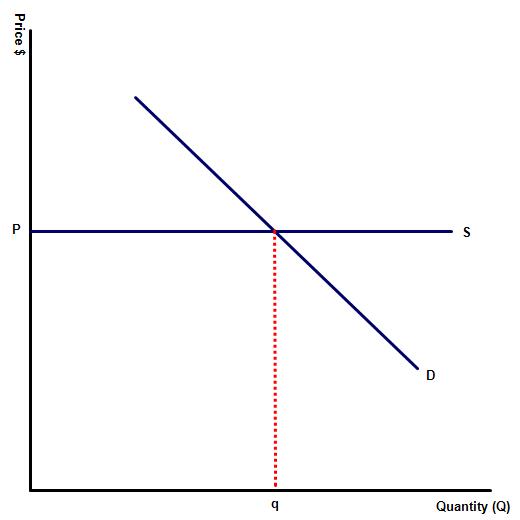
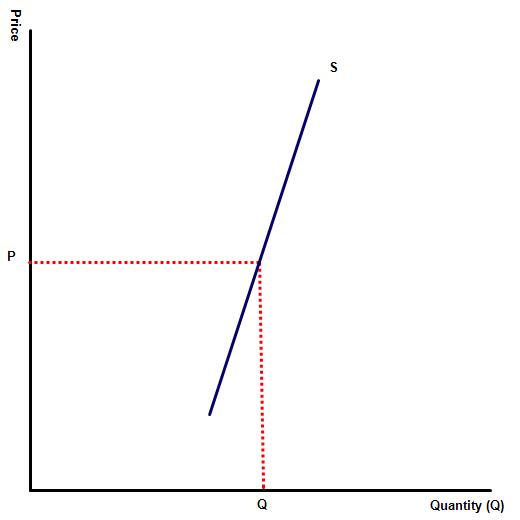
Diagram 2 illustrates a perfectly elastic supply curves.
(a) What is PES value of goods with perfectly elastic supply?
Perfectly elastic supply curves have a PES of infinity. At the market price, quantity supplied will be limitless but at any other price the quantity supplied will fall to 0.
(b) Are there any examples of goods with a PES of Φ?
In the real world possibly not but in economic theory it is possible. For a market to be perfectly elastic in supply you would need a market with several competitors, producing identical products, all having the same production costs. So for instance if we had several firms growing oranges. Production costs per kilo might be say $100. Therefore the price cannot drop below $100. If the price falls below $100 per kilo, even to $99.99 then the supply will end (% change will be infinite) because it is not a viable product. Similarly at a selling price of more than $ 100 the supply is virtually limitless as the oranges grow on trees and so are easily available.
Activity 3
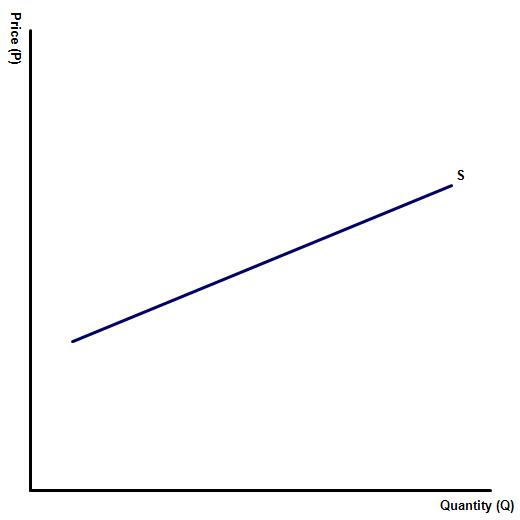
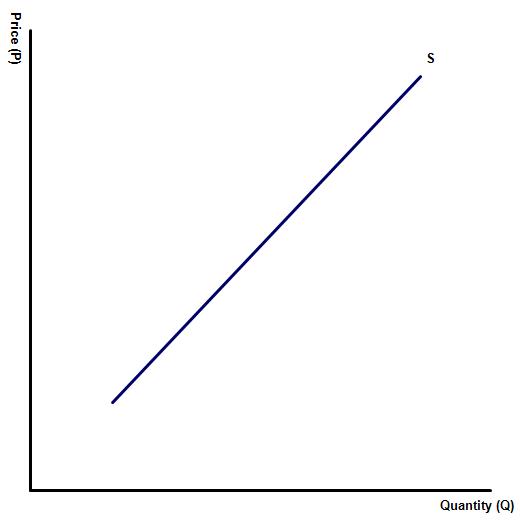
Using the following axis, draw supply and demand diagrams, showing the PES and PED elasticity for the following goods – ski equipment, bottled water, diamonds, tickets for the FIFA world Cup final, coffee, second hand cars?
![]()
![]()
![]()
![]()
![]()
![]()
-1.jpg "image: https://www.theodysseyonline.com") Ski equipment - the diagram would be represented by a PES and PED elastic curve.
Ski equipment - the diagram would be represented by a PES and PED elastic curve.
Bottled water - PES elastic but PED inelastic.
Diamonds - PES inelastic and PED elastic (perhaps even upward sloping as diamonds are considered veblen goods).
Tickets for the FIFA world Cup final - perfectly inelastic supply and highly PED inelastic.
Coffee - PES inelastic and inelastic PED elasticity.
Second hand cars - PES elastic and unitary PED elasticity.
.jpg) Activity 4
Activity 4
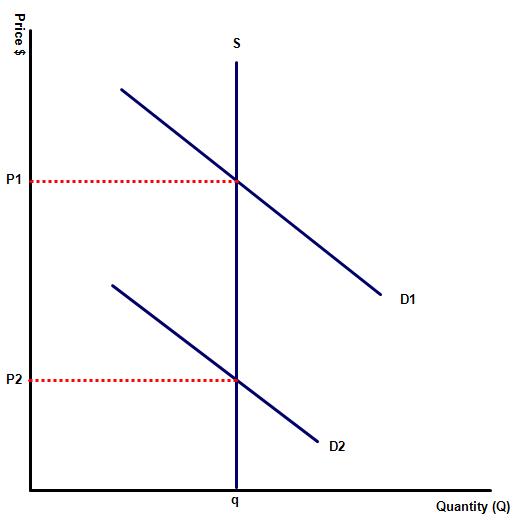
During the 2012 Olympics tickets to the premium events were heavily over subscribed. This was particularly true for the main athletic events, where tickets were sold on the black market for three or four times their face value. The government response was to impose strict limits on ticket sales, with customers limited to a maximum of two tickets per customer.
(a) Draw a supply and demand diagram for the premier athletic events, illustrating the impact of the maximum 2 ticket per customer policy.
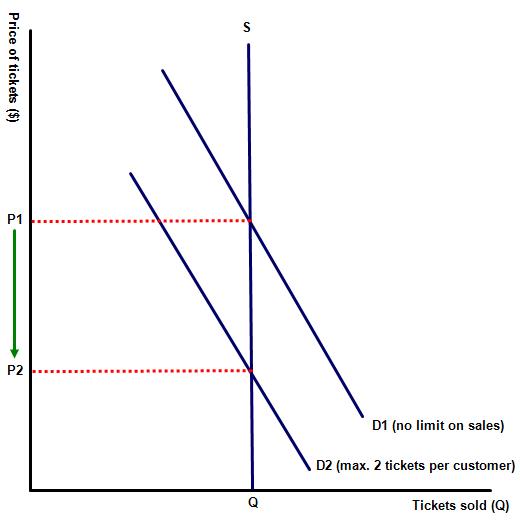 The equilibrium price for tickets in an unregulated market is represented by price (P). Following the strict rationing of tickets the new equilibrium price is represented by P2.
2. Describe the benefits and costs of the above policy. Who benefits and who loses out from restricting sales to 2 tickets per person?
The policy was effective in ensuring that more sports fans were able to access the premier events at an affordable price. The This policy also reduced black market sales, with individual agencies unable to buy up large blocks of tickets, before selling them on at an inflated price.
Such a policy also had its critics, however, as families found it difficult to obtain sufficient tickets to take their children to events, and groups of friends also found the policy restrictive. Lastly, the tournament organisers also missed out on the additional revenue which they could have obtained from allowing market forces to determine the price. This loss of revenue is represented by P1 - P2 x 0Q.
3. What other policies could the Olympic organisers have implemented to reduce the excess demand for certain events?
Policies include:
- allowing market forces to determine the selling price
- lottery system of allocating tickets
- significant waiting times for customers to purchase tickets
- selling some premier events as a package with less popular events, to force customers to go to more events, rather than cherry picking the most popular.
 Activity 5: Black market sales for premier events
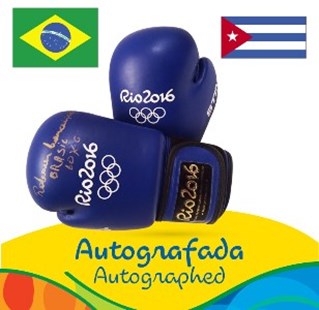
In the run up to the 2016 Olympic ceremony, Brazilian police broke up a black-market ring that authorities believe had tried to illegally sell more than 700 Olympic tickets at exorbitant prices.
The suspects bought the tickets legally, then used social media sites in an attempt to illegally resell them, said Donovan Ferreti, head of ticket sales for Rio 2016.
“In one case, a ticket was sold for 10 times the original price from our site,” Ferreti said. The illegally sold tickets had been blocked and cannot be used, he added.
Question
To what extent is the establishment of a black market for premier sports events an inevitable consequence of events where the supply is fixed?
While there were concerns in the run up to the event that tickets would go unsold and stadiums and other sports arenas left half empty, certain events were always likely to be heavily oversubscribed - the football and beach volleyball games involving the host nation as well as tickets for the opening event. With tickets being sold on the black market for 10 times the official price it is clear that the games organisers could have charged a much higher price for the opening ceremony. Had they organised a bidding system then there would have been no profit to be made from establishing a black market market, as consumer surplus would have disappeared. As it was there was always likely to be ticket touts able to profit from the ticketing arrangements. Had the organisers also been able to hold the opening ceremony in a much larger venue then ticket sales could have expanded to satisfy demand but this was impossible in an arena with a fixed supply of exactly 74,738 seats open to the public.
Activity 6: Review exercise
Complete the table, filling in the missing blanks
Value | Description | Diagram | Example of product |
PES=0 | Perfectly inelastic |
| Stadium or concert tickets, limited edition products |
Between _ and _ Between 0 and 1 | PES inelastic |
| Most primary products or manufactured goods which use very scarce resources |
PES>1 | PES elastic |
| Most manufactured products |
PES= PES=1 | PES unitary |
| Handmade manufactured goods e.g. bespoke clothing |
PES=Ѡ | Perfectly elastic supply |
| Unclear, perhaps none |
7. Homework question
Paper one, section (b) type
A stadium has a seating capacity of 50,000. Ticket prices for the most popular events are sold out months in advance. Tickets for these events are subject to a maximum price, well below the equilibrium price level. Using an appropriate diagram, discuss the consequences of this decision. [15 marks]
Guidance on how to complete this question
This response requires two different pieces of economics knowledge. The first is the shape of the supply curve which should be 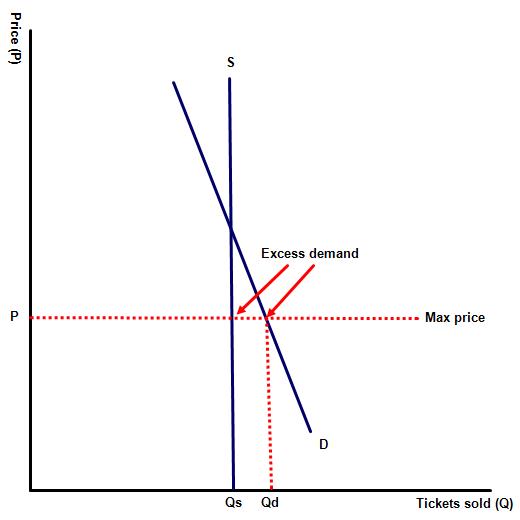 perfectly inelastic. This is the fixed supply of tickets available in the stadium. The second is the impact of a maximum price, imposed below the equilibrium level.
Key terms to define: Equilibrium price and maximum price
In completing this question responses should also include the following:
An appropriate diagram showing the market for tickets at this venue. Responses should note that with the number of seats available for the venue fixed, the supply curve should be drawn as a vertical line and that Qs represents the number of seats in the stadium. The imposition of a maximum price, set below the equilibrium level, means that tickets for this concert are over supplied. This should be shown on the diagram by Qs - Qd.
Responses should then continue their response with an explanation of the likely consequences of the maximum price. For example:
- a ballot / rationing system for allocating tickets
- tickets allocated on a first come first serve basis
- significant waiting times for customers to purchase tickets
- sales of the tickets through unofficial markets
- tickets allocated to members only / VIP members.
Candidates should also include the strengths and weaknesses of introducing a maximum price for this concert venue. This should include the impact on the following stakeholders:
- the concert venue
- the musicians
- fans of the band fortunate enough to secure a ticket
- music fans who miss out a ticket for this concert.
Question available as a PDF at: ![]() Stadium question
Stadium question
The mark scheme is available as a PDF at: ![]() Stadium mark scheme
Stadium mark scheme
 Twitter
 Facebook
 LinkedIn