 IB Docs (2) Team

Minimum price
 Introduction
This lesson focuses on the second part of price controls, when a government imposes a minimum price on a good or service.
Enquiry question
The impact of a price floor on the market for a good or service? Why do governments set a minimum price for certain products?
Lesson notes
Lesson time: 1 hour
 Lesson objectives:
Explain why governments impose price floors, and describe examples of price floors, including price support for agricultural products and minimum wages.
Draw a diagram of a price floor, and analyse the impacts of a price floor on market outcomes.
Examine the possible consequences of a price floor, including surpluses and government measures to dispose of the surpluses, inefficient resource allocation and welfare impacts.
Discuss the consequences of imposing a price floor on the stakeholders in a market, including consumers, producers and the government.
Calculate possible effects from the price floor diagram, including the resulting surplus, the change in consumer expenditure, the change in producer revenue and government expenditure to purchase the surplus (HL only).
Teacher notes:
1. Beginning activity, start with the opening question and video, which should take around 10 minutes. I will often start this particular class by asking my students to draw a supply and demand diagram for any product and then place a minimum price on the diagram. In my experience relatively few IB students will automatically think to add this above the equilibrium level, so will need your guidance on this.
2. Processes - technical vocabulary - The students learn the content reading the class handout, which you can print off and handout to your class. Allow 15 minutes for discussion and completing the first activity because you will need to guide your classes with the three diagrams, that the handout contains.
3. Reinforcement processes - the handout includes 3 reinforcement activities, which will test a range of skills. The activities focus on two markets which are often subject to price floors.
4.Group discussion - divide your class into 5 small groups and allocate each group a stakeholder to represent - agricultural workers and farm owners in the EU, consumers, the European tax payer and LEDCs planning to export their surplus farm produce to nations in the European Union.
5, Activity 4 is a HL activity and includes mathematical tasks while activities 1 and 2 are suitable for a whole school discussion. (30 minutes)
6. Reflection activity - This could be a short discussion activity where your students will outline the advantages and disadvantages of operating a price floor on some markets. (5 minutes)
Beginning question
Watch the following short video, from 1.50 minute onwards and then consider which goods or services does your government place a minimum price on? Why might a government impose a minimum price on a product? How would this be drawn on a supply and demand diagram?
In many cases the answer maybe labour, through minimum wage legislation while many governments also support farmers through minimum prices.
Key terms:
Minimum price / price floor - represents the lower limit imposed by the government below which the price may not fall. Examples include price support for agriculture and minimum wage legislation to protect workers from exploitation.
Surplus - when the supply of a product exceeds demand at the market price.
Quota - a fixed limit on the amount of a good or service that can be produced. This policy will often run alongside a minimum price policy to prevent an excess of the good being produced.
The activities are available as a PDF file at: ![]() Minimum price
Minimum price
 Activities
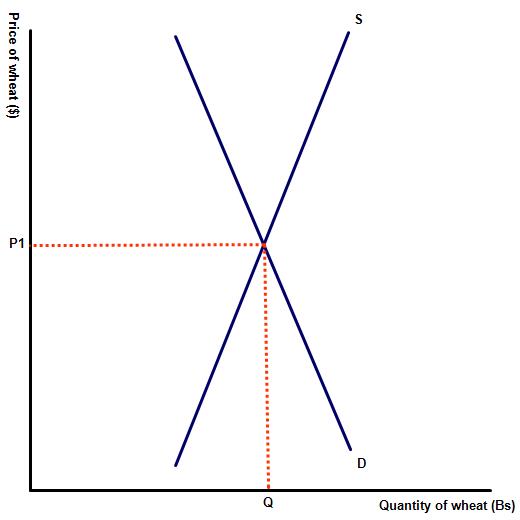
1. The diagram to the right illustrates the market for wheat in a free market. The government decides to implement a price support policy for its wheat farmers by providing a guaranteed minimum price, above the equilibrium price level.
(a) Explain possible reasons why the government might provide a price support system for farmers?
- to ensure food supplies by offering a guarantee of income allowing farmers to invest without fear of future collapses in food prices
- to protect farmers and farm workers from the challenges faced by volatile world food prices.
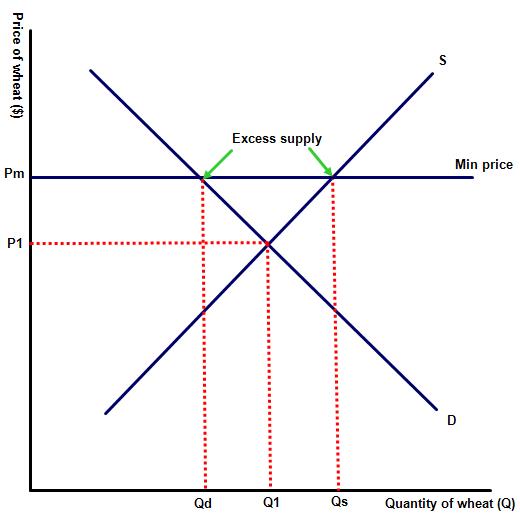
(b) Illustrate the minimum price on the diagram, including the excess supply of the commodity.
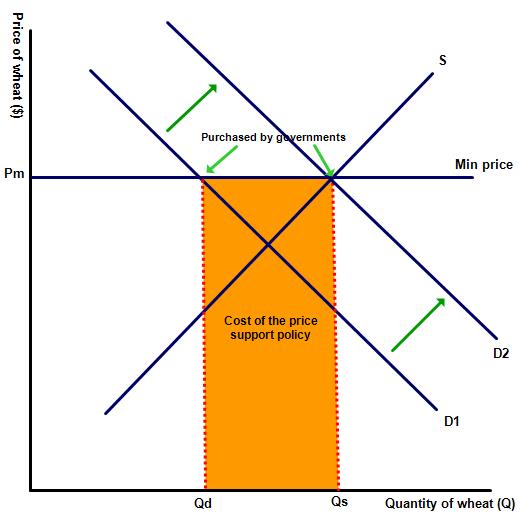
(c) To tackle the excess supply (surplus of food) created by the price support system, the government will intervene further by purchasing the excess supply, themselves. Illustrate this on your diagram or on a separate diagram.
Indicate the following areas on the diagram:
i. The volume of food purchased by the government.
ii. The cost of the price support policy.
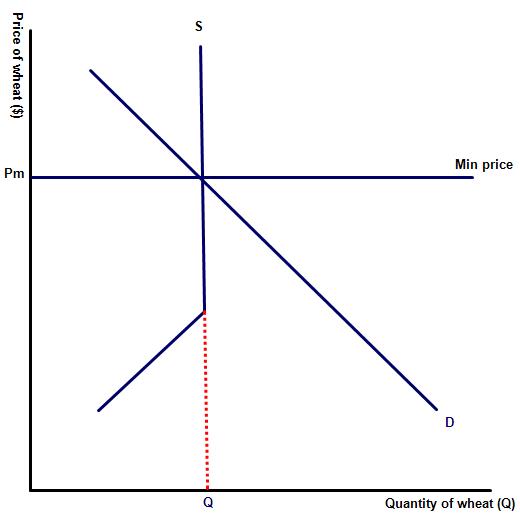
(d) One final solution is for a government to guarantee farmers a minimum price, but also impose a fixed quota on the level of output that can be produced. Illustrate this on a separate diagram.
(e) Explain the opportunity cost of any decision to offer minimum price guarantees to producers.
The cost of the funds allocated for such a scheme, which may leave fields and farm workers lying idle, while the farm owner still receives a salary.
 Activity 2
One of the areas where governments will often impose a minimum price on agricultural products, in an attempt to provide security for the nation’s food supplies. The following table illustrates the level of support provided for the sector by nation’s in OECD countries.
Identify the ipact of the policy of agricultural subsidies from the viewpoint of the following stakeholders: agricultural workers and farm owners, consumers and tax payers.
Activity 3: Minimum price on alcohol
Watch the following short video, which features a panel discussing the viability of a minimum price on alcoholic beverages and then answer the questions that follow:
1. Draw the impact of the minimum price on a supply and demand curve. Presume that the price floor is placed above the equilibrium level and show the impact on price and consumption levels.
The demand curve should be PED inelastic to reflect the addictive nature of alcoholic drinks.
2. Explain two other measures that a government could employ to reduce alcohol consumption within communities.
Hint:
Responses could select either a reduction in drinking hours, from the current 24 hour drinking limit, a tax on alcoholic drinks as well as advertising campaigns to promote sensible or moderate drinking habits.
3. Evaluate the advantages and disadvantages of the minimum price legislation?
 The advantages of legislation which imposes a minimum price on alcohol is that it should reduce alcohol consumption. Even though alcohol is an addictive product and therefore PED inelastic, a rise in alcohol prices will probably reduce consumption levels. Specifically it will restrict the ability of supermarkets to provide alcohol at very low prices as a way of encouraging customers through their doors. Such customers are likely to be binge drinkers, rather than social drinkers, who prefer to drink in public houses or cafes, where alcohol is already set well above the proposed minimum price. Reducing alcohol consumption will also bring clear advantages to the economy which is currently spending £3.6 billion each year on additional health care expenses. Alcohol consumption also costs the UK an estimated £11 billion each year as a result of alcohol induced crime.
However, there are disadvantages of such a policy. Implemented on its own, without other measures such as a restriction on licencing hours, may well mean that the policy is only partially effective due to the price inelasticity of demand. Some of the panel argued that a minimum price on alcohol is little more than a regressive tax on the poor. Such a policy is also a restraint on trade which many economists would agree with.
Activity 4 (HL only)
Demand and supply for corn in the USA is represented by the following table:
| Price ($) | Demand (m) | Supply (m) |
| 10 | 75 | 15 |
| 15 | 65 | 25 |
| 20 | 55 | 35 |
| 25 | 45 | 45 |
| 30 | 35 | 55 |
| 35 | 25 | 65 |
| 40 | 15 | 75 |
(a) Highlight the equilibrium price and then illustrate the data on a demand and supply diagram, using the graph paper included.
(b) The government decides to impose a price floor of $ 35, on the product, in an attempt to guarantee food supplies for the nation. Illustrate this on the diagram, indicating the area of surplus.
(c) To compensate for the national surplus in food supplies the government decides to place a subsidy on the good, large enough to reduce all of the surplus. Illustrate this on your diagram and calculate the cost of the subsidy.
$20 x 65m = $ 1,300 million
(e) Describe the opportunity cost of the government subsidy?
The additional benefit that other public services might otherwise have benefited from a rise in investment.
5. Final reflection activity
Overall would you support your government using a price floor to support the maintenance of some markets?
 Twitter
 Facebook
 LinkedIn