 IB Docs (2) Team

Equilibrium unemployment
 Introduction
This page focuses on the types of equilibrium unemployment.
Enquiry question
What unemployment is still present in the economy when the economy is in equilibrium (full employment).
Lesson time: 85 minutes
Lesson objectives:
Explain, using a diagram, that structural unemployment is caused by changes in the demand for particular labour skills, changes in the geographical location of industries, and labour market rigidities.
Explain that the natural rate of unemployment is the rate of unemployment that exists when the economy is producing at the full employment level of output. (HL only)
Teacher notes:
1. Beginning activity - begin with the opening video and then discuss the three questions as a class. (Allow 10 minutes in total)
2. Processes - technical vocabulary - the students can learn the background information from the 3 opening videos and the questions on the second activity, plus the list of key terms. (Allow 30 minutes)
3. Application of theory - activities 3 and 4 develop the theory. (25 minutes)
4. Short answer revision questions - activity 5 (10 minutes)
5. Final activity - activity 6 contains a paper one style question (10 minutes)
Key terms:
The natural rate of unemployment - this consists of the level of frictional and structural unemployment present in the economy. Such a level of unemployment is natural because even the healthiest of economies will have workers starting and leaving positions, looking for better jobs as well as some industries in decline as well as other new industries emerging.
Labour force - defined as a person who is actively seeking work and within the working age (18 – 65), not in full time education and declared physically fit to work.
Aggregate supply of labour - the number of workers willing and able to work in a particular job or industry for a given wage.
Full employment output - the amount of output that is produced in an economy when that economy is using all of its resources efficiently; the full employment output would be a combination of output that is on that country’s PPC.
The activities on this page are available as a class handout at: ![]() Equilibrium unemployment
Equilibrium unemployment
Beginning activity
Start with the opening question - what will the unemployment level at the full rate of unemployment? Watch the following short video and then answer the questions that follow on equilibrium unemployment.
(a) Which of the two types of unemployment make up the natural rate of unemployment?
Frictional, structural
(b) What is the full employment level? Why is unemployment at the full employment level not 0?
This is also equal to the natural rate of unemployment, when the economy is in equilibrium. Unemployment will not be zero because there will always be structural and frictional unemployment in the economy, this is part of any healthy growing economy.
(c) Which type of unemployment is permanent?
Structural.
Activity 2: Structural unemployment
Watch the following short video and then answer the questions that follow:
 Questions:
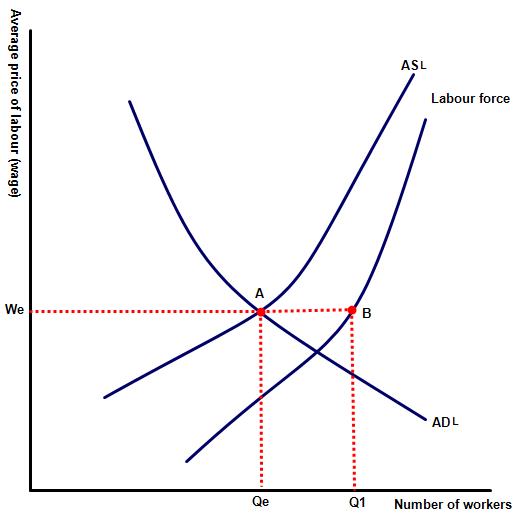
The diagram to the right illustrates the level of structural unemployment in the economy.
(a) Explain the difference between the AS for labour and the labour force.
The labour force represents the economically active population, the number of people willing and able to work. The supply of labour is the number of workers willing and able to work in a particular job or industry for a given wage. So at wage We, only A workers are actively available to work, whereas the B represents those in the labour force.
(b) Explain why the difference between A and B represents the natural rate of unemployment in the economy?
Point A represents the labour market in equilibrium, meaning that the number of people actively willing and able to work is equal to the number of vacancies in the economy. However some of the job vacancies which exist in the economy are positions where the labour force is either unable or unwilling to accept the jobs available. These positions might be in say the ICT sector where there are an insufficient number of suitably qualified applicants to fill those positions. The gap between A and B therefore represents the number of unemployed workers in the economy.
(c) Explain why the gap between the two diminishes as the level of wage offered rises?
This gap reduces as wage levels in the economy rise for the reason that workers willingness to work, even in a field that might not their first choice, increases as the financial reward on offer increases.
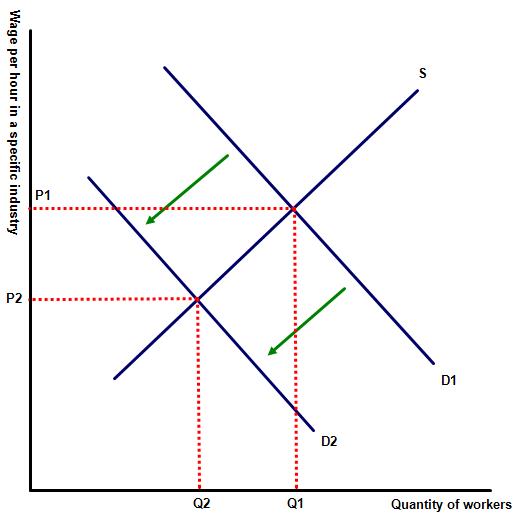
(d) Draw the individual labour market for a specific industry, which is in decline with the number of workers required in the industry falling. Illustrate the new equilibrium level of wage and employment in the industry.
(e) Explain why some of the workers now unemployed may become permanently unemployed?
Some of the recently unemployed workers will become permanent or semi permanent unless the unemployed worker can retrain to take advantage of the new jobs that emerge. For some, especially older people this is notoriously difficult.
(f) Suggest some of the reasons that demand for workers in a specific industry may decline?
Due to a fall in demand for the product e.g. those workers producing music CD's or DVDs.
A result of automation, meaning that new technologies emerge which replace the work once completed by human beings.
A worker may become redundant because the production facility is moved to a low wage economy, such as China or India.
(g) Why is the natural rate of unemployment lower in USA than in Europe?
Less labour protection in USA, making it much easier to fire workers, which encourages businesses to hire more workers in the first place. This is shown on the long term unemployment v employment rigidity diagram.
Unemployment insurance is also more limited in USA, which encourages workers to find work quicker.
Activity 3: Frictional unemployment
Watch the following short video on frictional unemployment and then answer the questions that follow:
(a) What are the major causes of frictional unemployment?
New graduates and school leavers entering the labour market and taking time to find a position.
Experienced workers taking a period of absence from work before re-entering employment.
(b) Why is this a sign of a healthy economy?
Because new businesses emerge while at the same time others disappear, meaning that jobs change. It is also prfectly healthy in a modern economy for workers to reskill or retrain for the new jobs that emerge.
Activity 4: Long term unemployment
The following video focuses on the UK governments attempts to reduce unemployment by helping long term unemployed people into work.
Outline the problems facing the long term unemployed? What other measures could the UK government take in order to reduce long term unemployment levels?
 Hint:
Hint:
Jay (the author of the video) is structurally unemployed and despite low unemployment levels in the economy, has been unable to find suitable work. Given that cyclical unemployment is low in the UK and Jay is clearly not voluntarily unemployed the problem may well be that his skills are unsuitable for the available work in the area. Perhaps the government should try offering him a retraining programme to update his skills. Alternatively they could even try the more drastic approach of reducing Jay's access to benefits. Perhaps the presence of out of work benefits is encouraging him to refuse all but the most desirable of positions - ones that he is unqualified for?
Activity 5
In this 10 minute Youtube video, Professor Milton Friedman, one of the worlds leading economists, leads a discussion on various aspects of unemployment. Summarise his main views on unemployment. Also available at: http://www.LibertyPen.com
Milton Freedman focuses on two types of unemployment real wage unemployment and structural unemployment. He highlights the issue of workers in heavily industrialised sectors such as steel and car manufacture who earn unsustainable high wages - roughly twice the national average wage. The interview also criticises the generous welfare benefits available in the nation which empowers workers to demand high wages in collective bargaining without any fear of losing their jobs.
The video is also critical of attempts by governments to offer subsidies to businesses setting up in high unemployment areas because of the opportunity cost of doing so.
Activity 6: Short answer questions on equilibrium unemployment
1. Which of the following is a reason that the official unemployment rate can understate the actual unemployment situation in an economy?
A. Discouraged workers are not in the labour force.
B. Unemployed workers looking for work are not in the labour force.
C. Part-time workers are not counted as employed.
D. Underemployed workers are counted as unemployed.
E. Non-citizens are not counted in the labour force.
A
The table below shows population and employment data for Downtown Abbey, a country with a total population of 1 million people.
Children under 15 years old: 200,000
Employed: 325,000
Unemployed: 25,000
Discouraged adult workers: 50,000
Full-time students over 15: 100,000
Retired individuals: 100,000
Stay-at-home parents and other non-working civilians over 16: 100,000
Non-civilians (employed by armed forces ) 50,000
Institutionalised individuals: 50,000
2. What is Downtown Abbey's labour force participation rate (LFPR)?
A: 35%
B: 40%
C: 32.5%
D: 80%
E: 50%
40% (all those employed, unemployed and in the armed forces) as a % of the total population.
3. What is the unemployment rate in Downtown Abbey?
A: 7%
B: 6%
C: 12%
D: 2%
E: 4%
B
4. Sonja was out of a job for a year. She recently gave up looking for work because there were no jobs available.
Which of the following best describes the effect of Sonja exiting the labour market?
A: The labour force participation rate increases
B: The unemployment rate increases
C: The unemployment rate decreases
D: The unemployment rate will not change
E: The size of the eligible population decreases
C
5. Which of the following types of unemployment represent the equilibrium rate of unemployment.
A: Structural
B: Frictional
C: Seasonal
D: Cyclical
E: Classical
Activity 7: Link to the paper one assessment
An examples of a typical paper one question on unemployment includes:
(a) Explain the difference between cyclical and structural unemployment. [10 marks]
 Command term: Explain
Key term: Structural unemployment, cyclical unemployment
The command term explain requires a response that distinguished between the two types of unemployment.
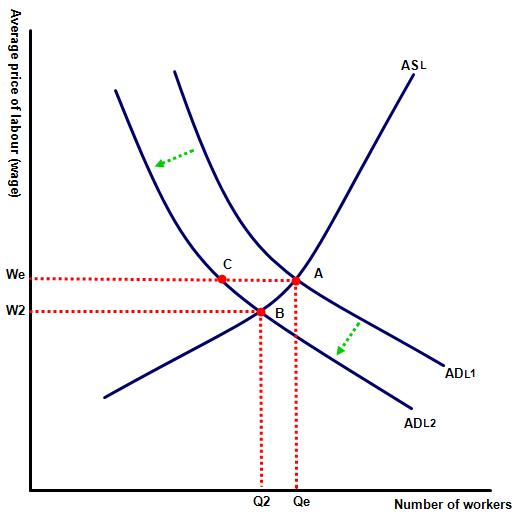
Firstly, cyclical unemployment consists of workers unemployed because of a downturn in the economic cycle (a recession). This is called cyclical unemployment because the former worker is only unemployed because of the state of the economy. Once the economy has returned to its natural rate of unemployment then the worker is likely to find work given their qualifications, skills and experience.
In the diagram aggregate demand in the economy has fallen from AD1 to AD2, shifting the equilibrium in the economy from point A to point B. If the market for labour worked in a similar way as the market for other goods and services, then wage levels would also fall to W2. However, the labour market works differently because it is difficult for firms to actually reduce the price of labour and wages therefore remain at We, with the rise in unemployment represented by the gap between A and C. Any reduction in wages is more likely to be a fall in real wages rather than absolute wage rates.
By contrast structural unemployment is a result of workers unemployed because they lack either the skills to find a suitable job or the skills that they possess are not in demand in that region. An example of this might be a cotton worker, living in a city where the major cotton factory has closed down. This type of unemployment is also common in former mining towns where the major employer was a coal mine that has now been closed. This type of unemployment is also common amongst mature workers who have been unable or unwilling to renew their skills and have been left behind in the work place.
This is illustrated in diagram 2, where demand for products within a specific industry has fallen due to competition from a far east competitor and this has led to a fall in the number of workers employed within that industry. Those workers who are laid off then join the ranks of the structurally unemployed unless they can find alternative employment in a different industry.
(b) Using real life examples, evaluate the effectiveness of supply side policies in reducing unemployment. [15 marks]
Command term: Evaluate
Key term: Unemployment, supply side policies, demand side policies
The command term evaluate requires a response which compares the effectiveness of supply side policies, in comparison .jpg) with alternative policies (demand side policies) in reducing unemployment.
with alternative policies (demand side policies) in reducing unemployment.
Real world examples might include nations that have used supply side policies to reduce levels of structural unemployment such as the UK and USA throughout the 1980 and 1990s. Other examples might include those that have seen sharp falls in cyclical unemployment, following recession, by implementing a policy of expansionary demand side policies. Examples should note that the effectiveness of demand and supply side policies depends on the type of unemployment that a government wishes to address.
Responses should include the following:
Examples of supply-side policies that may be used to reduce long term unemployment include measures to improve the nation's infrastructure, investments in human capital as well as increased spending on research and development.
A recognition that supply side measures, unlike demand side policies, are effective in reducing structural unemployment rates, by providing new jobs for workers whose previous skills have become redundant or providing those workers with new skills so that they can compete in the modern jobs market.
Responses should also include an AD/AS diagram illustrating a right shift in the AS curve or an outward shift in the PPF curve, following an increase in aggregate supply in the economy. This is illustrated In diagram one by a growth in productive capacity and real GDP rising from Y1 to Y2, creating more job opportunities as a result of supply side policies.
A recognition that another advantage of supply side policies is that are more likely than other job creation policies at reducing unemployment in the long run, but do not provide a short term fix, sometimes making them less popular with governments.
A recognition that supply side measures, like all economic policies also have some disadvantage e.g. time-lags and the 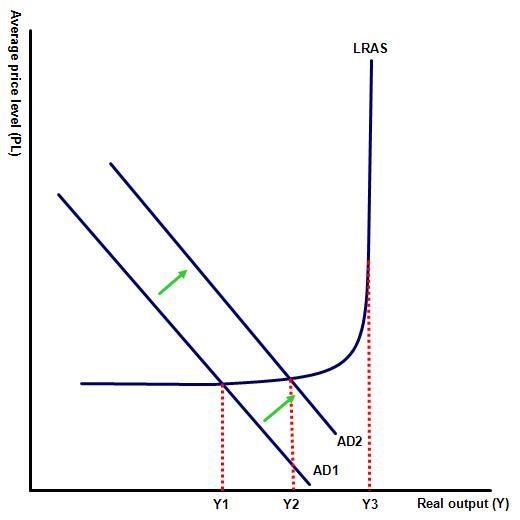 costs associated with large scale investment and government training projects. Another disadvantage is that supply-side policies aimed at increased labour market flexibility or a reduction in access to unemployment benefits may also come at a social cost in terms of a reduction in labour protection or employment security.
In the interests of balance responses should then consider alternative job creation policies, e.g. demand side policies.
An explanation that expansionary demand-side policies can be effective in raising the level of national income / economic growth by increasing one or more of either C, G, I or X. This in turn reduces cyclical unemployment by increasing the demand for labour. Illustrated by diagram two showing a rise in real GDP from Y1 − Y2.
Examples of different monetary and fiscal demand-side policies that may increase either consumption, government spending, investment or net exports.
A discussion of the weaknesses of demand-side policies in reducing unemployment. For example, time-lags, inflationary pressure, higher levels of government debt, increased import levels or crowding out.
A recognition that another significant weakness of demand side policies is that they are only effective in reducing cyclical unemployment levels. Demand side measures are not effective, for example, in reducing levels of equilibrium unemployment.
Relevant real world examples might include fast growing economies such as China, South Korea and Singapore e.t.c. that have successfully employed supply side measures to reduce unemployment levels. Similarly, nations such as UK, USA and Germany have maintained very low levels of unemployment in part a result of labour market de-regulation and cuts to out of work benefits.
 Twitter
 Facebook
 LinkedIn