 IB Docs (2) Team

Aspects of break-even analysis
Aspects of break-even analysis (AO2, AO4)

This part of the syllabus requires students to understand break-even charts and the following aspects of break-even analysis:
Break-even quantity/point
Profit or loss
Margin of safety
Target profit output
Target profit
Target price
As a decision-making tool, break-even analysis provides managers and entrepreneurs (as decision-makers) with useful information and forecasts about a firm's costs, revenues, and profits. It is useful for analysing and predicting the effects of changes in price and/or costs on the profitability of a business. As a visual tool, the predictions from a break-even analysis can be easily interpreted and help to reduce high-risk decisions. The tool is particularly suitable for single-product businesses.
Case Study - Squid Game
Fans of Squid Game may be pleased to know that Netflix's most watched programme was valued at 42 times higher than its break-even. This was more than enough to convince the producers to make Season 2 of the South Korean hit series.
Bloomberg reported that Season 1 of the show cost only $21.3 million to produce (approximately $2.4 million per episode) and estimated Squid Game to be worth almost $900 million. Netflix tweeted in October 2021 “Squid Game has officially reached 111 million viewers - making it our biggest series launch ever.”
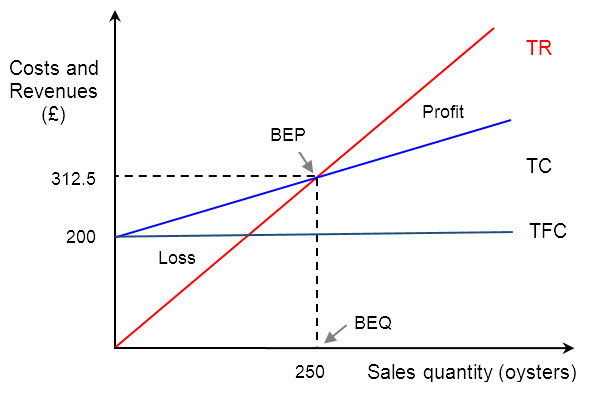
Combining the cost and revenues diagrams from the previous section on contribution allows us to identify the break-even point, as shown in the diagram above.
Recall that costs and revenues are shown on the y-axis. The unit of measurement is a given currency, such as pounds sterling (£), euros (€), or dollars ($).
The sales quantity is shown along the x-axis, with a suitable unit of measurement (depending on the product in question).
The total fixed costs (TFC) line starts on the y-axis at the value of the fixed costs (£200 in the above diagram). It is shown as a horizontal line because the fixed costs do not change when the quantity of sales increases.
The break-even point (BEP) is where the firm's total revenue (TR) line intersects its total costs (TC) line, i.e., the point where TR = TC.
The break-even quantity (BEQ) is shown on the x-axis, as this shows the sales volume (or quantity of sales) necessary for the firm to break-even (i.e., 250 oysters in the above case).
The break-even revenue is shown on the y-axis, representing the value of the output needed to break-even. If the firm sells 250 oysters (the BEQ), the break-even revenue is £312.50 (i.e. £1.25 × 250).
The firm's total cost (TC) at the BEQ is £312.50. This is determined by adding the total fixed cost (TFC) and total variable costs (TVC) at the break-even level of output. In our previous example, the firm's unit variable cost was £0.45. Hence, the total cost at the BEQ is £200 + (£0.45 × 250) = £312.50. Clearly, this must be the same value as the firm's break-even revenue.
The break-even chart above also shows that when the firm sells less than the BEQ (250 oysters in this case), it makes a loss. When it sells more than the BEQ, the business earns a profit.
Top tip 1!
When calculating the break-even quantity, if the answer is not a whole number (e.g. 132.4 cars) then make sure you round up (e.g. 133 cars). This is because a firm cannot or does not sell a fraction of a product (such as 40% of a car that is unfinished).
Top tip 2!
Remember to label the y-axis correctly as: ‘Costs and revenue ($)’. Too often, students ignore revenue in a break-even chart and/or forget to add the correct unit of currency, be in $, £, €, ¥ or any other currency.
Watch this short 2-minute video clip to recap the ideas above, and to review how to construct a break-even chart.

The numerical difference between how much the business sells and its BEQ is known as the margin of safety (MOS) or the safety margin. Suppose the oyster retailer sells 330 oysters in a week. This means it sells 80 more oysters than required to break even, i.e. 330 – 250 = 80 oysters.
If the firm sells more than its break-even quantity (BEQ), it will earn a profit. This also means it has a positive margin of safety. The opposite is true if the firm sells less than its BEQ, i.e., the firms makes a loss or has a negative margin of safety.
Top tip 3!
Remember to express the margin of safety using the correct unit of measurement. Too often, students use the ‘$’ sign in their answers for calculating or expressing the value of the margin of safety. This is incorrect as the safety margin is measured along the x-axis, i.e. answers must refer to the sales volume, not the sales value.
It is also possible, although not always practical, to express the margin of safety in terms of a percentage figure. In the above example, the oyster vendor has a safety margin of 80 unit, i.e., it sells 80 oysters more than is required to reach break-even. This also means its margin of safety is 32% (i.e., 80 / 250 = 32%) higher than the break-even quantity.
To test your understanding of this topic, have a go at the following exam practice questions.
Exam Practice Question 1
A large company manufactures a single healthcare product for hospitals. Each unit is sold to customers for $80. The average variable cost of manufacturing the product is $50. Total fixed costs for the year are $40,000. The company strives to achieve a target profit of $80,000 for the year.
| (a) | Calculate the break-even quantity for the company. | [2 marks] |
| (b) | Calculate the target profit output for the company. | [2 marks] |
Answers
(a) Calculate the break-even quantity for the company. [2 marks]
Break-even quantity = Total fixed costs / Unit contribution
BEQ = $40,000 / ($80 – $50)
BEQ = $40,000 / $30 = 1,333.33
Award answers that state 1,334 units of output to reach break-even
Award [1 mark] for the correct answer, and [1 mark] for showing appropriate working out.
(b) Calculate the target profit output for the company. [2 marks]
Target profit output = (Total fixed cost + Target profit) / Unit contribution
Target profit output = ($40,000 + $80,000) / ($80 – $50)
Target profit output = $120,000 / $30 = 4,000 units of output
Award [1 mark] for the correct answer, and [1 mark] for showing appropriate working out.
Exam Practice Question 2
Use the data in the table below to calculate the break-even price.
Costs of raw materials for A2 Bakery in June
Item of spending | Cost |
Whipped cream | $12,000 |
Fresh fruits | $25,000 |
| Flour | $10,600 |
Output | 11,900 units |
Answer
The break-even price is equal to the unit cost (or average cost) of the product.
Average cost = Total cost ÷ Quantity of output
AC = ($12,000 + $25,000 + $10,600) ÷ 11,900 = $4
Exam Practice Question 3
Refer to the data below for a firm that produces bluetooth loudspeakers, and then answer the following questions.
Sales price per loudspeaker = $250
Variable cost per loudspeaker = $150
Total fixed cost = $35,000
Target profit = $40,000
| (a) | Calculate the break-even quantity for the manufacturer. | [2 marks] |
| (b) | Calculate the number of units that the producer will have to sell in order to earn its target profit. | [2 marks] |
Answers
(a) Calculate the break-even quantity for the manufacturer. [2 marks]
BEQ = TFC / (P - AVC)
BEQ = 35,000 / ($250 - $150) = 35,000 / 100 = 350
Hence, the firm needs to see 350 loudspeakers per time period in order to reach break-even.
Award 1 mark for the correct answer, and 1 mark for showing appropriate working out.
(b) Calculate the number of units that the firm has to sell in order to earn its target profit. [2 marks]
Sales revenue = P × Q
Target sales revenue = TVC + TFC + Target profit
$250Q = $150Q + $35,000 + $40,000
Target sales output = $100Q = $75,000
Q = $75,000 / $100 per unit
Q = 750 loudspeakers
Hence, the firm needs to sell 750 loudspeakers in order to earn a target profit of $40,000
Award [1 mark] for the correct answer, and [1 mark] for showing appropriate working out.
Exam Practice Question 4 - Mayer's Doughnuts

Vicky Mayer is the owner of Mayer's Doughnuts. The business has variable costs of $0.25 per doughnut and Vicky sells these for $1.50 each. Her fixed costs are $10,000 per month. She sells an average of 9,500 doughnuts each month.
| (a) | Calculate the unit contribution for Mayer’s Doughnuts. | [2 marks] |
| (b) | Calculate the number of doughnuts the firm has to sell each month in order to reach break-even. | [2 marks] |
| (c) | Calculate the monthly safety margin for Mayer’s Doughnuts. | [2 marks] |
| (d) | Use the above answers to plot the break-even chart for Mayer’s Doughnuts. | [5 marks] |
Answers
(a) Calculate the unit contribution for Mayer’s Doughnuts. [2 marks]
The formula for contribution per unit is selling price minus variable cost per unit (P – AVC).
Given that P = $1.50 and AVC = $0.25, the contribution per unit is $1.25
Award [1 mark] for the correct working out and [1 mark] for the correct answer with the correct unit of measurement ($).
(b) Calculate the number of doughnuts the firm has to sell each month in order to reach break-even. [2 marks]
The formula for break-even is fixed costs divided by unit contribution, i.e. TFC ÷ (P – AVC). Hence, BEQ = $10,000 ÷ $1.25 = 8,000 doughnuts per month.
Award [1 mark] for the correct working out and [1 mark] for the correct answer with the correct unit of measurement (doughnuts).
(c) Calculate the monthly safety margin for Mayer’s Doughnuts. [2 marks]
The safety margin is calculated by finding the difference between actual sales and the break-even quantity
Hence, the safety margin = 9,500 – 8,000 = 1,500 doughnuts
Award [1 mark] for the correct working out and [1 mark] for the correct answer with the correct unit of measurement (doughnuts).
(d) Use the above answers to pot the break-even chart for Mayer’s Doughnuts. [5 marks]
Break-even chart for Mayer’s Doughnuts
.jpg)
Award [1 mark] for each of the following, up to the maximum of [5 marks]:
Correctly plotting and labelling the total sales revenue (TR) line
Correctly plotting and labelling the total cost (TC) line
Clearly identifying the break-even output at 8,000 doughnuts
Clearly identifying the margin of safety of 1,500 doughnuts
Correctly labelling of both axes.
Back to the Unit 5.5 - Break-even analysis homepage
Back to the Unit 5 - Operations Management homepage
![]()
 Twitter
 Facebook
 LinkedIn