 IB Docs (2) Team

Profitability ratios
Ratio analysis is a quantitative management planning and decision-making tool, used to analyse and evaluate the financial performance of a business. Profitability is a measure of profit in relation to another variable. This section of the IB Business Management syllabus examines the following profitability ratios (AO2, AO4), as well as possible strategies to improve these ratios (AO3):
Gross profit margin
Profit margin
Return on capital employed (ROCE).
These can be further categorised as profitability, liquidity and efficiency ratio analysis.
The ratios allow firms to make historical comparisons of financial performance during different time periods. Profitability ratios examine the level and value of a firm’s profits, thereby enabling different stakeholders to measure the financial returns on their investments. Profitability ratios also express a firm’s profits as a percentage of its sales revenue.
The gross profit margin (GPM) is a profitability ratio that measures an organization’s gross profit expressed as a percentage of its sales revenue. It is also an indicator of how well a business can manage its direct costs of production.
Recall that gross profit is the difference between a firm’s sales revenue and its cost of sales (COS). The formula for calculating the gross profit margin (GPM) is:
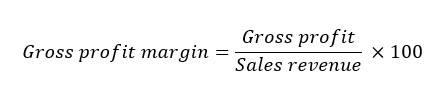
For example, suppose a firm has sales revenue equal to $100 million, cost of sales (COS) of $55 million, and expenses (or overheads) equal to $25 million. Therefore, the firm’s gross profit = $100m – $55m = $45m. Hence, the firm’s GPM ratio = $45m ÷ $100m = 45%.
This means that for every $100 of sales revenue, the firm earns gross profit of $45. Hence, the higher the GPM ratio, the more profitable the firm has been from selling its products.
Worked example
Suppose a firm earns $100,000 in sales revenue from selling products that incur direct costs of $30,000.
Gross profit is calculated by using the formula: Sales revenue – Cost of sales
The firm's gross profit would then be $70,000, i.e., $100,000 – $30,000.
Therefore, the gross profit margin (GPM) = ($70,000 / $100,000) × 100 = 70%
This means that for every dollar of sales revenue, the firm earns 70 cents a gross profit.
A firm can improve its GPM ratio by any combination of increasing sales revenue and reducing its direct costs. Such methods could include:
Changing the firm’s promotional strategies to persuade more customers to buy the firm’s goods and/or services.
Launching new goods and/or services that have a higher gross profit margin, i.e. products that have a greater differential between their selling price and their associated direct costs.
Reducing the prices of products sold in highly competitive markets in order to attract more customers, thereby increasing the firm’s overall sales revenue. This will tend to work for products that are highly price elastic (see Unit 4.5) due to the wide availability of close substitutes.
Outsourcing production or other operations to third-party suppliers. This helps the firm to benefit from using external providers that can offer specialised services in a more cost-effective way, thereby reducing the firm’s cost of sales.
The profit margin is a profitability ratio that measures a firm’s overall profit (after all costs of production have been deducted) as a percentage of its sales revenue. It is also an indicator of how well a business can manage its indirect costs (overhead expenses). The profit margin ratio denotes the percentage of sales revenue that is turned into profit. The formula for calculating the profit margin ratio is:
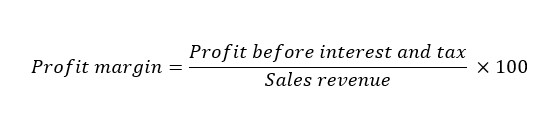
The higher the profit margin ratio figure, the better the organization’s control over its expenses and hence the higher its profitability tends to be. It also indicates greater efficiency in managing the firm’s overheads.
Profit is the financial surplus after all costs, including expenses, have been paid. For example, suppose a firm has sales revenue equal to $100 million, the cost of sales (COS) equals $55 million, and expenses (or overheads) equal $25 million. Therefore, the firm’s profit = $100m – $55m – $25 = $20m.
Hence, the firm’s profit margin ratio = ($20m ÷ $100m) × 100 = 20%. This means that for every $100 of sales revenue, the firm earns profit before interest and tax of $20. So, the higher the profit margin ratio, the more profitable the firm has been.
To improve the profit margin ratio, businesses need to find ways to reduce any type of excessive and unnecessary expenses. Examples of typical business expenses include the following:
Insurance
Lease payments for capital equipment and other fixed (non-current) assets
Mortgage payments
Phone and Internet services
Rent on commercial buildings/land
Salaries for management and administrative personnel
Utility bills.
Top tip!
The profit margin ratio uses profit before interest and tax in its calculation (despite these two items being expenses) for a couple of reasons:
Historical benchmarking - Comparing a firm's profit margin ratio over time would be rather meaningless if the profit after interest charges and tax deductions are made as these expenses are beyond the control of the business. Interest rates are reviewed each month by the central bank and can change at any point, whilst tax rates are also prone to change over time.
Inter-firm benchmarking - It is rather meaningless to compare the profit margin ratio of a business with that of rival firms in overseas markets, as tax and interest rates will differ. For a multinational company, it is therefore also more meaningful to compare the profit margin ratio of its various overseas divisions by using profit before interest charges and tax deductions in order to compare like with like.
The return on capital employed (ROCE) ratio is a profitability ratio that measures a firm’s efficiency and profitability in relation to its size (as measured by the value of the organization’s capital employed).
Capital employed is the value of all sources of finance available for a business at a point in time, including internal and external finance. The formula for calculating capital employed is therefore:
Capital employed = Non-current liabilities + Share capital + Retained earningsor
Capital employed = Non‐current liabilities + Equity
The formula for calculating the ROCE ratio is:

Note: the ROCE ratio formula is given in the formula sheet that must be provided for candidates in the external exams.
A business can improve its ROCE ratio by using any combination of strategies that improve its profit before interest and tax, such as:
Increasing the firm’s sales revenues by using strategies such as reduced prices to attract more customers, using new sales promotions, offering a wider and more efficient distribution network, and/or launching new and improved products.
Reduce costs of production through methods such as using alternative suppliers, having improved stock control systems (see Unit 5.5 HL only), seeking additional opportunities for economies of scale (see Unit 1.5), and improved quality management systems to reduce the cost of wastage (see Unit 5.3 HL only).
Selling unproductive, unused, underused, and obsolete assets in order to improve operational efficiency and liquidity. Being more efficient also helps the firm to reduce its cash outflows (see Unit 3.7).
Watch this 7-minute introductory video about ratio analysis and its purposes. Be aware that this video was not produced specifically for the IB so make sure you stick to the ratios in the IB guide.
Ultimately, the use of profitability and efficiency ratio analysis enables managers and decision makers to analyse and judge the financial performance of a business.
To test your understanding of this topic, have a go at the following exam practice questions.
Exam Practice Question 1 - LaLa's Kitchen Co.
LaLa’s Kitchen Co. declares an annual gross profit of $3.5 million, sales revenue of $5.5 million, and expenses of $1.5 million.
(a) | Calculate LaLa’s Kitchen Co.'s gross profit margin (GPM). | [2 marks] |
(b) | Calculate LaLa’s Kitchen Co.'s profit margin ratio. | [2 marks] |
Answer
(a) Calculate LaLa’s Kitchen Co.'s gross profit margin (GPM). [2 marks]
GPM = ($3.5m ÷ $5.5m) × 100 = 63.63%
Award [1 mark] for the correct answer and [1 mark] for showing appropriate working out.
(b) Calculate LaLa’s Kitchen Co.'s profit margin ratio. [2 marks]
Profit margin ratio = ($3.5m – $1.5m) ÷ $5.5m × 100 = 36.36%
Award [1 mark] for the correct answer and [1 mark] for showing appropriate working out.
Exam Practice Question 2 - Jasmine Sportswear Co.
Jasmine Sportswear Co. (JSC) is a large sportswear manufacturing company. In the first three months of 2020, JSC reported quarterly profits rising by 6% to $212 million and the gross profit margin ratio of 53.1%.
(a) | Define the term profit. | [2 marks] |
(b) | Calculate the value of JSC's profit during the previous three months. | [2 marks] |
(c) | Comment on whether JSC's shareholders would be satisfied with the company's GPM. | [4 marks] |
Answers
(a) Define the term profit. [2 marks]
Profit refers to the financial surplus of a business after it has paid for both cost of sales (COS) and expenses (or overhead costs). It is the difference between a firm's gross profit and its indirect costs, i.e. Profit = Sales revenue – (COS + Expenses).
Award [1 mark] for a limited response that shows some understanding of profit.
Award [2 marks] for an accurate definition that shows good understanding of profit, similar to the example above.
(b) Calculate the value of JSC's profit during the previous three months. [2 marks]
Profit in previous time period = $212m / 1.06* = $200 million
*Note: "profits rising by 6% to $212 million" means dividing by 1.06 deflates the value by 6% for the previous 3 months.
Award [1 mark] for the correct answer, and [1 mark] for appropriate working out.
(c) Comment on whether JSC's shareholders would be satisfied with the company's gross profit margin (GPM). [4 marks]
JSC's gross profit margin ratio of 53.1 per cent means that for every $100,000 of sales revenue, the company earns $53,100 in gross profit (the difference between the company's sales revenue and its cost of sales (COS). This also means that JSC's COS are worth $46,900 for each $100,000 of sales.
It can be difficult to determine whether a GPM of 53.1% is satisfactory to shareholders as it depends on whether the GPM was higher or lower when sales revenue was 6% lower at $200,000. Also, whether this GPM figure is acceptable to JSC's shareholders also depends on benchmarking data, such as the GPM of JSC's main rivals in the industry. Shareholders also have to determine whether the value of JSC's COS (at 46.9% of the firm's sales revenue) is acceptable or whether this value should be (much) lower.
Award [1 - 2 marks] for a response that shows some understanding of the demands of the question. There is some appropriate use of business management terminology, although the response lacks depth or application.
Award [3 - 4 marks] for a response that shows good understanding of the demands of the question. There is effective use of relevant business management terminology throughout the answer, and appropriate application of the case study.
Exam Practice Question 3 - Camiko Face Masks Ltd.

Study the profit and loss account for Camiko Face Masks Ltd., a business based in Wellington, New Zealand, that produces face masks and related products. Then answer the questions that follow. All financial figures are in New Zealand dollars (NZD).
Item | 2022 | 2021 |
Sales revenue | 250,000 | 260,000 |
Cost of sales (COS) | 162,500 | 169,000 |
Gross profit | 87,500 | 91,000 |
Expenses | 26,000 | 26,000 |
Rent | 45,000 | 45,000 |
Profit before interest and tax | 16,500 | 20,000 |
Interest | 6,000 | 6,600 |
Tax | 2,100 | 2,680 |
Profit after interest and tax | 8,400 | 10,720 |
(a) | Define the term gross profit margin (GPM). | [2 marks] |
(b) | Define the term profit margin. | [2 marks] |
(c) | Calculate the GPM for Camiko Face Masks Ltd. for both 2022 and 2021 and comment on your findings. | [4 marks] |
(d) | Calculate the profit margin ratio for Camiko Face Masks Ltd. for both 2021 and 2021 and comment on your findings. | [4 marks] |
(e) | Explain why the profit and loss account records profit before interest and tax. | [2 marks] |
(f) | Explain two possible reasons why Camiko Face Masks Ltd.'s GPM and profit margin were lower than previously. | [4 marks] |
Answers
(a) Define the term gross profit margin (GPM). [2 marks]
The gross profit margin (GPM) measures the amount of trading profit as a percentage of the firm's sales revenue, i.e. GPM = (Gross profit / Sales revenue) × 100. The higher the GPM figure, the lower the cost of sales (COS) are in relation to the firm's sales revenue, so the higher its profitability.
Award [1 mark] for an answer that shows some understanding of gross profit margin.
Award [2 marks] for an answer that shows good understanding of gross profit margin, similar to the response above.
(b) Define the term profit margin. [2 marks]
The profit margin measures the amount of profit (gross profit minus expenses) as a percentage of a firm's sales revenue, i.e. profit margin = [(Gross Profit – Expenses) / Sales Revenue] × 100. In this particular instance, rent has been categorized as a separate expense in Camiko Face Mask Ltd.'s P&L account. The higher the profit margin ratio figure, the better the organization’s control over its overheads and hence the higher its profitability tends to be.
Award [1 mark] for an answer that shows some understanding of profit margin ratio.
Award [2 marks] for an answer that shows good understanding of profit margin ratio, similar to the example above.
(c) Calculate the GPM for Camiko Face Masks Ltd. for both 20202 and 2021 and comment on your findings. [4 marks]
GPM 2022 = ($87,500 / $250,000) × 100 = 35%
GPM 2021 = ($91,000 / $260,000) × 100 = 35%
This means that for every $100 of sales made by Camiko Face Mask Ltd., $35 is earned as gross profit in both years. This is because the other 65% is attributed to the firm's cost of goods sold. Despite a slight fall in sales revenue, the firm has maintained its COS as a proportion of its sales revenue.
Mark as a 2 + 2
Award [1 mark] for the correct calculation of the GPM and [1 mark] for showing appropriate working out.
Award up to [2 marks] if the commentary shows good understanding of the GPM ratio, similar to the example above.
(d) Calculate the profit margin for Camiko Face Masks Ltd. for both 2022 and 2021 and comment on your findings. [4 marks]
Profit margin 2022 = ($16,500 / $250,000) x 100 = 6.6%
Profit margin 2021 = ($20,000 / $260,000) x 100 = 7.69%
This means that for every $100 of sales made by Camiko Face Mask Ltd., only $6.6 was earned as profit in 2022 and slightly higher at $7.69 in 2021 before any deductions were made for interest and tax. This also means that Camiko Face Mask Ltd.'s overall costs (i.e. COS, expenses and rent) accounted 93.4% of sales revenue and 92.31% in 2021.
Mark as a 2 + 2
Award [1 mark] for the correct calculation of the profit and [1 mark] for showing appropriate working out.
Award up to [2 marks] if the commentary shows good understanding of the profit margin ratio, similar to the example above.
(e) Explain why the profit and loss account records profit before interest and tax. [2 marks]
For historical benchmarking purposes, it is common for analysts to use the profit before interest and tax because both interest and tax are subject to changes beyond the control of the business (the rates of interest and tax are set by the government). Their inclusion in a P&L account could easily distort the underlying profitability of an organization simply due to fluctuations in interest and tax rates.
Award [1 mark] for an answer that shows some understanding of the demands of the question.
Award [2 marks] for an answer that shows good understanding of why profit before interest and tax is recorded on the P&L account, similar to the response above.
(f) Explain two possible reasons why GPM and profit margin were lower than previously. [4 marks]
The decline in Camiko Face Masks Ltd.'s GPM and profit margin could have been caused by various reasons, such as:
Inefficiencies within the company, thereby raising unit costs and reducing profit margins.
Demand for face mask products in New Zealand may have slowed down / declined.
The global pandemic of 2020 may have had negative impacts on both the GPM and profit margin of the firm.
Competition from rival manufacturers of personal protective equipment (such as face masks), which caused the slight drop in Camiko Face Masks Ltd.'s sales revenue.
Expenses have not declined despite Camiko Face Masks Ltd.'s sales revenues falling, so this will have harmed the profit margin ratio.
Rising labour costs in New Zealand, which would reduce Camiko Face Masks Ltd.'s profit margin ratio.
Accept any other possible reason for the lower GPM and profit margin ratio at Camiko Face Masks Ltd.
Award [1 – 2 marks] for a limited answer that shows partial understanding of the possible reasons for the decline in the profitability ratios or if the answer does not make any reference to the financial data.
Award [3 – 4 marks] for an explanation that shows a clear understanding of two valid reasons for the decline in the profit margin ratio and GPM at Camiko Face Masks Ltd. There is good use of the financial data above, with appropriate use of business management terminology throughout the answer.
Return to the Unit 3.5 - Profitability and liquidity ratio analysis homepage
Return to the Unit 3 - Finance and accounts homepage
![]()
 Twitter
 Facebook
 LinkedIn