 IB Docs (2) Team

BMT 6 - Decision trees
-1.jpg)
A decision tree is a quantitative and methodical organizational planning tool based on the mathematical concept of probability trees. As a visual tool, it allows managers to see possible options and the probable outcomes, thereby helping them to make more informed decisions.
Note to teachers:
This topic featured in the previous syllabus (final examinations N23) but was for HL only candidates. Decision trees in the new syllabus (first exams M24) are to be taught to both HL and SL candidates.
Please be aware of this change if/when using resources for the previous syllabus, including past IB exam papers and mark schemes.
Watch this funny TV commercial that suggests why a bit of forward planning is important before making decisions.
Conventions in drawing a decision tree are outlined below:
A square represents a decision node, i.e., a decision that needs to be made
A circle represents a chance node (or probability node), i.e., the probable outcomes of different decisions
Probabilities of the different outcomes are shown as decimal numbers, e.g., 0.65 means a 65% chance of the outcome occurring.
Cross out lines (or strike out lines) indicate the options that are rejected based on quantitative reasoning and logic.
The diagram below shows a decision of a firm to invest in either Project Widmore (which costs $13.5m) or Project Redlands (which costs $10m).
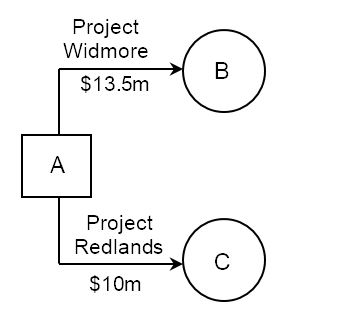
Consider the following scenario for the two projects, and then take a look at the decision tree diagram below that corresponds with these figures:
Project Widmore has a 65% chance of success, which would generate $20 million in sales revenue. Thus, the likely outcome is $20m × 0.65 = $13m.
Project Widmore has a 35% chance of failing, which would generate only $11.5m in sales revenue. Hence, the likely outcome is $11.5m × 0.35 = $4.025m.
Hence, the combined probable outcome for Project Widmore is $13m + $4.025m = $17.025m. After deducting the cost of the project, the probable return on investment is $17.025m – $13.5m = $3.525m.
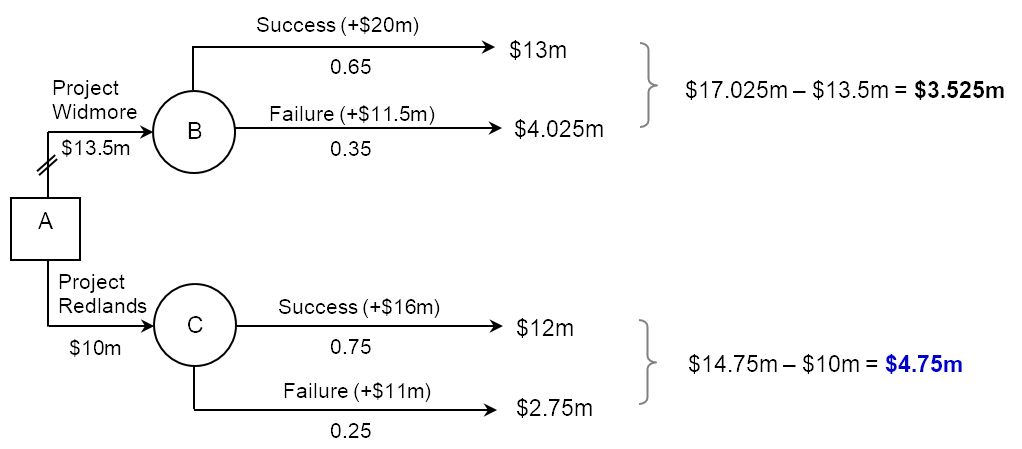
For Project Redlands, there is a 75% chance of success in earning $16m. This is a higher probability than success for Project Widmore, even though the return is less ($20m compared with $16m). The probable outcome of success for Project Redlands is $16m × 0.75 = $12m.
There is a 25% expectation that Project Redlands will fail, in which case the forecast earnings is $11m in sales revenue. Hence, the probable outcome is $11m × 0.25 = $2.75m.
Hence, the combined probable outcome for Project Redlands is $12m + $2.75m = $14.75m. As the project costs $10m, the probable profit from Project Redlands is therefore $14.75m – $10m = $4.75m.
The probable profit from Project Redlands at$4.75m is higher than that for Project Widmore at $3.525m.
Two parallel lines are used in the decision tree diagram to cut through a “branch” which shows the option that is rejected. In this case, as Project Redlands has a higher expected return on investment, Project Widmore is not chosen.
Key terms
A chance node, shown as circles on a decision tree diagram, represents the probable outcome of a particular decision.
Cross out lines (or strike out lines) indicate the options in a decision tree diagram that are rejected on quantitative grounds.
A decision node, shown as squares on a decision tree diagram, refers to a decision that needs to be made.
A decision tree is a visual organizational planning tool for senior managers to assist them in making a more informed choice based on the probability of the various outcomes and expected returns for a particular project or decision.
Probabilities show the chances of an outcome occurring.
Top tip!
Remember that examiners will expect a key (legend) to a decision tree diagram. Make sure squares (decision nodes), circles (chance nodes) and crossed out lines (rejected options) are all correctly labelled.
Top tip!
Check that your probabilities for each chance node in a decision tree diagram adds up to 1.0, i.e. 100%.
Advantages of using decision trees
The advantages of using decision trees as a decision-making tool include:
As a planning tool, decision trees offer managers a visual representation of different decisions and choices, with probable and quantifiable outcomes. This makes decision making more informed, objective, and logical.
It helps managers to consider the various financial risks involved with different choices options, not just the potential financial rewards.
The results are easy to understand, with tangible quantitative results to support decision making.
It is a flexible organizational planning tool that can be applied to many different situations and decisions.
Disadvantages of using decision trees
The limitations of using decision trees as a decision-making tool include:
As a purely quantitative planning tool, decision trees ignore qualitative factors (non-financial information) that often affect decision making. For example, there is no consideration of the role of intuitive, emotion or ethical issues in the decision-making process.
The probabilities are, at best, only forecasts even if based on market research data. This means the predicted outcomes are still unknown. Changes in the external business environment can easily change the probably outcomes, i.e. the data used to construct a decision tree can become out of date by the time managers follow through with their decision.
As a quantitative decision-making technique, the use of decision trees does not necessarily reduce the amount of risks, whatever the predicted net outcome figures might reveal.
For very complex decisions with numerous and interconnected options, it can be difficult to construct a decision tree diagram that is concise and succinct.
ATL Activity 1 - Birthday pi
What do you think is the probability that your date of birth appears in the number pi?
Visit the website http://www.subidiom.com/pi/ - enter your DOB to find out! For example, if your birthday is 15th August 2005, then enter “15082005”.
Although targeted at A Level students, this video is also suitable for IB Diploma students to consolidate their understanding of decision trees as an organizational planning tool:
Exam Practice Question 1 - Rana El Matarawi Textiles
Rana El Matarawi runs a textiles company and is considering developing and launching a new product range at an estimated cost of $25,000. She has decided to use a decision tree with a 70% probability of the new product range being a commercial success. If so, this should lead to an additional $50,000 in sales revenue. The probability of failure is 30% which would lead to additional sales of only $5,000.
| (a) | Define the term decision tree. | [2 marks] |
| (b) | Calculate the expected value of the new product range for Rana El Matarawi. | [2 marks] |
| (c) | Explain two advantages of using decision trees as a decision-making tool for the business. | [4 marks] |
Answers
(a) Define the term decision tree. [2 marks]
A decision tree is a visual tool which can be used by managers to make the right or best decision based on quantitative factors. It enables managers to analyse and make estimates about the possible outcomes of different courses of action and work out the likelihood of these occurring based on a quantitative understanding of risks.
Award [1 mark] for a limited response that shows some understanding. Award [2 marks] for a clear and accurate definition, similar to the example above.
(b) Calculate the expected value of the new product for Rana El Matarawi. [2 marks]
• Expected outcome of success = 0.70 × $50,000 = $35,000
• Expected outcome of failure = 0.30 × $5,000 = $1,500
• Total expected outcome = $35,000 + $1,500 = $36,500
• Net expected value = $36,500 – $25,000 = $11,500
Award [1 mark] for the correct answer, and [1 mark] for showing appropriate working out.
(c) Explain two advantages of using decision trees as a decision-making tool for the business. [4 marks]
Possible advantages include:
• They enable managers like Rana El Matarawi to assess the risks associated with certain decisions.
• They provide a quick and visual interpretation of the likely outcomes of decisions that need to be made.
• They set out decision-making problems in a clear and logical way.
• Decision trees encourage managers to consider the financial costs of investment decisions.
• They encourage managers to make decisions based on logic and rationality rather than emotions.
• They help managers to realise some of the risks and opportunities that they might not have considered.
For each advantage, award [1 mark] for a plausible answer and [1 mark] for the explanation.
Exam Practice Question 2
Refer to the decision tree diagram below and answer the following questions.
| (a) | Outline one limitation of using decision trees to support management decision making. | [2 marks] |
| (b) | Calculate the values of the predicted outcome for Project Atlanta and Project Boston shown in the decision tree diagram below. | [4 marks] |
| (c) | Calculate the values of the net predicted outcome for each project. | [2 marks] |
| (d) | From your answers above, suggest which option should be chosen. | [2 marks] |
Answers
(a) Outline one limitation of using decision trees to support management decision making. [2 marks]
Possible limitations could include an outline of any of the following:
The probabilities are just estimates and are prone to error or bias.
Decision trees are quantitative in nature so ignore qualitative dimensions of decision making.
Using decision trees does not actually reduce the degree of risks involved.
Accept any other valid limitation that is clearly outlined.
Award [1 mark] for identifying a valid limitation of decision trees, and a further [1 mark] for an appropriate outline of the reason.
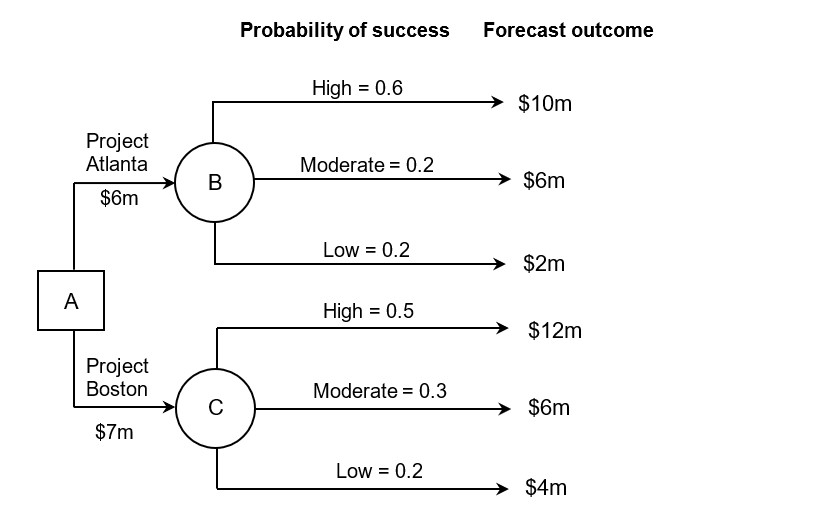
(b) Calculate the values of the predicted outcome for Project Atlanta and Project Boston shown in the decision tree diagram below. [4 marks]
| Project Atlanta | High | Moderate | Low | Total |
| Success | 0.6 | 0.2 | 0.2 | 1 |
| Outcome | $10m | $6m | $2m | |
| Predicted outcome | $6m | $1.2m | $0.4m | $7.6m |
| Project Boston | High | Moderate | Low | Total |
| Success | 0.5 | 0.3 | 0.2 | 1 |
| Outcome | $12m | $6m | $4m | |
| Predicted outcome | $6m | $1.8m | $0.8m | $8.6m |
Marks as a 2 + 2
For each project, award [1 mark] for showing appropriate working work, and a further [1 mark] for the correct predicted outcome figure, up to the maximum of [4 marks].
(c) Calculate the values of the net predicted outcome for each project. [2 marks]
Net predicted outcome = Predicted outcome – Cost
Project Atlanta = $7.6m – $6m = $1.6m
Project Boston = $8.6m – $7m = $1.6m
Apply the OFR (own figure rule) as appropriate, i.e., error carried forward.
Award [1 mark] for showing appropriate working out and a further [1 mark] for the correct answers.
(d) From your answers above, suggest which option should be chosen. [2 marks]
The decision tree analysis shows that both projects are expected to yield the same financial return of $1.6m. In theory, this means either projects are feasible on quantitative grounds. In reality, Project Atlanta may be preferable given the cost of the project is $1m less, and given that there is a lower chance (probability) of success for Project Boston (which costs 16.7% more to invest in than Project Atlanta).
Award [1 mark] for an answer that shows limited understanding of the demands of the question. The response lacks substance or application of the decision tree.
Award [2 marks] for an answer that shows good understanding of the demands of the question, with appropriate use of the figures calculated in the decision tree.
Exam Practice Question 3 - Bala Art Studios (BAS)
Bala Art Studios (BAS) is considering expanding into one of three locations. The expected costs and revenues are shown below. BAS only has enough resources to pursue one of these options.
Location | Probability (%) | Cost ($m) | Revenue ($m) |
Ahmedabad | 95 | ||
High sales | 60 | 220 | |
Low sales | 40 | 85 | |
Bengaluru | 85 | ||
High sales | 50 | 200 | |
Low sales | 50 | 75 | |
Chennai | 100 | ||
High sales | 65 | 190 | |
Low sales | 35 | 90 |
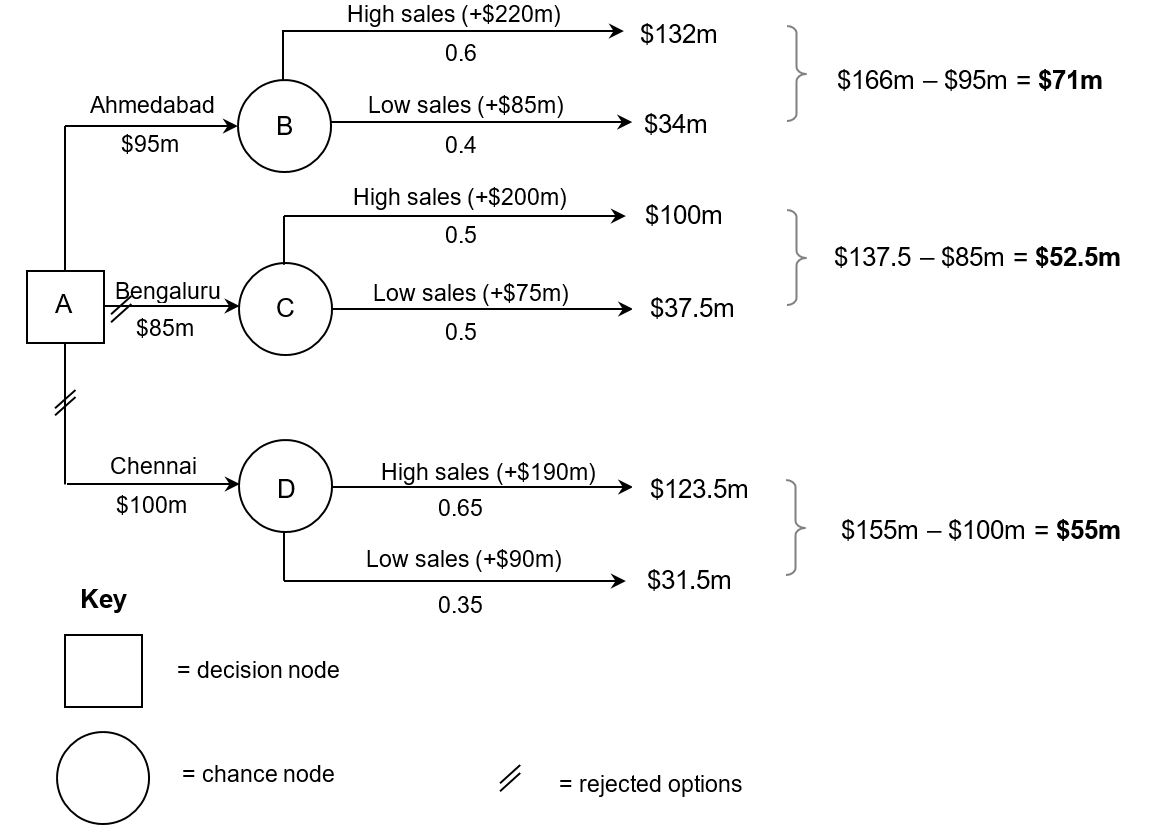
| (a) | Construct a decision tree diagram for BAS, showing which location is best on financial grounds. Show all your working and include an appropriate key in your diagram. | [6 marks] |
| (b) | Comment on the findings shown in the decision tree. | [2 marks] |
Answers
(a) Construct a decision tree diagram for BAS, showing which location is best on financial grounds. Show all your working and include an appropriate key in your diagram. [6 marks]
Award [1 to 2 marks] if there is some evidence of a general knowledge of decision trees, but it is not accurately constructed. The calculations of each option are not all presented or are inaccurate.
Award [3 to 4 marks] if the main elements of the decision tree are constructed, but may not be entirely accurate or the working may not be shown. For [4 marks], the calculations for each option are largely correct and presented clearly.
Award [5 to 6 marks] if the decision tree is accurately constructed. The calculations of each option are correct and well presented, with appropriate working out shown. For [6 marks], an appropriate key is provided.
(b) Comment on the findings shown in the decision tree. [2 marks]
The outcomes of the decision tree suggest shows that Ahmedabad is the best location to expand to, based on financial measures. Despite the relatively high cost compared to Bengaluru, there is a smaller chance of success should BAS choose to use expand there. Whilst Chennai has the highest chance of success (65%), the higher investment cost ($100m) and lower absolute return ($190m), mean that Ahmedabad is the best option, financially. Essentially, the lower cost investment ($95m vs $100m) yields a higher probable return ($71m vs $55m).
Award [1 mark] for an answer that shows some understanding of the demands of the question, but without clear application of the data in the decision tree.
Award [2 marks] for an answer that shows clear understanding of the demands of the question, with relevant use of the data in the decision tree.
Exam Practice Question 4 - Harris Bike Co. (HBC)
Harris Bike Co. (HBC) manufactures bicycles in large factory. Data suggest that there is a 45% chance of the economy improving during the next three years, with a 35% chance of the economy remaining unchanged, and a 20% chance of economic conditions worsening. Hence, HBC is considering three growth options:
Option 1: Launch a new line of foldable bikes, costing an estimated $2.5 million.
Option 2: Build a new factory to increase the productive capacity of its existing bikes, costing an estimated $4.5 million.
Option 3: Diversify by building skateboards to add to its current product portfolio costing an estimated $1.5 million.
The estimated costs and profit or loss of these options are shown below.
Economic outlook | Option 1 | Option 2 ($m) | Option 3 ($m) |
Improves | 5 | 8 | 3 |
Unchanged | 3 | 5 | 2 |
Worsens | 2 | 3 | -1 |
| (a) | Construct a decision tree diagram for HBC and calculate the predicted outcome for each option. | [6 marks] |
| (b) | Based on your decision tree, comment on which option HBC should pursue. | [2 marks] |
Answers
(a) Construct a decision tree diagram for HBC and calculate the predicted outcome for each option. [6 marks]
.jpg)
Award [1 - 2 marks] if there is some evidence of a general knowledge of decision trees, but it is not accurately constructed. The calculations of each option are not all presented or are inaccurate.
Award [3 - 4 marks] if the main elements of the decision tree are constructed, but may not be entirely accurate or the working may not be shown. For [4 marks], the calculations for each option are largely correct and presented clearly.
Award [5 - 6 marks] if the decision tree is accurately constructed. The calculations of each option are correct and well presented, with appropriate working out shown. For [6 marks], an appropriate key is provided.
(b) Based on your decision tree, comment on which option HBC should pursue. [2 marks]
Findings shown in the decision tree suggest shows that HBC ought to pursue Option 2, i.e., build a new factory to improve its productive capacity. Despite being the most expensive option, the potential return of $8m is the highest of the three options, if the economy improves. Similarly, of the 3 options, even if the economy sees no change or improvement, the expected return from Option 2 is still the highest at $5m.
Award [1 mark] for an answer that shows some understanding of the demands of the question, but without clear application of the data in the decision tree.
Award [2 marks] for an answer that shows clear understanding of the demands of the question, with relevant use of the data in the decision tree.
Return to the Business Management Toolkit (BMT) homepage
![]()
 Twitter
 Facebook
 LinkedIn