| Date | May 2019 | Marks available | 3 | Reference code | 19M.1.AHL.TZ1.H_8 |
| Level | Additional Higher Level | Paper | Paper 1 (without calculator) | Time zone | Time zone 1 |
| Command term | Sketch | Question number | H_8 | Adapted from | N/A |
Question
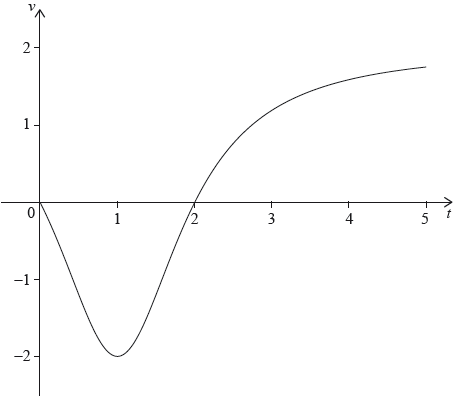
The graph of y=f′(x), 0 ≤ x ≤ 5 is shown in the following diagram. The curve intercepts the x-axis at (1, 0) and (4, 0) and has a local minimum at (3, −1).

The shaded area enclosed by the curve y=f′(x), the x-axis and the y-axis is 0.5. Given that f(0)=3,
The area enclosed by the curve y=f′(x) and the x-axis between x=1 and x=4 is 2.5 .
Write down the x-coordinate of the point of inflexion on the graph of y=f(x).
find the value of f(1).
find the value of f(4).
Sketch the curve y=f(x), 0 ≤ x ≤ 5 indicating clearly the coordinates of the maximum and minimum points and any intercepts with the coordinate axes.
Markscheme
* This question is from an exam for a previous syllabus, and may contain minor differences in marking or structure.
3 A1
[1 mark]
attempt to use definite integral of f′(x) (M1)
∫10f′(x)dx=0.5
f(1)−f(0)=0.5 (A1)
f(1)=0.5+3
= 3.5 A1
[3 marks]
∫41f′(x)dx=−2.5 (A1)
Note: (A1) is for −2.5.
f(4)−f(1)=−2.5
f(4)=3.5−2.5
= 1 A1
[2 marks]
 A1A1A1
A1 for correct shape over approximately the correct domain
A1 for maximum and minimum (coordinates or horizontal lines from 3.5 and 1 are required),
A1 for y-intercept at 3
[3 marks]
Examiners report
Syllabus sections
-
18M.2.SL.TZ1.S_4a:
Write down the coordinates of the vertex of the graph of g.
-
18M.2.SL.TZ2.S_9a:
Find the initial velocity of P.
-
18M.2.SL.TZ2.S_9d:
Find the acceleration of P when it changes direction.
-
19M.1.SL.TZ1.S_7b:
Find the total distance travelled in the first 5 seconds.
-
19M.2.SL.TZ2.S_8c:
Find the value of t when particle A first changes direction.
-
18M.2.SL.TZ1.S_4b:
On the grid above, sketch the graph of g for −2 ≤ x ≤ 4.
-
21N.1.SL.TZ0.7b:
Sketch a graph of v against t, clearly showing any points of intersection with the axes.
-
18M.3.AHL.TZ0.Hca_3c:
Hence write down a lower bound for ∞∑n=41n3.
-
18M.2.SL.TZ1.T_2a:
State the alternative hypothesis.
-
18M.2.SL.TZ1.T_2d.i:
Write down the χ2 statistic.
-
18M.2.SL.TZ1.T_2d.ii:
Write down the associated p-value.
-
18M.2.SL.TZ2.T_1c.i:
Find the value of x.
-
18M.2.SL.TZ1.T_5c:
Copy the probability tree diagram and write down the relevant probabilities along the branches.
-
18M.2.SL.TZ1.T_5e:
120 contestants attempted this game.
Find the expected number of contestants who fell into a trap while attempting to pass through a door in the third wall.
-
19M.2.SL.TZ2.T_1c.i:
the expected frequency of female students who chose to take the Chinese class.
-
16N.2.SL.TZ0.S_9b:
Find the value of p.
-
17M.2.SL.TZ1.S_7a.i:
Write down the first value of t at which P changes direction.
-
17M.2.SL.TZ1.S_7a.ii:
Find the total distance travelled by P, for 0⩽t⩽8.
-
18M.2.SL.TZ1.T_5a:
Write down the probability that Ayako avoids the trap in this wall.
-
17N.2.SL.TZ0.S_9b:
Hence or otherwise, find all possible values of t for which the velocity of P is decreasing.
-
17N.1.SL.TZ0.T_7a:
Complete the Venn diagram for these students.
-
19M.1.SL.TZ2.T_5a:
Using the given information, complete the following Venn diagram.

-
18N.2.SL.TZ0.T_2b.i:
Write down n(S∩(M∪B)).
-
18N.2.SL.TZ0.T_2b.ii:
Write down n(B∩M∩S′).
-
18M.2.SL.TZ2.S_9e:
Find the total distance travelled by P.
-
SPM.2.AHL.TZ0.11a:
Show that t + 1 is an integrating factor for this differential equation.
-
18M.2.SL.TZ2.T_1c.ii:
Find the value of y.
-
17M.2.SL.TZ1.S_10b.i:
Find ∫3.310.111(h(x)−x)dx.
-
19N.1.SL.TZ0.S_8a:
Write down an expression for y in terms of x.
-
SPM.2.AHL.TZ0.11d:
Find the value of t at which the amount of salt in the tank is decreasing most rapidly.
-
19N.1.SL.TZ0.S_8d.i:
Find the value of x for which V is a maximum.
-
17M.1.SL.TZ1.S_10b:
Given that tanθ>0, find tanθ.
-
19M.2.SL.TZ2.S_8d:
Find the total distance travelled by particle A in the first 3 seconds.
-
19M.2.SL.TZ2.T_1e.iii:
Find the probability that at least one of the two students is female.
-
19M.2.SL.TZ2.T_1c.ii:
the χ2 statistic.
-
17N.2.SL.TZ0.T_4g:
Estimate the number of employees, from this 38, who are allergic to nuts.
-
19M.2.SL.TZ2.T_1a:
Write down the null hypothesis, H0 , for this test.
-
16N.2.SL.TZ0.S_9a:
Find the initial velocity of P.
-
18M.2.SL.TZ2.T_1a.ii:
Write down the value of b.
-
18M.2.SL.TZ2.T_1d:
Find the number of employees who, in the last year, did not travel to work by car, bicycle or public transportation.
-
19M.1.SL.TZ1.T_12c:
Write down the probability that the second spin is yellow, given that the first spin is blue.
-
18N.2.SL.TZ0.T_2a.ii:
Find the number of students in the school that study Mathematics in English.
-
18M.1.SL.TZ2.T_7b:
Find the probability that the boy answered questions in Hindi.
-
18M.2.SL.TZ2.S_9b:
Find the maximum speed of P.
-
19M.1.SL.TZ2.S_10c:
Write down an expression for the area of R.
-
17N.2.SL.TZ0.S_5b:
The following diagram shows part of the graph of f.
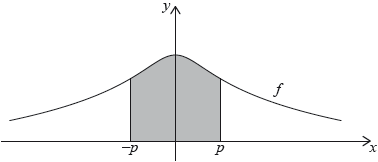
The region enclosed by the graph of f, the x-axis and the lines x=−p and x=p is rotated 360° about the x-axis. Find the volume of the solid formed.
-
18M.2.SL.TZ1.T_2g:
Given that this flight was not heavily delayed, find the probability that it travelled between 500 km and 5000 km.
-
17M.1.SL.TZ1.S_10c:
Let y=1cosx, for 0<x<π2. The graph of ybetween x=θ and x=π4 is rotated 360° about the x-axis. Find the volume of the solid formed.
-
16N.2.SL.TZ0.S_9c:
(i) Find the value of q.
(ii) Hence, find the speed of P when t=q.
-
18M.3.AHL.TZ0.Hca_3b:
Illustrate graphically the inequality ∞∑n=51n3<∞∫41x3dx<∞∑n=41n3.
-
19N.1.SL.TZ0.S_8b:
Find an expression for V in terms of x.
-
18M.1.SL.TZ1.S_5a:
Find ∫(f(x))2dx.
-
17N.2.SL.TZ0.T_4d:
Find the probability that this adult is allergic to nuts and the liquid turns blue.
-
17N.2.SL.TZ0.S_5a:
Find the value of p.
-
22M.1.SL.TZ1.2b:
Hence, find the value of ∫91(3√x-5√x)d.
-
18M.1.SL.TZ1.S_5b:
Part of the graph of f is shown in the following diagram.

The shaded region R is enclosed by the graph of f, the x-axis, and the lines x = 1 and x = 9 . Find the volume of the solid formed when R is revolved 360° about the x-axis.
-
19M.2.SL.TZ2.S_8e.i:
Given that particles A and B start at the same point, find the displacement function for particle B.
-
22M.1.AHL.TZ1.12b:
Hence, find an approximate value for .
-
20N.1.AHL.TZ0.H_12b:
State the equation of the horizontal asymptote on the graph of .
-
20N.1.AHL.TZ0.H_12d:
Sketch the graph of , stating clearly the equations of any asymptotes and the coordinates of any points of intersections with the coordinate axes.
-
20N.2.AHL.TZ0.H_3b:
Hence find the area of the shaded region.
-
17N.2.SL.TZ0.S_9a:
Write down the values of when .
-
18M.3.AHL.TZ0.Hca_3a:
Find the value of .
-
19M.1.AHL.TZ1.H_8b:
find the value of .
-
18M.2.SL.TZ2.S_3a:
Find the x-intercept of the graph of .
-
16N.2.SL.TZ0.S_4b:
Hence, find the area of the region enclosed by the graphs of and .
-
17N.1.SL.TZ0.S_8d:
Find the area of the region enclosed by the graph of and the line .
-
21M.2.SL.TZ1.9d.i:
Find the -coordinate of the point where intersects the line .
-
21M.2.SL.TZ1.9d.ii:
Hence, find the area of .
-
19M.1.SL.TZ2.S_10d:
Hence find the exact area of .
-
19M.2.SL.TZ2.S_8a:
Find the initial displacement of particle A from point P.
-
19M.2.SL.TZ2.S_8e.ii:
Find the other value of when particles A and B meet.
-
16N.2.SL.TZ0.S_6a:
Use the model to find the volume of the barrel.
-
20N.2.AHL.TZ0.H_3a:
Determine the values of , and .
-
19N.2.AHL.TZ0.H_11c:
The region is now rotated about the -axis, through radians, to form a solid.
By writing as , show that the volume of the solid formed is .
-
18M.2.SL.TZ2.S_3b:
The region enclosed by the graph of , the y-axis and the x-axis is rotated 360° about the x-axis.
Find the volume of the solid formed.
-
19M.2.SL.TZ2.S_2b:
The region enclosed by the graph of , the -axis and the -axis is rotated 360º about the -axis. Find the volume of the solid formed.
-
18M.2.SL.TZ2.S_9c:
Write down the number of times that the acceleration of P is 0 m s−2 .
-
19N.1.SL.TZ0.S_8e:
Find the maximum volume.
-
19N.1.SL.TZ0.S_8d.ii:
Justify your answer.
-
17N.2.SL.TZ0.S_9d:
Find the total distance travelled by P when its velocity is increasing.
-
19N.1.SL.TZ0.S_8c:
Find .
-
19M.1.AHL.TZ1.H_8c:
find the value of .
-
SPM.2.AHL.TZ0.11c:
Sketch the graph of versus for 0 ≤ ≤ 60 and hence find the maximum amount of salt in the tank and the value of at which this occurs.
-
19M.2.SL.TZ2.S_2a:
Find the -intercept of the graph of .
-
21M.2.SL.TZ1.1a:
Find .
-
17M.2.SL.TZ1.S_10a.i:
Write down the value of ;
-
22M.2.SL.TZ2.2:
The derivative of a function is given by , where . The graph of passes through the point . Find .
-
21N.1.SL.TZ0.7c:
Find the total distance travelled by .
-
21N.1.SL.TZ0.7a.ii:
Show that the distance of from at this time is metres.
-
22M.1.AHL.TZ1.1:
Find the value of .
-
18M.1.SL.TZ2.T_7a:
State the number of boys who answered questions in Portuguese.
-
19M.1.SL.TZ1.T_12a:
Find the probability that both spins are yellow.
-
17N.1.SL.TZ0.T_7b:
One of the students who joined the sports club is chosen at random. Find the probability that this student joined both clubs.
-
16N.2.SL.TZ0.T_2d:
Find the probability that this person
(i) went on at most one trip;
(ii) went on the coach trip, given that this person also went on both the helicopter trip and the boat trip.
-
19M.1.SL.TZ2.T_5c:
A student is chosen at random from the surveyed students.
Find the probability that this student likes kiwi fruit smoothies given that they like mango smoothies.
-
18M.2.SL.TZ1.T_2e:
State, with a reason, whether you would reject the null hypothesis.
-
17N.1.SL.TZ0.T_7c:
Determine whether the events and are independent.
-
16N.2.SL.TZ0.T_6b:
Express this volume in .
-
16N.2.SL.TZ0.T_6c:
Write down, in terms of and , an equation for the volume of this water container.
-
16N.2.SL.TZ0.T_6e:
Find .
-
16N.2.SL.TZ0.T_6f:
Using your answer to part (e), find the value of which minimizes .
-
SPM.2.AHL.TZ0.11b:
Hence, by solving this differential equation, show that .
-
19M.2.SL.TZ2.S_8b:
Find the value of when particle A first reaches point P.
-
17N.2.SL.TZ0.S_9c:
Find an expression for the velocity of P at time .
-
18M.2.SL.TZ1.T_2h:
Two flights are chosen at random from those which were slightly delayed.
Find the probability that each of these flights travelled at least 5000 km.
-
SPM.2.AHL.TZ0.11e:
The rate of change of the amount of salt leaving the tank is equal to .
Find the amount of salt that left the tank during the first 60 minutes.
-
18M.2.SL.TZ1.S_4c:
Find the area of the region enclosed by the graphs of f and g.
-
17M.2.SL.TZ2.S_7:
Note: In this question, distance is in metres and time is in seconds.
A particle moves along a horizontal line starting at a fixed point A. The velocity of the particle, at time , is given by , for . The following diagram shows the graph of
There are -intercepts at and .
Find the maximum distance of the particle from A during the time and justify your answer.
-
17M.1.SL.TZ1.S_10a:
Show that .
-
20N.1.AHL.TZ0.H_12a:
State the equation of the vertical asymptote on the graph of .
-
20N.1.AHL.TZ0.H_12c:
Use an algebraic method to determine whether is a self-inverse function.
-
19N.1.AHL.TZ0.H_10c:
Show that .
-
19M.1.SL.TZ2.S_10b:
Hence find .
-
20N.1.AHL.TZ0.H_12e:
The region bounded by the -axis, the curve , and the lines and is rotated through about the -axis. Find the volume of the solid generated, giving your answer in the form , where .
-
17M.2.SL.TZ1.S_7b:
A second particle Q also moves along a straight line. Its velocity, after seconds is given by for . After seconds Q has travelled the same total distance as P.
Find .
-
16N.2.SL.TZ0.S_4a:
Find the value of and of .
-
19N.2.AHL.TZ0.H_11b:
Find the area of .
-
18N.2.SL.TZ0.T_2c.iii:
Find the probability that this student is taught in Spanish, given that the student studies Biology.
-
19N.1.AHL.TZ0.H_10d:
The area enclosed by the graph of and the line can be expressed as . Find the value of .
-
18M.3.AHL.TZ0.Hca_3d:
Find an upper bound for .
-
19M.1.SL.TZ1.S_7a:
Find the value of .
-
18M.2.SL.TZ1.T_2b:
Calculate the expected frequency of flights travelling at most 500 km and arriving slightly delayed.
-
16N.2.SL.TZ0.S_9d:
(i) Find the total distance travelled by P between and .
(ii) Hence or otherwise, find the displacement of P from A when .
-
21M.2.SL.TZ1.1b:
Given and , find .
-
17M.2.SL.TZ1.S_10a.iii:
Write down the value of .
-
17M.2.SL.TZ1.S_10c:
Let be the vertical distance from a point on the graph of to the line . There is a point on the graph of where is a maximum.
Find the coordinates of P, where .
-
17M.2.SL.TZ1.S_10a.ii:
Write down the value of ;
-
17M.2.SL.TZ1.S_10b.ii:
Hence, find the area of the region enclosed by the graphs of and .
-
18N.2.SL.TZ0.T_2a.i:
Find the number of students in the school that are taught in Spanish.
-
18N.2.SL.TZ0.T_2a.iii:
Find the number of students in the school that study both Biology and Mathematics.
-
19M.2.SL.TZ2.T_1d:
State whether or not H0 should be rejected. Justify your statement.
-
17N.2.SL.TZ0.T_4c:
Copy and complete the tree diagram.
-
18M.2.SL.TZ1.T_2c:
Write down the number of degrees of freedom.
-
19M.1.SL.TZ2.T_5b:
Find the number of surveyed students who did not like any of the three flavours.
-
18M.2.SL.TZ1.T_5d.ii:
A contestant is chosen at random. Find the probability that this contestant fell into a trap.
-
18N.2.SL.TZ0.T_2c.i:
Find the probability that this student studies Mathematics.
-
19M.2.SL.TZ2.T_1e.i:
Find the probability that the student does not take the Spanish class.
-
16N.2.SL.TZ0.T_2b:
Show that .
-
18M.2.SL.TZ1.T_5d.i:
A contestant is chosen at random. Find the probability that this contestant fell into a trap while attempting to pass through a door in the second wall.
-
18M.1.SL.TZ2.T_7c:
Two girls are selected at random.
Calculate the probability that one girl answered questions in Mandarin and the other answered questions in Hindi.
-
19M.1.SL.TZ1.T_12b:
Find the probability that at least one of the spins is yellow.
-
17N.2.SL.TZ0.T_4e:
Find the probability that the liquid turns blue.
-
16N.2.SL.TZ0.T_6d:
Show that .
-
16N.2.SL.TZ0.T_6g:
Find the value of this minimum area.
-
21N.1.SL.TZ0.7a.i:
Find the value of when reaches its maximum velocity.
-
16N.2.SL.TZ0.T_6a:
Write down a formula for , the surface area to be coated.
-
16N.2.SL.TZ0.T_6h:
Find the least number of cans of water-resistant material that will coat the area in part (g).
-
18M.2.SL.TZ1.T_2f:
Write down the probability that this flight arrived on time.
-
19M.2.SL.TZ2.T_1e.ii:
Find the probability that neither of the two students take the Spanish class.
-
18M.2.SL.TZ2.T_1a.i:
Write down the value of a.
-
18M.2.SL.TZ2.T_1b.i:
Use the tree diagram to find the probability that an employee encountered traffic and was late for work.
-
18M.2.SL.TZ2.T_1b.ii:
Use the tree diagram to find the probability that an employee was late for work.
-
18M.2.SL.TZ2.T_1b.iii:
Use the tree diagram to find the probability that an employee encountered traffic given that they were late for work.
-
18M.2.SL.TZ2.T_1e:
Find .
-
16N.2.SL.TZ0.T_2a:
Draw a Venn diagram to represent the given information, using sets labelled , and .
-
16N.2.SL.TZ0.T_2c:
Write down the value of .
-
18N.2.SL.TZ0.T_2c.ii:
Find the probability that this student studies neither Biology nor Mathematics.
-
17N.2.SL.TZ0.T_4b:
Find the probability that both people chosen are not allergic to nuts.
-
17N.2.SL.TZ0.T_4f:
Find the probability that the tested adult is allergic to nuts given that the liquid turned blue.
-
18M.2.SL.TZ1.T_5b:
Find the probability that only one of Ayako and Natsuko falls into a trap while attempting to pass through a door in the first wall.
-
19M.2.SL.TZ2.T_1b:
State the number of degrees of freedom.