| Date | May 2017 | Marks available | 2 | Reference code | 17M.3.HL.TZ2.11 |
| Level | Higher level | Paper | Paper 3 | Time zone | 2 |
| Command term | Calculate | Question number | 11 | Adapted from | N/A |
Question
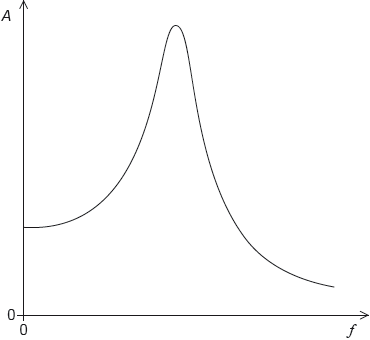
A driven system is lightly damped. The graph shows the variation with driving frequency f of the amplitude A of oscillation.
A mass on a spring is forced to oscillate by connecting it to a sine wave vibrator. The graph shows the variation with time t of the resulting displacement y of the mass. The sine wave vibrator has the same frequency as the natural frequency of the spring–mass system.

On the graph, sketch a curve to show the variation with driving frequency of the amplitude when the damping of the system increases.
State and explain the displacement of the sine wave vibrator at t = 8.0 s.
The vibrator is switched off and the spring continues to oscillate. The Q factor is 25.
Calculate the ratio for the oscillations of the spring–mass system.
Markscheme
lower peak
identical behaviour to original curve at extremes
peak frequency shifted to the left

Award [0] if peak is higher.
For MP2 do not accept curves which cross.
[2 marks]
displacement of vibrator is 0
because phase difference is or 90º or period
Do not penalize sign of phase difference.
Do not accept for MP2
[2 marks]
resonant f = 0.125 « Hz »
= 32 «s»
Watch for ECF from MP1 to MP2.
[2 marks]
Examiners report
Syllabus sections
- 17N.3.HL.TZ0.12b: Outline what change would be required to the value of Q for the mass–spring system in order...
-
19M.3.HL.TZ1.11b:
Another system has the same initial total energy and period as that in (a) but its Q factor is greater than 25. Without any calculations, draw on the graph, the variation with time of the total energy of this system.
- 16N.3.HL.TZ0.14b: The system is critically damped. Draw, on the graph, the variation of the displacement with...
-
18M.3.HL.TZ2.11b:
The Q factor for the system is reduced significantly. Describe how the graph you drew in (a) changes.
-
17M.3.HL.TZ1.10c:
The Q factor of the system increases. State and explain the change to the graph.
-
19N.3.HL.TZ0.10c:
The point of suspension now vibrates horizontally with small amplitude and frequency 0.80 Hz, which is the natural frequency of the pendulum. The amount of damping is unchanged.

When the pendulum oscillates with a constant amplitude the energy stored in the system is 20 mJ. Calculate the average power, in W, delivered to the pendulum by the driving force.
-
18N.3.HL.TZ0.11a:
State and explain the direction of motion of the mass at this instant.
-
17M.3.HL.TZ2.11a:
On the graph, sketch a curve to show the variation with driving frequency of the amplitude when the damping of the system increases.
-
17M.3.HL.TZ1.10a:
State what is meant by damping.
-
19M.3.HL.TZ2.14a:
Show that, when the speed of the train is 10 m s-1, the frequency of the periodic force is 0.4 Hz.
- 19M.3.HL.TZ2.14b: Outline, with reference to the curve, why it is unsafe to drive a train across the bridge at...
- 19M.3.HL.TZ2.14c: The damping of the bridge system can be varied. Draw, on the graph, a second curve when the...
-
16N.3.HL.TZ0.14a:
Explain, with reference to energy in the system, the amplitude of oscillation between
(i) t = 0 and tA.
(ii) tA and tB.
-
20N.3.HL.TZ0.12c(ii):
The sphere oscillates vertically within the oil at the natural frequency of the sphere-spring system. The energy is reduced in each cycle by . Calculate the factor for this system.
-
19N.3.HL.TZ0.10b:
After one complete oscillation, the height of the pendulum bob above the rest position has decreased to 28 mm. Calculate the Q factor.
- 19N.3.HL.TZ0.10a: Describe what is meant by damped motion.
-
19M.3.HL.TZ1.11a:
The Q factor for the system is 25. Determine the period of oscillation for this system.
-
18M.3.HL.TZ1.11a:
Describe the motion of the spring-mass system.
-
18N.3.HL.TZ0.11b:
The oscillator is switched off. The system has a Q factor of 22. The initial amplitude is 10 cm. Determine the amplitude after one complete period of oscillation.
-
18M.3.HL.TZ1.11b.ii:
calculate the Q at the start of the motion.
-
17N.3.HL.TZ0.12a:
Explain why it would be uncomfortable for the farmer to drive the vehicle at a speed of 5.6 m s–1.
-
17M.3.HL.TZ1.10b:
Calculate the Q factor for the system.
-
18M.3.HL.TZ2.11a:
Draw a graph to show the variation of amplitude of oscillation of the system with frequency.

-
17M.3.HL.TZ2.11b.i:
State and explain the displacement of the sine wave vibrator at t = 8.0 s.