
SL Paper 3
The circuit shown may be used to measure the internal resistance of a cell.
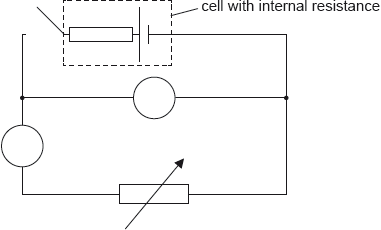
The ammeter used in the experiment in (b) is an analogue meter. The student takes measurements without checking for a “zero error” on the ammeter.
An ammeter and a voltmeter are connected in the circuit. Label the ammeter with the letter A and the voltmeter with the letter V.
In one experiment a student obtains the following graph showing the variation with current I of the potential difference V across the cell.
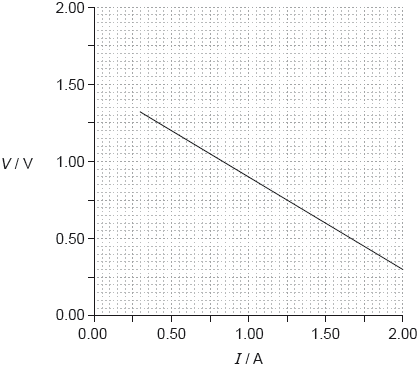
Using the graph, determine the best estimate of the internal resistance of the cell.
State what is meant by a zero error.
After taking measurements the student observes that the ammeter has a positive zero error. Explain what effect, if any, this zero error will have on the calculated value of the internal resistance in (b).
An electrical circuit is used during an experiment to measure the current I in a variable resistor of resistance R. The emf of the cell is e and the cell has an internal resistance r.

A graph shows the variation of with R.

Show that the gradient of the graph is equal to .
State the value of the intercept on the R axis.
A student investigates the electromotive force (emf) ε and internal resistance r of a cell.

The current I and the terminal potential difference V are measured.
For this circuit V = ε - Ir .
The table shows the data collected by the student. The uncertainties for each measurement
are shown.

The graph shows the data plotted.

The student has plotted error bars for the potential difference. Outline why no error bars are shown for the current.
Determine, using the graph, the emf of the cell including the uncertainty for this value. Give your answer to the correct number of significant figures.
Outline, without calculation, how the internal resistance can be determined from this graph.
The resistance R of a wire of length L can be measured using the circuit shown.

In one experiment the wire has a uniform diameter of d = 0.500 mm. The graph shows data obtained for the variation of R with L.

The gradient of the line of best fit is 6.30 Ω m–1.
Estimate the resistivity of the material of the wire. Give your answer to an appropriate number of significant figures.
Explain, by reference to the power dissipated in the wire, the advantage of the fixed resistor connected in series with the wire for the measurement of R.
The experiment is repeated using a wire made of the same material but of a larger diameter than the wire in part (a). On the axes in part (a), draw the graph for this second experiment.