
HL Paper 3
A mass-spring system is forced to vibrate vertically at the resonant frequency of the system. The motion of the system is damped using a liquid.

At time t=0 the vibrator is switched on. At time tB the vibrator is switched off and the system comes to rest. The graph shows the variation of the vertical displacement of the system with time until tB.

Explain, with reference to energy in the system, the amplitude of oscillation between
(i) t = 0 and tA.
(ii) tA and tB.
The system is critically damped. Draw, on the graph, the variation of the displacement with time from tB until the system comes to rest.
Markscheme
i
amplitude is increasing as energy is added
ii
energy input = energy lost due to damping
curve from time tB reaching zero displacement
in no more than one cycle

Award zero if displacement after tB goes to negative values.
Examiners report
A ball is moving in still air, spinning clockwise about a horizontal axis through its centre. The diagram shows streamlines around the ball.
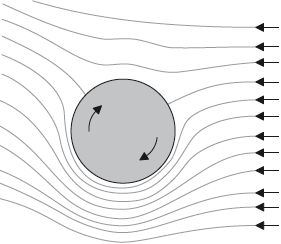
The surface area of the ball is 2.50 x 10⁻² m2. The speed of air is 28.4 ms–1 under the ball and 16.6 ms–1 above the ball. The density of air is 1.20 kgm–3.
Estimate the magnitude of the force on the ball, ignoring gravity.
On the diagram, draw an arrow to indicate the direction of this force.
State one assumption you made in your estimate in (a)(i).
Markscheme
Δp = «» 318.6 «Pa»
F = «» 1.99 «N»
Allow ECF from MP1.
[2 marks]
downward arrow of any length or position
Accept any downward arrow not just vertical.

[1 mark]
flow is laminar/non-turbulent
OR
Bernoulli’s equation holds
OR
pressure is uniform on each hemisphere
OR
diameter of ball can be ignored /ρgz = constant
[1 mark]
Examiners report
The graph below shows the displacement y of an oscillating system as a function of time t.

State what is meant by damping.
Calculate the Q factor for the system.
The Q factor of the system increases. State and explain the change to the graph.
Markscheme
the loss of energy in an oscillating system
[1 mark]
Accept calculation based on any two correct values giving answer from interval 10 to 13.
[1 mark]
the amplitude decreases at a slower rate
a higher Q factor would mean that less energy is lost per cycle
[2 marks]
Examiners report
A solid cube of side 0.15 m has an average density of 210 kg m–3.
(i) Calculate the weight of the cube.
(ii) The cube is placed in gasoline of density 720 kg m–3. Calculate the proportion of the volume of the cube that is above the surface of the gasoline.
Water flows through a constricted pipe. Vertical tubes A and B, open to the air, are located along the pipe.

Describe why tube B has a lower water level than tube A.
Markscheme
i
Fweight = «ρgVcube = 210×9.81×0.153 =» 6.95«N»
ii
Fbuoyancy = 6.95 = ρgV gives V = 9.8×10−4
=0.29 so 0.71 or 71% of the cube is above the gasoline
Award [2] for a bald correct answer.
«from continuity equation» v is greater at B
OR
area at B is smaller thus «from continuity equation» velocity at B is greater
increase in speed leads to reduction in pressure «through Bernoulli effect»
pressure related to height of column
OR
p=gh
Examiners report
An air bubble has a radius of 0.25 mm and is travelling upwards at its terminal speed in a liquid of viscosity 1.0 × 10⁻³ Pa s.
The density of air is 1.2 kg m–3 and the density of the liquid is 1200 kg m–3.

Explain the origin of the buoyancy force on the air bubble.
With reference to the ratio of weight to buoyancy force, show that the weight of the air bubble can be neglected in this situation.
Calculate the terminal speed.
Markscheme
ALTERNATIVE 1
pressure in a liquid increases with depth
so pressure at bottom of bubble greater than pressure at top
ALTERNATIVE 2
weight of liquid displaced
greater than weight of bubble
[2 marks]
since the ratio is very small, the weight can be neglected
Award [1 max] if only mass of the bubble is calculated and identified as negligible to mass of liquid displaced.
[2 marks]
evidence of equating the buoyancy and the viscous force «»
vt = «» 0.16 «ms–1»
[2 marks]
Examiners report
A sphere is dropped into a container of oil.
The following data are available.
Density of oil
Viscosity of oil
Volume of sphere
Mass of sphere
The sphere is now suspended from a spring so that the sphere is below the surface of the oil.
State two properties of an ideal fluid.
Determine the terminal velocity of the sphere.
Determine the force exerted by the spring on the sphere when the sphere is at rest.
The sphere oscillates vertically within the oil at the natural frequency of the sphere-spring system. The energy is reduced in each cycle by . Calculate the factor for this system.
Outline the effect on of changing the oil to one with greater viscosity.
Markscheme
incompressible ✓
non-viscous ✓
laminar/streamlined flow ✓
radius of sphere ✓
weight of sphere
OR
✓
✓
Accept use of leading to
Allow implicit calculation of radius for MP1
Do not allow ECF for MP3 if buoyant force omitted.
OR
✓
✓
Accept use of leading to
✓
drag force increases OR damping increases OR more energy lost per cycle ✓
will decrease ✓
Examiners report
The properties of fluids proved to be a very well-studied topic.
Only those candidates who forgot to include the buoyant force missed marks here.
Continuing from b, most candidates scored full marks.
The calculation needed to obtain the Q-factor proved to be known by many.
Very well answered.
The graph below represents the variation with time t of the horizontal displacement x of a mass attached to a vertical spring.
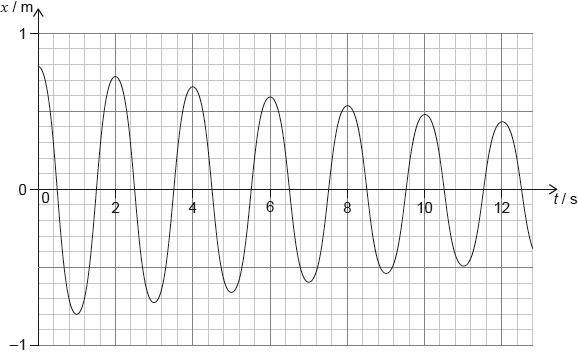
The total mass for the oscillating system is 30 kg. For this system
Describe the motion of the spring-mass system.
determine the initial energy.
calculate the Q at the start of the motion.
Markscheme
damped oscillation / OWTTE
[1 mark]
E «= × 30 × π2 × 0.82» = 95 «J»
Allow initial amplitude between 0.77 to 0.80, giving range between: 88 to 95 J.
[1 mark]
ΔE = 95 – × 30 × π2 × 0.722 = 18 «J»
Q = « 2π =» 33
Accept values between 0.70 and 0.73, giving a range of ΔE between 22 and 9, giving Q between 27 and 61.
Watch for ECF from (b)(i).
[2 marks]
Examiners report
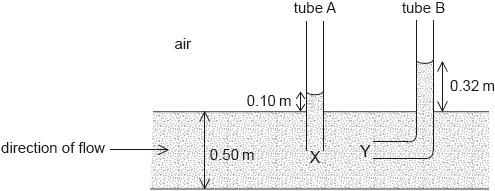
Two tubes, A and B, are inserted into a fluid flowing through a horizontal pipe of diameter 0.50 m. The openings X and Y of the tubes are at the exact centre of the pipe. The liquid rises to a height of 0.10 m in tube A and 0.32 m in tube B. The density of the fluid = 1.0 × 10³ kg m–3.
The viscosity of water is 8.9 × 10⁻⁴ Pa s.
Show that the velocity of the fluid at X is about 2 ms–1, assuming that the flow is laminar.
Estimate the Reynolds number for the fluid in your answer to (a).
Outline whether your answer to (a) is valid.
Markscheme
vX =
vx = 2.08 «ms–1»
[3 marks]
R = «» 5.9 × 10⁵
[1 mark]
(R > 1000) flow is not laminar, so assumption is invalid
OWTTE
[1 mark]
Examiners report
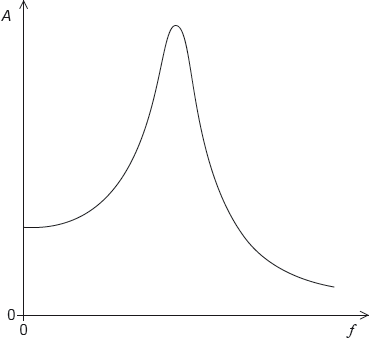
A driven system is lightly damped. The graph shows the variation with driving frequency f of the amplitude A of oscillation.
A mass on a spring is forced to oscillate by connecting it to a sine wave vibrator. The graph shows the variation with time t of the resulting displacement y of the mass. The sine wave vibrator has the same frequency as the natural frequency of the spring–mass system.

On the graph, sketch a curve to show the variation with driving frequency of the amplitude when the damping of the system increases.
State and explain the displacement of the sine wave vibrator at t = 8.0 s.
The vibrator is switched off and the spring continues to oscillate. The Q factor is 25.
Calculate the ratio for the oscillations of the spring–mass system.
Markscheme
lower peak
identical behaviour to original curve at extremes
peak frequency shifted to the left

Award [0] if peak is higher.
For MP2 do not accept curves which cross.
[2 marks]
displacement of vibrator is 0
because phase difference is or 90º or period
Do not penalize sign of phase difference.
Do not accept for MP2
[2 marks]
resonant f = 0.125 « Hz »
= 32 «s»
Watch for ECF from MP1 to MP2.
[2 marks]
Examiners report
The diagram shows a simplified model of a Galilean thermometer. The thermometer consists of a sealed glass cylinder that contains ethanol, together with glass spheres. The spheres are filled with different volumes of coloured water. The mass of the glass can be neglected as well as any expansion of the glass through the temperature range experienced. Spheres have tags to identify the temperature. The mass of the tags can be neglected in all calculations.

Each sphere has a radius of 3.0 cm and the spheres, due to the different volumes of water in them, are of varying densities. As the temperature of the ethanol changes the individual spheres rise or fall, depending on their densities, compared with that of the ethanol.
The graph shows the variation with temperature of the density of ethanol.

Using the graph, determine the buoyancy force acting on a sphere when the ethanol is at a temperature of 25 °C.
When the ethanol is at a temperature of 25 °C, the 25 °C sphere is just at equilibrium. This sphere contains water of density 1080 kg m–3. Calculate the percentage of the sphere volume filled by water.
The room temperature slightly increases from 25 °C, causing the buoyancy force to decrease. For this change in temperature, the ethanol density decreases from 785.20 kg m–3 to 785.16 kg m–3. The average viscosity of ethanol over the temperature range covered by the thermometer is 0.0011 Pa s. Estimate the steady velocity at which the 25 °C sphere falls.
Markscheme
density = 785 «kgm−3»
« =» 0.87 «N»
Accept answer in the range 784 to 786
OR
OR
0.727 or 73%
Allow ECF from (a)(i)
use of drag force to obtain r3 x 0.04 x g = 6 x x 0.0011 x r x v
v = 0.071 «ms–1»
Examiners report
The water supply for a hydroelectric plant is a reservoir with a large surface area. An outlet pipe takes the water to a turbine.
The following data are available:
State the difference in terms of the velocity of the water between laminar and turbulent flow.
The water level is a height H above the turbine. Assume that the flow is laminar in the outlet pipe.
Show, using the Bernouilli equation, that the speed of the water as it enters the turbine is given by v = .
Calculate the Reynolds number for the water flow.
Outline whether it is reasonable to assume that flow is laminar in this situation.
Markscheme
in laminar flow, the velocity of the fluid is constant «at any point in the fluid» «whereas it is not constant for turbulent flow»
Accept any similarly correct answers.
[1 mark]
PS = PT «as both are exposed to atmospheric pressure»
then VT = 0 «if the surface area ofthe reservoir is large»
« + ρgzS = ρgzT»
= g(zT – zS) = gH
and so vS =
MP1 and MP2 may be implied by the correct substitution showing line 3 in the mark scheme.
Do not accept simple use of v = .
[3 marks]
R = = 2.72 × 10⁷
Accept use of radius 0.3 m giving value 1.36 × 10⁷.
[1 mark]
as R > 1000 it is not reasonable to assume laminar flow
[1 mark]
Examiners report
A railway track passes over a bridge that has a span of 20 m.

The bridge is subject to a periodic force as a train crosses, this is caused by the weight of the train acting through the wheels as they pass the centre of the bridge.
The wheels of the train are separated by 25 m.
The graph shows the variation of the amplitude of vibration A of the bridge with driving frequency fD, when the damping of the bridge system is small.

Show that, when the speed of the train is 10 m s-1, the frequency of the periodic force is 0.4 Hz.
Outline, with reference to the curve, why it is unsafe to drive a train across the bridge at 30 m s-1 for this amount of damping.
The damping of the bridge system can be varied. Draw, on the graph, a second curve when the damping is larger.
Markscheme
time period
T = «» = 2.5 s AND f =
OR
evidence of f = ✔
Answer 0.4 Hz is given, check correct working is shown.
30 m s–1 corresponds to f = 1.2 Hz ✔
the amplitude of vibration is a maximum for this speed
OR
corresponds to the resonant frequency ✔
similar shape with lower amplitude ✔
maximum shifted slightly to left of the original curve ✔
Amplitude must be lower than the original, but allow the amplitude to be equal at the extremes.
Examiners report
The question was correctly answered by almost all candidates.
The answers to this question were generally well presented and a correct argument was presented by almost all candidates. Resonance was often correctly referred to.
A correct curve, with lower amplitude and shifted left, was drawn by most candidates.
A mass is attached to a vertical spring. The other end of the spring is attached to the driver of an oscillator.

The mass is performing very lightly damped harmonic oscillations. The frequency of the driver is higher than the natural frequency of the system. At one instant the driver is moving downwards.
State and explain the direction of motion of the mass at this instant.
The oscillator is switched off. The system has a Q factor of 22. The initial amplitude is 10 cm. Determine the amplitude after one complete period of oscillation.
Markscheme
because the mass and the driver are out of phase «by » ✔
so upwards ✔
Justification needed for MP2
ALTERNATIVE 1:
«» ⇒
« =» A1 = 8.5 «cm»
ALTERNATIVE 2:
driver amplitude is constant ✔
so mass amplitude is unchanged at 10 cm ✔
Examiners report
A pendulum bob is displaced until its centre is 30 mm above its rest position and then released. The motion of the pendulum is lightly damped.

Describe what is meant by damped motion.
After one complete oscillation, the height of the pendulum bob above the rest position has decreased to 28 mm. Calculate the Q factor.
The point of suspension now vibrates horizontally with small amplitude and frequency 0.80 Hz, which is the natural frequency of the pendulum. The amount of damping is unchanged.

When the pendulum oscillates with a constant amplitude the energy stored in the system is 20 mJ. Calculate the average power, in W, delivered to the pendulum by the driving force.
Markscheme
a situation in which a resistive force opposes the motion
OR
amplitude/energy decreases with time ✔
✔
✔
power added = «W» ✔
Examiners report
Gasoline of density 720 kg m–3 flows in a pipe of constant diameter.

State one condition that must be satisfied for the Bernoulli equation
ρv2 + ρgz + ρ = constant
to apply
Outline why the speed of the gasoline at X is the same as that at Y.
Calculate the difference in pressure between X and Y.
The diameter at Y is made smaller than that at X. Explain why the pressure difference between X and Y will increase.
Markscheme
flow must be laminar/steady/not turbulent ✔
fluid must be incompressible/have constant density ✔
fluid must be non viscous ✔
«continuity equation says» Av = constant «and the areas are the same» ✔
Bernoulli: « + 0 + Px = + pgH + Py » gives Px − Py = pgH ✔
Px − Py = 720 × 9.81 × 1.2 = 8.5 «kPa» ✔
Award [2] for bald correct answer.
Watch for POT mistakes.
the fluid speed at Y will be greater «than that at X» ✔
reducing the pressure at Y
OR
the formula used to show that the difference is increased ✔
Examiners report
Gasoline in a pipe. In a), most of the candidates well noted that for the Bernoulli equation, the fluid must be” non-viscous”, some noted, “laminar” and a few, “incompressible”. Some students stated vaguer and less concrete responses such as “the fluid must be ideal”.
In b) most candidates well noted and understood the application of the continuity equation.
In b) most candidates well noted and understood the application of the continuity equation and successfully went on to correctly calculate the pressure difference.
Sub-question iii) well discriminated between the better and weaker candidates. As weaker candidates often wrote that “lower diameter means higher pressure” without a direct reference to the greater speed at Y implying reduced pressure.
A solid sphere is released from rest below the surface of a fluid and begins to fall.
Draw and label the forces acting on the sphere at the instant when it is released.

Explain why the sphere will reach a terminal speed.
The weight of the sphere is 6.16 mN and the radius is 5.00 × 10⁻³ m. For a fluid of density 8.50 × 10² kg m-3, the terminal speed is found to be 0.280 m s-1. Calculate the viscosity of the fluid.
Markscheme

Both forces must be suitably labeled.
Do not accept just ‘gravity’
Award [0] if a third force is shown.
«as the ball falls» there is a drag force ✔
when drag force+buoyant force/upthrust =«-» weight
OR
When net/resultant force =0 ✔
«terminal speed occurs»
OWTTE
Terminal speed is mentioned in the question, so no additional marks for reference to it.
any evidence (numerical or algebraic) of a realisation that
✔
«»
«Pas»✔
Examiners report
The question was generally well answered but many candidates did not realise that the drag force would only be present when the ball starts moving.
Many candidates could explain correctly that the drag force would increase as the speed increases and that the weight would be balanced by the buoyant force and the drag force.
When the condition for forces in equilibrium was correctly formed, many candidates managed to obtain the correct answer. The working was often poorly presented making it difficult to mark or award marks for the process.
The graph shows the variation with time t of the total energy E of a damped oscillating system.

The Q factor for the system is 25. Determine the period of oscillation for this system.
Another system has the same initial total energy and period as that in (a) but its Q factor is greater than 25. Without any calculations, draw on the graph, the variation with time of the total energy of this system.
Markscheme
ALTERNATIVE 1
« ✔
«mJ» ✔
reading off the graph, period is 0.48 «s» ✔
Allow correct use of any value of E0, not only at the time = 0.
Allow answer from interval 0.42−0.55 s
ALTERNATIVE 2
use of ✔
energy stored = 12 «mJ» AND power loss = 5.6 «mJ/s»✔
«f = 1.86 s so» period is 0.54 «s» ✔
Allow answer from interval 0.42−0.55 s.
Award [3] for bald correct answer.
similar shape graph starting at 12 mJ and above the original ✔
Examiners report
Q factor. Most of the candidates attempted to find the period of the damped system by using the correct formula.
Many thus went on to establish the correct period within the range given. Some candidates made POT errors not recognizing or identifying the unit used in this question.
A horizontal pipe is inserted into the cylindrical tube so that its centre is at a depth of 5.0 m from the surface of the water. The diameter D of the pipe is half that of the tube.

When the pipe is opened, water exits the pipe with speed u and the surface of the water in the tube moves downwards with speed v.
An ice cube floats in water that is contained in a tube.

The ice cube melts.
Suggest what happens to the level of the water in the tube.
Outline why u = 4v.
The density of water is 1000 kg m–3. Calculate u.
Markscheme
ice displaces its own weight of water / OWTTE
OR
melted ice volume equals original volume displaced / OWTTE ✔
no change will take place ✔
continuity equation says v × A1 = u × A2 ✔
«and» A1 = 4A2 ✔
«giving result»
Bernoulli:
«» gives ✔
u = 10.2 «m s–1» ✔
Accept solving directly via conservation of energy.
Examiners report
A farmer is driving a vehicle across an uneven field in which there are undulations every 3.0 m.

The farmer’s seat is mounted on a spring. The system, consisting of the mass of the farmer and the spring, has a natural frequency of vibration of 1.9 Hz.
Explain why it would be uncomfortable for the farmer to drive the vehicle at a speed of 5.6 m s–1.
Outline what change would be required to the value of Q for the mass–spring system in order for the drive to be more comfortable.
Markscheme
ALTERNATIVE 1
the time between undulations is = 0.536 «s»
f = = 1.87 «Hz»
«frequencies match» resonance occurs so amplitude of vibration becomes greater
Must see mention of “resonance” for MP3
ALTERNATIVE 2
f =
f = 1.87 «Hz»
«frequencies match» resonance occurs so amplitude of vibration becomes greater
Must see mention of “resonance” for MP3
«to increase damping» reduce Q
Examiners report
A Pitot tube shown in the diagram is used to determine the speed of air flowing steadily in a horizontal wind tunnel. The narrow tube between points A and B is filled with a liquid. At point B the speed of the air is zero.

Explain why the levels of the liquid are at different heights.
The density of the liquid in the tube is 8.7 × 10² kg m–3 and the density of air is 1.2 kg m–3. The difference in the level of the liquid is 6.0 cm. Determine the speed of air at A.
Markscheme
air speed at A greater than at B/speed at B is zero
OR
total/stagnation pressure «PB» – static pressure «PA» = dynamic pressure ✔
so PA is less than at PB (or vice versa) «by Bernoulli effect» ✔
height of the liquid column is related to «dynamic» pressure difference «hence lower height in arm B» ✔
«»
difference in pressure «Pa» ✔
correct substitution into the Bernoulli equation, eg: ✔
«ms–1» ✔
Examiners report
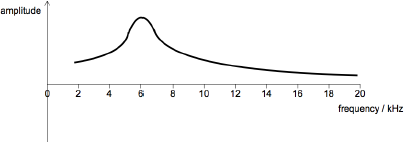
The natural frequency of a driven oscillating system is 6 kHz. The frequency of the driver for the system is varied from zero to 20 kHz.
Draw a graph to show the variation of amplitude of oscillation of the system with frequency.

The Q factor for the system is reduced significantly. Describe how the graph you drew in (a) changes.
Markscheme
general shape as shown
peak at 6 kHz
graph does not touch the f axis
[3 marks]
peak broadens
reduced maximum amplitude / graph shifted down
resonant frequency decreases / graph shifted to the left
[2 marks]