
SL Paper 2
Let f(x) = ln x − 5x , for x > 0 .
Solve f '(x) = f "(x).
Let . The following diagram shows part of the graph of .
There are -intercepts at and at . There is a maximum at A where , and a point of inflexion at B where .
Find the value of .
Write down the coordinates of A.
Write down the rate of change of at A.
Find the coordinates of B.
Find the the rate of change of at B.
Let be the region enclosed by the graph of , the -axis, the line and the line . The region is rotated 360° about the -axis. Find the volume of the solid formed.
Consider the function , where is a constant. Part of the graph of is shown below.
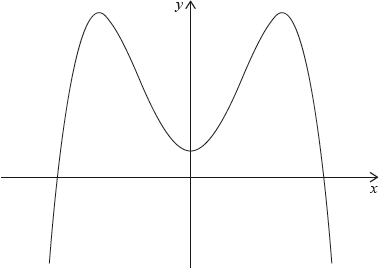
It is known that at the point where the tangent to the graph of is horizontal.
There are two other points on the graph of at which the tangent is horizontal.
Write down the -intercept of the graph.
Find .
Show that .
Find .
Write down the -coordinates of these two points;
Write down the intervals where the gradient of the graph of is positive.
Write down the range of .
Write down the number of possible solutions to the equation .
The equation , where , has four solutions. Find the possible values of .
Contestants in a TV gameshow try to get through three walls by passing through doors without falling into a trap. Contestants choose doors at random.
If they avoid a trap they progress to the next wall.
If a contestant falls into a trap they exit the game before the next contestant plays.
Contestants are not allowed to watch each other attempt the game.

The first wall has four doors with a trap behind one door.
Ayako is a contestant.
Natsuko is the second contestant.
The second wall has five doors with a trap behind two of the doors.
The third wall has six doors with a trap behind three of the doors.
The following diagram shows the branches of a probability tree diagram for a contestant in the game.

Write down the probability that Ayako avoids the trap in this wall.
Find the probability that only one of Ayako and Natsuko falls into a trap while attempting to pass through a door in the first wall.
Copy the probability tree diagram and write down the relevant probabilities along the branches.
A contestant is chosen at random. Find the probability that this contestant fell into a trap while attempting to pass through a door in the second wall.
A contestant is chosen at random. Find the probability that this contestant fell into a trap.
120 contestants attempted this game.
Find the expected number of contestants who fell into a trap while attempting to pass through a door in the third wall.
All lengths in this question are in centimetres.
A solid metal ornament is in the shape of a right pyramid, with vertex and square base . The centre of the base is . Point has coordinates and point has coordinates .

The volume of the pyramid is , correct to three significant figures.
Find .
Given that , find .
Find the height of the pyramid, .
A second ornament is in the shape of a cuboid with a rectangular base of length , width and height . The cuboid has the same volume as the pyramid.
The cuboid has a minimum surface area of . Find the value of .
160 students attend a dual language school in which the students are taught only in Spanish or taught only in English.
A survey was conducted in order to analyse the number of students studying Biology or Mathematics. The results are shown in the Venn diagram.
Set S represents those students who are taught in Spanish.
Set B represents those students who study Biology.
Set M represents those students who study Mathematics.

A student from the school is chosen at random.
Find the number of students in the school that are taught in Spanish.
Find the number of students in the school that study Mathematics in English.
Find the number of students in the school that study both Biology and Mathematics.
Write down .
Write down .
Find the probability that this student studies Mathematics.
Find the probability that this student studies neither Biology nor Mathematics.
Find the probability that this student is taught in Spanish, given that the student studies Biology.
Let , for . The graph of passes through the point , where .
Find the value of .
The following diagram shows part of the graph of .
The region enclosed by the graph of , the -axis and the lines and is rotated 360° about the -axis. Find the volume of the solid formed.
On one day 180 flights arrived at a particular airport. The distance travelled and the arrival status for each incoming flight was recorded. The flight was then classified as on time, slightly delayed, or heavily delayed.
The results are shown in the following table.

A χ2 test is carried out at the 10 % significance level to determine whether the arrival status of incoming flights is independent of the distance travelled.
The critical value for this test is 7.779.
A flight is chosen at random from the 180 recorded flights.
State the alternative hypothesis.
Calculate the expected frequency of flights travelling at most 500 km and arriving slightly delayed.
Write down the number of degrees of freedom.
Write down the χ2 statistic.
Write down the associated p-value.
State, with a reason, whether you would reject the null hypothesis.
Write down the probability that this flight arrived on time.
Given that this flight was not heavily delayed, find the probability that it travelled between 500 km and 5000 km.
Two flights are chosen at random from those which were slightly delayed.
Find the probability that each of these flights travelled at least 5000 km.
Consider the function , .
The graph of has a horizontal tangent line at and at . Find .
Sila High School has 110 students. They each take exactly one language class from a choice of English, Spanish or Chinese. The following table shows the number of female and male students in the three different language classes.

A test was carried out at the 5 % significance level to analyse the relationship between gender and student choice of language class.
Use your graphic display calculator to write down
The critical value at the 5 % significance level for this test is 5.99.
One student is chosen at random from this school.
Another student is chosen at random from this school.
Write down the null hypothesis, H0 , for this test.
State the number of degrees of freedom.
the expected frequency of female students who chose to take the Chinese class.
the statistic.
State whether or not H0 should be rejected. Justify your statement.
Find the probability that the student does not take the Spanish class.
Find the probability that neither of the two students take the Spanish class.
Find the probability that at least one of the two students is female.
In a company it is found that 25 % of the employees encountered traffic on their way to work. From those who encountered traffic the probability of being late for work is 80 %.
From those who did not encounter traffic, the probability of being late for work is 15 %.
The tree diagram illustrates the information.

The company investigates the different means of transport used by their employees in the past year to travel to work. It was found that the three most common means of transport used to travel to work were public transportation (P ), car (C ) and bicycle (B ).
The company finds that 20 employees travelled by car, 28 travelled by bicycle and 19 travelled by public transportation in the last year.
Some of the information is shown in the Venn diagram.

There are 54 employees in the company.
Write down the value of a.
Write down the value of b.
Use the tree diagram to find the probability that an employee encountered traffic and was late for work.
Use the tree diagram to find the probability that an employee was late for work.
Use the tree diagram to find the probability that an employee encountered traffic given that they were late for work.
Find the value of x.
Find the value of y.
Find the number of employees who, in the last year, did not travel to work by car, bicycle or public transportation.
Find .
Consider the function .
Sketch the graph of y = f (x), for −4 ≤ x ≤ 3 and −50 ≤ y ≤ 100.
Use your graphic display calculator to find the equation of the tangent to the graph of y = f (x) at the point (–2, 38.75).
Give your answer in the form y = mx + c.
Sketch the graph of the function g (x) = 10x + 40 on the same axes.
Consider the curve y = 2x3 − 9x2 + 12x + 2, for −1 < x < 3
Sketch the curve for −1 < x < 3 and −2 < y < 12.
A teacher asks her students to make some observations about the curve.
Three students responded.
Nadia said “The x-intercept of the curve is between −1 and zero”.
Rick said “The curve is decreasing when x < 1 ”.
Paula said “The gradient of the curve is less than zero between x = 1 and x = 2 ”.
State the name of the student who made an incorrect observation.
Find .
Show that the stationary points of the curve are at x = 1 and x = 2.
Given that y = 2x3 − 9x2 + 12x + 2 = k has three solutions, find the possible values of k.
Let , be a periodic function with
The following diagram shows the graph of .

There is a maximum point at A. The minimum value of is −13 .
A ball on a spring is attached to a fixed point O. The ball is then pulled down and released, so that it moves back and forth vertically.

The distance, d centimetres, of the centre of the ball from O at time t seconds, is given by
Find the coordinates of A.
For the graph of , write down the amplitude.
For the graph of , write down the period.
Hence, write in the form .
Find the maximum speed of the ball.
Find the first time when the ball’s speed is changing at a rate of 2 cm s−2.
Consider the function .
The function has one local maximum at and one local minimum at .
Write down the -intercept of the graph of .
Sketch the graph of for −3 ≤ ≤ 3 and −4 ≤ ≤ 12.
Determine the range of for ≤ ≤ .
A rocket is travelling in a straight line, with an initial velocity of m s−1. It accelerates to a new velocity of m s−1 in two stages.
During the first stage its acceleration, m s−2, after seconds is given by , where .
The first stage continues for seconds until the velocity of the rocket reaches m s−1.
Find an expression for the velocity, m s−1, of the rocket during the first stage.
Find the distance that the rocket travels during the first stage.
During the second stage, the rocket accelerates at a constant rate. The distance which the rocket travels during the second stage is the same as the distance it travels during the first stage.
Find the total time taken for the two stages.
A company performs an experiment on the efficiency of a liquid that is used to detect a nut allergy.
A group of 60 people took part in the experiment. In this group 26 are allergic to nuts. One person from the group is chosen at random.
A second person is chosen from the group.
When the liquid is added to a person’s blood sample, it is expected to turn blue if the person is allergic to nuts and to turn red if the person is not allergic to nuts.
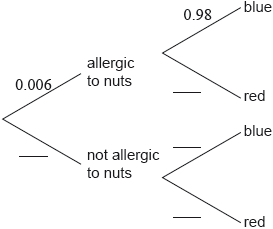
The company claims that the probability that the test result is correct is 98% for people who are allergic to nuts and 95% for people who are not allergic to nuts.
It is known that 6 in every 1000 adults are allergic to nuts.
This information can be represented in a tree diagram.
An adult, who was not part of the original group of 60, is chosen at random and tested using this liquid.
The liquid is used in an office to identify employees who might be allergic to nuts. The liquid turned blue for 38 employees.
Find the probability that both people chosen are not allergic to nuts.
Copy and complete the tree diagram.
Find the probability that this adult is allergic to nuts and the liquid turns blue.
Find the probability that the liquid turns blue.
Find the probability that the tested adult is allergic to nuts given that the liquid turned blue.
Estimate the number of employees, from this 38, who are allergic to nuts.
Let , and .
Find .
Let be a point on the graph of . The tangent to the graph of at is parallel to the graph of .
Find the -coordinate of .
Let , for x > 0.
The k th maximum point on the graph of f has x-coordinate xk where .
Given that xk + 1 = xk + a, find a.
Hence find the value of n such that .
The population of fish in a lake is modelled by the function
, 0 ≤ ≤ 30 , where is measured in months.
Find the population of fish at = 10.
Find the rate at which the population of fish is increasing at = 10.
Find the value of for which the population of fish is increasing most rapidly.
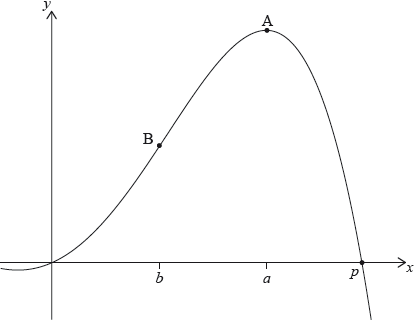
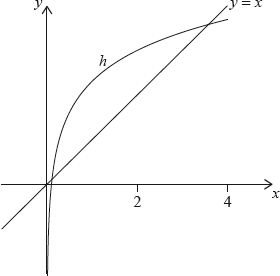
Let , for . The following diagram shows the graph of .

There are -intercepts at and at . There is a maximum at point where , and a point of inflexion at point where .
Find the value of .
Write down the coordinates of .
Find the equation of the tangent to the graph of at .
Find the coordinates of .
Find the rate of change of at .
Let be the region enclosed by the graph of , the -axis and the lines and . The region is rotated 360º about the -axis. Find the volume of the solid formed.
Let and , for .
The graph of can be obtained from the graph of by two transformations:
Let , for . The following diagram shows the graph of and the line .
The graph of intersects the graph of at two points. These points have coordinates 0.111 and 3.31 correct to three significant figures.
Write down the value of ;
Write down the value of ;
Write down the value of .
Find .
Hence, find the area of the region enclosed by the graphs of and .
Let be the vertical distance from a point on the graph of to the line . There is a point on the graph of where is a maximum.
Find the coordinates of P, where .
A particle moves in a straight line such that its velocity, , at time seconds is given by .
Determine when the particle changes its direction of motion.
Find the times when the particle’s acceleration is .
Find the particle’s acceleration when its speed is at its greatest.
A scientist conducted a nine-week experiment on two plants, and , of the same species. He wanted to determine the effect of using a new plant fertilizer. Plant was given fertilizer regularly, while Plant was not.
The scientist found that the height of Plant , at time weeks can be modelled by the function , where .
The scientist found that the height of Plant , at time weeks can be modelled by the function , where .
Use the scientist’s models to find the initial height of
Plant .
Plant correct to three significant figures.
Find the values of when .
For , find the total amount of time when the rate of growth of Plant was greater than the rate of growth of Plant .
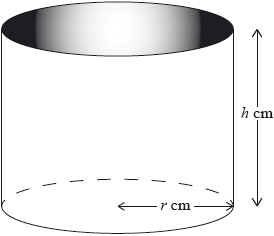
A manufacturer makes trash cans in the form of a cylinder with a hemispherical top. The trash can has a height of 70 cm. The base radius of both the cylinder and the hemispherical top is 20 cm.

A designer is asked to produce a new trash can.
The new trash can will also be in the form of a cylinder with a hemispherical top.
This trash can will have a height of H cm and a base radius of r cm.

There is a design constraint such that H + 2r = 110 cm.
The designer has to maximize the volume of the trash can.
Write down the height of the cylinder.
Find the total volume of the trash can.
Find the height of the cylinder, h , of the new trash can, in terms of r.
Show that the volume, V cm3 , of the new trash can is given by
.
Using your graphic display calculator, find the value of r which maximizes the value of V.
The designer claims that the new trash can has a capacity that is at least 40% greater than the capacity of the original trash can.
State whether the designer’s claim is correct. Justify your answer.
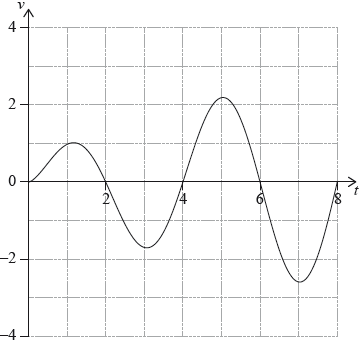
A particle P moves along a straight line. The velocity v m s−1 of P after t seconds is given by v (t) = 7 cos t − 5t cos t, for 0 ≤ t ≤ 7.
The following diagram shows the graph of v.

Find the initial velocity of P.
Find the maximum speed of P.
Write down the number of times that the acceleration of P is 0 m s−2 .
Find the acceleration of P when it changes direction.
Find the total distance travelled by P.
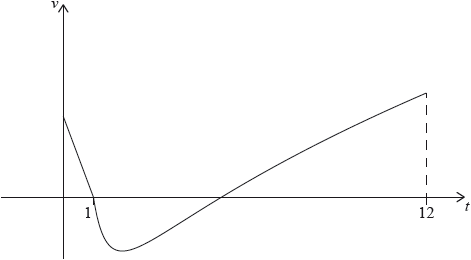
A particle P moves along a straight line. Its velocity after seconds is given by , for . The following diagram shows the graph of .
Write down the first value of at which P changes direction.
Find the total distance travelled by P, for .
A second particle Q also moves along a straight line. Its velocity, after seconds is given by for . After seconds Q has travelled the same total distance as P.
Find .
Let . The line is tangent to the graph of at .
can be expressed in the form r u.
The direction vector of is .
Find the gradient of .
Find u.
Find the acute angle between and .
Find .
Hence, write down .
Hence or otherwise, find the obtuse angle formed by the tangent line to at and the tangent line to at .
Let , for 0 ≤ ≤ 1.
Sketch the graph of on the grid below:

Find the -coordinates of the points of inflexion of the graph of .
Hence find the values of for which the graph of is concave-down.
All lengths in this question are in metres.
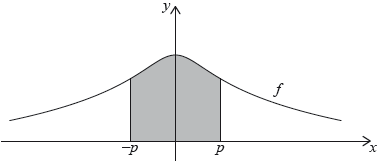
Consider the function , for −2 ≤ ≤ 2. In the following diagram, the shaded region is enclosed by the graph of and the -axis.

A container can be modelled by rotating this region by 360˚ about the -axis.
Water can flow in and out of the container.
The volume of water in the container is given by the function , for 0 ≤ ≤ 4 , where is measured in hours and is measured in m3. The rate of change of the volume of water in the container is given by .
The volume of water in the container is increasing only when < < .
Find the volume of the container.
Find the value of and of .
During the interval < < , he volume of water in the container increases by m3. Find the value of .
When = 0, the volume of water in the container is 2.3 m3. It is known that the container is never completely full of water during the 4 hour period.
Find the minimum volume of empty space in the container during the 4 hour period.
A particle moves along a straight line so that its velocity, m s−1, after seconds is given by , for 0 ≤ ≤ 5.
Find when the particle is at rest.
Find the acceleration of the particle when .
Find the total distance travelled by the particle.
Let and .
The graphs of and intersect at and , where .
Find the value of and of .
Hence, find the area of the region enclosed by the graphs of and .
The displacement, in centimetres, of a particle from an origin, O, at time t seconds, is given by s(t) = t 2 cos t + 2t sin t, 0 ≤ t ≤ 5.
Find the maximum distance of the particle from O.
Find the acceleration of the particle at the instant it first changes direction.
A function is given by .
The graph of the function intersects the graph of .
Expand the expression for .
Find .
Draw the graph of for and . Use a scale of 2 cm to represent 1 unit on the -axis and 1 cm to represent 5 units on the -axis.
Write down the coordinates of the point of intersection.
In this question distance is in centimetres and time is in seconds.
Particle A is moving along a straight line such that its displacement from a point P, after seconds, is given by , 0 ≤ ≤ 25. This is shown in the following diagram.

Another particle, B, moves along the same line, starting at the same time as particle A. The velocity of particle B is given by , 0 ≤ ≤ 25.
Find the initial displacement of particle A from point P.
Find the value of when particle A first reaches point P.
Find the value of when particle A first changes direction.
Find the total distance travelled by particle A in the first 3 seconds.
Given that particles A and B start at the same point, find the displacement function for particle B.
Find the other value of when particles A and B meet.
A particle moves along a straight line so that its velocity, , after seconds is given by for .
Find the value of when the particle is at rest.
Find the acceleration of the particle when it changes direction.
Find the total distance travelled by the particle.
A particle moves in a straight line such that its velocity, , at time seconds is given by
.
The particle’s acceleration is zero at .
Find the value of .
Let be the distance travelled by the particle from to and let be the distance travelled by the particle from to .
Show that .
Note: In this question, distance is in metres and time is in seconds.
A particle P moves in a straight line for five seconds. Its acceleration at time is given by , for .
When , the velocity of P is .
Write down the values of when .
Hence or otherwise, find all possible values of for which the velocity of P is decreasing.
Find an expression for the velocity of P at time .
Find the total distance travelled by P when its velocity is increasing.
Consider a function , for . The derivative of is given by .
The graph of is concave-down when .
Show that .
Find the least value of .
Find .
Let be the region enclosed by the graph of , the -axis and the lines and . The area of is , correct to three significant figures.
Find .
A particle P starts from a point A and moves along a horizontal straight line. Its velocity after seconds is given by
The following diagram shows the graph of .
P is at rest when and .
When , the acceleration of P is zero.
Find the initial velocity of .
Find the value of .
(i) Find the value of .
(ii) Hence, find the speed of P when .
(i) Find the total distance travelled by P between and .
(ii) Hence or otherwise, find the displacement of P from A when .
Let . Find the term in in the expansion of the derivative, .
Consider the function defined by for .
The graph of and the line intersect at point .
The line has a gradient of and is a tangent to the graph of at the point .
The shaded region is enclosed by the graph of and the lines and .

Find the -coordinate of .
Find the exact coordinates of .
Show that the equation of is .
Find the -coordinate of the point where intersects the line .
Hence, find the area of .
The line is tangent to the graphs of both and the inverse function .

Find the shaded area enclosed by the graphs of and and the line .
A particle moves in a straight line. The velocity, , of the particle at time seconds is given by , for .
The following diagram shows the graph of .

Find the smallest value of for which the particle is at rest.
Find the total distance travelled by the particle.
Find the acceleration of the particle when .
Hyungmin designs a concrete bird bath. The bird bath is supported by a pedestal. This is shown in the diagram.

The interior of the bird bath is in the shape of a cone with radius , height and a constant slant height of .
Let be the volume of the bird bath.
Hyungmin wants the bird bath to have maximum volume.
Write down an equation in and that shows this information.
Show that .
Find .
Using your answer to part (c), find the value of for which is a maximum.
Find the maximum volume of the bird bath.
To prevent leaks, a sealant is applied to the interior surface of the bird bath.
Find the surface area to be covered by the sealant, given that the bird bath has maximum volume.
All lengths in this question are in metres.
Let , for . Mark uses as a model to create a barrel. The region enclosed by the graph of , the -axis, the line and the line is rotated 360° about the -axis. This is shown in the following diagram.
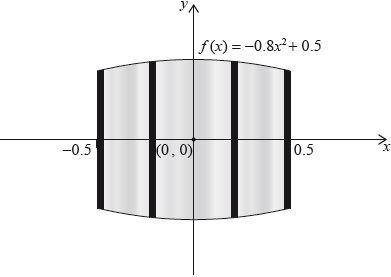
Use the model to find the volume of the barrel.
The empty barrel is being filled with water. The volume of water in the barrel after minutes is given by . How long will it take for the barrel to be half-full?
Let g(x) = −(x − 1)2 + 5.
Let f(x) = x2. The following diagram shows part of the graph of f.

The graph of g intersects the graph of f at x = −1 and x = 2.
Write down the coordinates of the vertex of the graph of g.
On the grid above, sketch the graph of g for −2 ≤ x ≤ 4.
Find the area of the region enclosed by the graphs of f and g.
Let for 0 ≤ ≤ 1.5. The following diagram shows the graph of .

Find the x-intercept of the graph of .
The region enclosed by the graph of , the y-axis and the x-axis is rotated 360° about the x-axis.
Find the volume of the solid formed.
A water container is made in the shape of a cylinder with internal height cm and internal base radius cm.
The water container has no top. The inner surfaces of the container are to be coated with a water-resistant material.
The volume of the water container is .
The water container is designed so that the area to be coated is minimized.
One can of water-resistant material coats a surface area of .
Write down a formula for , the surface area to be coated.
Express this volume in .
Write down, in terms of and , an equation for the volume of this water container.
Show that .
Find .
Using your answer to part (e), find the value of which minimizes .
Find the value of this minimum area.
Find the least number of cans of water-resistant material that will coat the area in part (g).
A group of 66 people went on holiday to Hawaii. During their stay, three trips were arranged: a boat trip (), a coach trip () and a helicopter trip ().
From this group of people:
| 3 | went on all three trips; |
| 16 | went on the coach trip only; |
| 13 | went on the boat trip only; |
| 5 | went on the helicopter trip only; |
| x | went on the coach trip and the helicopter trip but not the boat trip; |
| 2x | went on the boat trip and the helicopter trip but not the coach trip; |
| 4x | went on the boat trip and the coach trip but not the helicopter trip; |
| 8 | did not go on any of the trips. |
One person in the group is selected at random.
Draw a Venn diagram to represent the given information, using sets labelled , and .
Show that .
Write down the value of .
Find the probability that this person
(i) went on at most one trip;
(ii) went on the coach trip, given that this person also went on both the helicopter trip and the boat trip.
Consider the curves and for .
Find the -coordinates of the points of intersection of the two curves.
Find the area, , of the region enclosed by the two curves.
Let . The following diagram shows part of the graph of .

Find the -intercept of the graph of .
The region enclosed by the graph of , the -axis and the -axis is rotated 360º about the -axis. Find the volume of the solid formed.
Find .
Given and , find .
Violeta plans to grow flowers in a rectangular plot. She places a fence to mark out the perimeter of the plot and uses 200 metres of fence. The length of the plot is metres.
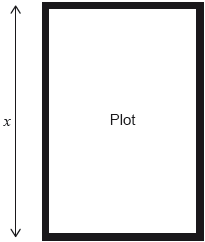
Violeta places the fence so that the area of the plot is maximized.
By selling her flowers, Violeta earns 2 Bulgarian Levs (BGN) per square metre of the plot.
Show that the width of the plot, in metres, is given by .
Write down the area of the plot in terms of .
Find the value of that maximizes the area of the plot.
Show that Violeta earns 5000 BGN from selling the flowers grown on the plot.
Consider the function , where x > 0 and k is a constant.
The graph of the function passes through the point with coordinates (4 , 2).
P is the minimum point of the graph of f (x).
Sketch the graph of y = f (x) for 0 < x ≤ 6 and −30 ≤ y ≤ 60.
Clearly indicate the minimum point P and the x-intercepts on your graph.
The function is defined by , where .
For the graph of
The graphs of and intersect at and , where .
write down the equation of the vertical asymptote.
find the equation of the horizontal asymptote.
Find .
Using an algebraic approach, show that the graph of is obtained by a reflection of the graph of in the -axis followed by a reflection in the -axis.
Find the value of and the value of .
Hence, find the area enclosed by the graph of and the graph of .
Haruka has an eco-friendly bag in the shape of a cuboid with width 12 cm, length 36 cm and height of 9 cm. The bag is made from five rectangular pieces of cloth and is open at the top.

Nanako decides to make her own eco-friendly bag in the shape of a cuboid such that the surface area is minimized.
The width of Nanako’s bag is x cm, its length is three times its width and its height is y cm.

The volume of Nanako’s bag is 3888 cm3.
Calculate the area of cloth, in cm2, needed to make Haruka’s bag.
Calculate the volume, in cm3, of the bag.
Use this value to write down, and simplify, the equation in x and y for the volume of Nanako’s bag.
Write down and simplify an expression in x and y for the area of cloth, A, used to make Nanako’s bag.
Use your answers to parts (c) and (d) to show that
.
Find .
Use your answer to part (f) to show that the width of Nanako’s bag is 12 cm.
The derivative of a function is given by , where . The graph of passes through the point . Find .
Note: In this question, distance is in metres and time is in seconds.
A particle moves along a horizontal line starting at a fixed point A. The velocity of the particle, at time , is given by , for . The following diagram shows the graph of
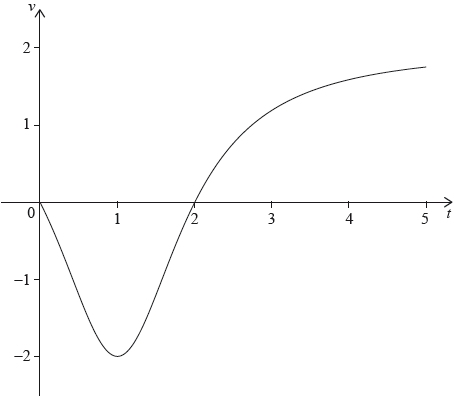
There are -intercepts at and .
Find the maximum distance of the particle from A during the time and justify your answer.