
HL Paper 2
Consider the function .
Find the coordinates where the graph of crosses the
-axis.
-axis.
Write down the equation of the vertical asymptote of the graph of .
The oblique asymptote of the graph of can be written as where .
Find the value of and the value of .
Sketch the graph of for , clearly indicating the points of intersection with each axis and any asymptotes.
Express in partial fractions.
Hence find the exact value of , expressing your answer as a single logarithm.
Prove the identity .
The equation has two real roots, and .
Consider the equation , where and which has roots and .
Without solving , determine the values of and .
The function is defined by , 0 < < 3.
Draw a set of axes showing and values between −3 and 3. On these axes
Hence, or otherwise, find the coordinates of the point of inflexion on the graph of .
sketch the graph of , showing clearly any axis intercepts and giving the equations of any asymptotes.
sketch the graph of , showing clearly any axis intercepts and giving the equations of any asymptotes.
Hence, or otherwise, solve the inequality .
A function is defined by , where and .
The region enclosed by the graph of , the -axis, the -axis and the line is rotated about the -axis to form a solid of revolution.
Pedro wants to make a small bowl with a volume of based on the result from part (a). Pedro’s design is shown in the following diagrams.

The vertical height of the bowl, , is measured along the -axis. The radius of the bowl’s top is and the radius of the bowl’s base is . All lengths are measured in .
For design purposes, Pedro investigates how the cross-sectional radius of the bowl changes.
Show that the volume of the solid formed is cubic units.
Find the value of that satisfies the requirements of Pedro’s design.
Find .
Find .
By sketching the graph of a suitable derivative of , find where the cross-sectional radius of the bowl is decreasing most rapidly.
State the cross-sectional radius of the bowl at this point.
A continuous random variable has a probability density function given by
The median of this distribution is .
Determine the value of .
Given that , determine the value of .
Consider the function , where .
The curve is rotated about the -axis to form a solid of revolution that is used to model a water container.
At , the container is empty. Water is then added to the container at a constant rate of .
Sketch the curve , clearly indicating the coordinates of the endpoints.
Show that the inverse function of is given by .
State the domain and range of .
Show that the volume, , of water in the container when it is filled to a height of metres is given by .
Hence, determine the maximum volume of the container.
Find the time it takes to fill the container to its maximum volume.
Find the rate of change of the height of the water when the container is filled to half its maximum volume.
The voltage in a circuit is given by the equation
, where is measured in seconds.
The current in this circuit is given by the equation
.
The power in this circuit is given by .
The average power in this circuit from to is given by the equation
, where .
Write down the maximum and minimum value of .
Write down two transformations that will transform the graph of onto the graph of .
Sketch the graph of for 0 ≤ ≤ 0.02 , showing clearly the coordinates of the first maximum and the first minimum.
Find the total time in the interval 0 ≤ ≤ 0.02 for which ≥ 3.
Find (0.007).
With reference to your graph of explain why > 0 for all > 0.
Given that can be written as where , , , > 0, use your graph to find the values of , , and .
Consider the rectangle OABC such that AB = OC = 10 and BC = OA = 1 , with the points P , Q and R placed on the line OC such that OP = , OQ = and OR = , such that 0 < < < < 10.

Let be the angle APO, be the angle AQO and be the angle ARO.
Consider the case when and QR = 1.
Find an expression for in terms of .
Show that .
By sketching the graph of as a function of , determine the range of values of for which there are possible values of .
Show that .
Verify that and satisfy the equation .
Hence, or otherwise, show that the exact value of .
Using the results from parts (b) and (c) find the exact value of .
Give your answer in the form where , .
A function is defined by .
A function is defined by .
Show that is an even function.
By considering limits, show that the graph of has a horizontal asymptote and state its equation.
Show that for .
By using the expression for and the result , show that is decreasing for .
Find an expression for , justifying your answer.
State the domain of .
Sketch the graph of , clearly indicating any asymptotes with their equations and stating the values of any axes intercepts.
The height of water, in metres, in Dungeness harbour is modelled by the function , where is the number of hours after midnight, and and are constants, where and .
The following graph shows the height of the water for hours, starting at midnight.

The first high tide occurs at and the next high tide occurs hours later. Throughout the day, the height of the water fluctuates between and .
All heights are given correct to one decimal place.
Show that .
Find the value of .
Find the value of .
Find the smallest possible value of .
Find the height of the water at .
Determine the number of hours, over a 24-hour period, for which the tide is higher than metres.
A fisherman notes that the water height at nearby Folkestone harbour follows the same sinusoidal pattern as that of Dungeness harbour, with the exception that high tides (and low tides) occur minutes earlier than at Dungeness.
Find a suitable equation that may be used to model the tidal height of water at Folkestone harbour.
It is given that where and are positive integers.
Given that is a factor of find the value of and the value of .
Factorize into a product of linear factors.
Using your graph state the range of values of for which has exactly two distinct real roots.
Sketch the graphs and on the following axes for 0 < ≤ 9.

Hence solve in the range 0 < ≤ 9.
Consider
The function is defined by
The function is defined by .
Find the largest possible domain for to be a function.
Sketch the graph of showing clearly the equations of asymptotes and the coordinates of any intercepts with the axes.
Explain why is an even function.
Explain why the inverse function does not exist.
Find the inverse function and state its domain.
Find .
Hence, show that there are no solutions to ;
Hence, show that there are no solutions to .
The function is defined by , for , , .
The graph of has exactly one point of inflexion.
The function is defined by , for .
Find the value of and the value of .
Find an expression for .
Find the -coordinate of the point of inflexion.
Sketch the graph of for , showing the values of any axes intercepts, the coordinates of any local maxima and local minima, and giving the equations of any asymptotes.
Find the equations of all the asymptotes on the graph of .
By considering the graph of , or otherwise, solve for .
Consider the function defined by where .
Sketch the graph of indicating clearly any intercepts with the axes and the coordinates of any local maximum or minimum points.
State the range of .
Solve the inequality .
The population, , of a particular species of marsupial on a small remote island can be modelled by the logistic differential equation
where is the time measured in years and are positive constants.
The constant represents the maximum population of this species of marsupial that the island can sustain indefinitely.
Let be the initial population of marsupials.
In the context of the population model, interpret the meaning of .
Show that .
Hence show that the population of marsupials will increase at its maximum rate when . Justify your answer.
Hence determine the maximum value of in terms of and .
By solving the logistic differential equation, show that its solution can be expressed in the form
.
After years, the population of marsupials is . It is known that .
Find the value of for this population model.
Consider the function .
The function is given by , where .
Show that is an odd function.
Solve the inequality .
A scientist conducted a nine-week experiment on two plants, and , of the same species. He wanted to determine the effect of using a new plant fertilizer. Plant was given fertilizer regularly, while Plant was not.
The scientist found that the height of Plant , at time weeks can be modelled by the function , where .
The scientist found that the height of Plant , at time weeks can be modelled by the function , where .
Use the scientist’s models to find the initial height of
Plant .
Plant correct to three significant figures.
Find the values of when .
For , prove that Plant was always taller than Plant .
For , find the total amount of time when the rate of growth of Plant was greater than the rate of growth of Plant .
Consider the expression .
The expression can be written as where .
Let , β be the roots of , where 0 < < 1.
Sketch the graph of for .
With reference to your graph, explain why is a function on the given domain.
Explain why has no inverse on the given domain.
Explain why is not a function for .
Show that .
Sketch the graph of for t ≤ 0. Give the coordinates of any intercepts and the equations of any asymptotes.
Find and β in terms of .
Show that + β < −2.
Let , where , ,
Given that is a factor of , find a relationship between , and .
Given that is a factor of , write down the value of .
Given that is a factor of , and that , find the values of and .
Consider the equation , where , , , .
The equation has three distinct real roots which can be written as , and .
The equation also has two imaginary roots, one of which is where .
The values , , and are consecutive terms in a geometric sequence.
Show that .
Show that one of the real roots is equal to 1.
Given that , find the other two real roots.
The following diagram shows the graph of , .

Find the value of .
Given that , determine the value of .
Given that , find the domain and range of .
Find the set of values of that satisfy the inequality .
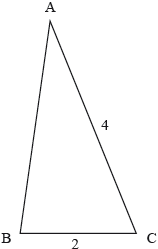
The triangle ABC is shown in the following diagram. Given that , find the range of possible values for AB.
Consider the function , , where , , .
The following graph shows the curve . It has asymptotes at and and meets the -axis at A.

On the following axes, sketch the two possible graphs of giving the equations of any asymptotes in terms of and .

Given that , and A has coordinates , determine the possible sets of values for , and .
The function has a derivative given by where is a positive constant.
Consider , the population of a colony of ants, which has an initial value of .
The rate of change of the population can be modelled by the differential equation , where is the time measured in days, , and is the upper bound for the population.
At the population of the colony has doubled in size from its initial value.
The expression for can be written in the form , where . Find and in terms of .
Hence, find an expression for .
By solving the differential equation, show that .
Find the value of , giving your answer correct to four significant figures.
Find the value of when the rate of change of the population is at its maximum.
Two airplanes, and , have position vectors with respect to an origin given respectively by
where represents the time in minutes and .
Entries in each column vector give the displacement east of , the displacement north of and the distance above sea level, all measured in kilometres.
The two airplanes’ lines of flight cross at point .
Find the three-figure bearing on which airplane is travelling.
Show that airplane travels at a greater speed than airplane .
Find the acute angle between the two airplanes’ lines of flight. Give your answer in degrees.
Find the coordinates of .
Determine the length of time between the first airplane arriving at and the second airplane arriving at .
Let represent the distance between airplane and airplane for .
Find the minimum value of .
The number of bananas that Lucca eats during any particular day follows a Poisson distribution with mean 0.2.
Find the probability that Lucca eats at least one banana in a particular day.
Find the expected number of weeks in the year in which Lucca eats no bananas.
A continuous random variable has the probability density function given by
where .
Show that .
Find the value of .
The polynomial is exactly divisible by each of , and .
Find the values of , and .
The function is defined by , .
Write down the range of .
Find , stating its domain.
Consider the graphs of and , .
Find the set of values for such that the two graphs have no intersection points.
Consider the equation , where .
Write down an expression for the product of the roots, in terms of .
Hence or otherwise, determine the values of such that the equation has one positive and one negative real root.
Consider the function .
Consider the region bounded by the curve , the -axis and the lines .
Show that the -coordinate of the minimum point on the curve satisfies the equation .
Determine the values of for which is a decreasing function.
Sketch the graph of showing clearly the minimum point and any asymptotic behaviour.
Find the coordinates of the point on the graph of where the normal to the graph is parallel to the line .
This region is now rotated through radians about the -axis. Find the volume of revolution.