HL Paper 1
“Poverty reduction cannot be achieved without improved soil management.” Discuss this statement.
Discuss why some governments find it difficult to provide access to safe drinking water for all their people.
“Ensuring adequate water supplies is a greater environmental challenge for the world than adapting to climate change.” Referring to examples, discuss this statement.
Examine the relationship between environmental change and human migrations.
“The fact that the world’s population is now growing less rapidly means that there will be less pressure on the environment.” Discuss this statement.
The diagram shows factors contributing to the loss of biodiversity in tropical rainforests.

State one physical factor and one human factor not shown on the diagram that contribute to a loss of biodiversity.
Explain how any one of the factors given on the diagram contributes to a loss of biodiversity in tropical rainforests.
Explain three reasons why biodiversity in tropical rainforests should be preserved.
“Falling fertility rates are no guarantee of reduced resource consumption.” Discuss this statement, referring to examples.
The graph shows several different ways of cooling the Earth by geo-engineering (the use of engineering to resolve environmental issues).
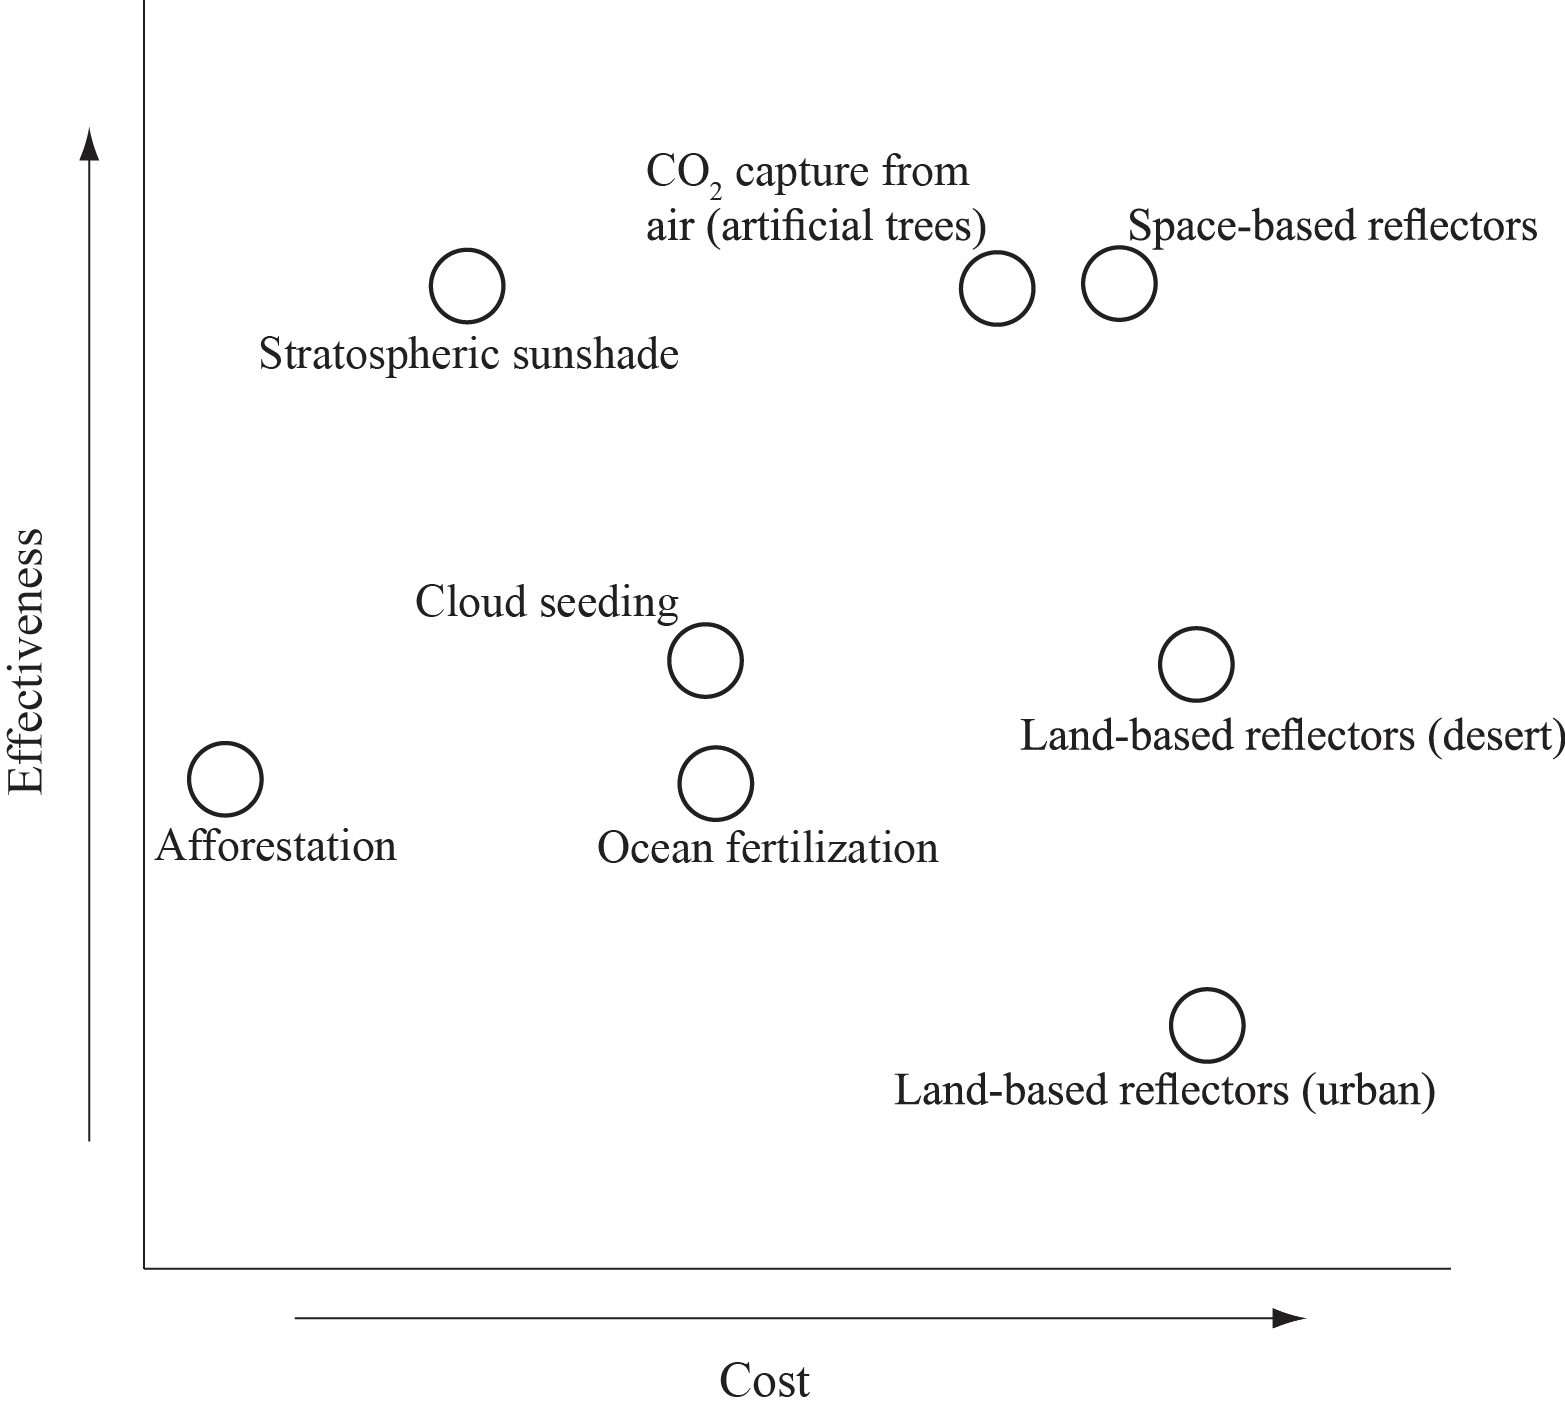
[Source: Jim Giles (29 March 2010), Hacking the Planet: Who Decides? New Scientist, issue 2754]
Identify the two most cost-effective options shown on the graph.
Explain how deforestation may contribute to global warming.
Explain two possible environmental consequences of global climate change.
The graph shows global temperature changes since 1850.

[Source: IPCC – data based on a graph in The Economist, 9 September 2006]
State one natural external forcing which could have influenced the changes in temperature shown on the graph.
Referring to the graph, describe how temperature has changed since 1850.
Explain three possible environmental consequences of global climate change since 1950.
“Climate change will only increase global disparities in wealth.” Discuss this statement.
Examine the negative environmental impacts of economic development on water and biodiversity.
“There is no truly sustainable solution to the world’s growing energy problems.” Discuss this statement.
“We still have the resources to live as wastefully as we want.” Discuss this statement.
“Global climate change will increase disparities in development.” Discuss this statement, referring to examples.
The graph shows the categories of global water consumption in 2010.
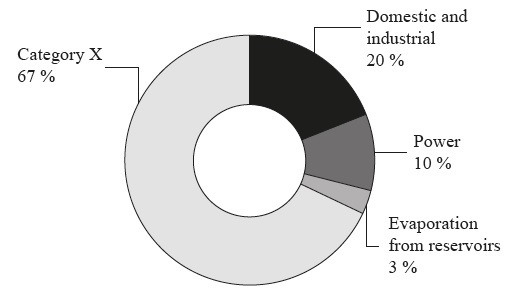
[Source: World Bank Development Report 2010. http://wdronline.worldbank.org/worldbank/a/c.html/world_development_report_2010/chapter_3_managing_land_water_feed_billion_people_protect_natural_systems/page/1 Used with permission]
Identify Category X on the diagram.
Define the term physical water scarcity.
Explain two physical factors that affect the availability of safe drinking water for a community.
Analyse the role of water in the causes of soil degradation.
“A falling fertility rate is always beneficial to a country.” Discuss this statement.
“The causes of global climatic change are essentially human.” Discuss this statement.
The diagram shows the world distribution of areas of water scarcity.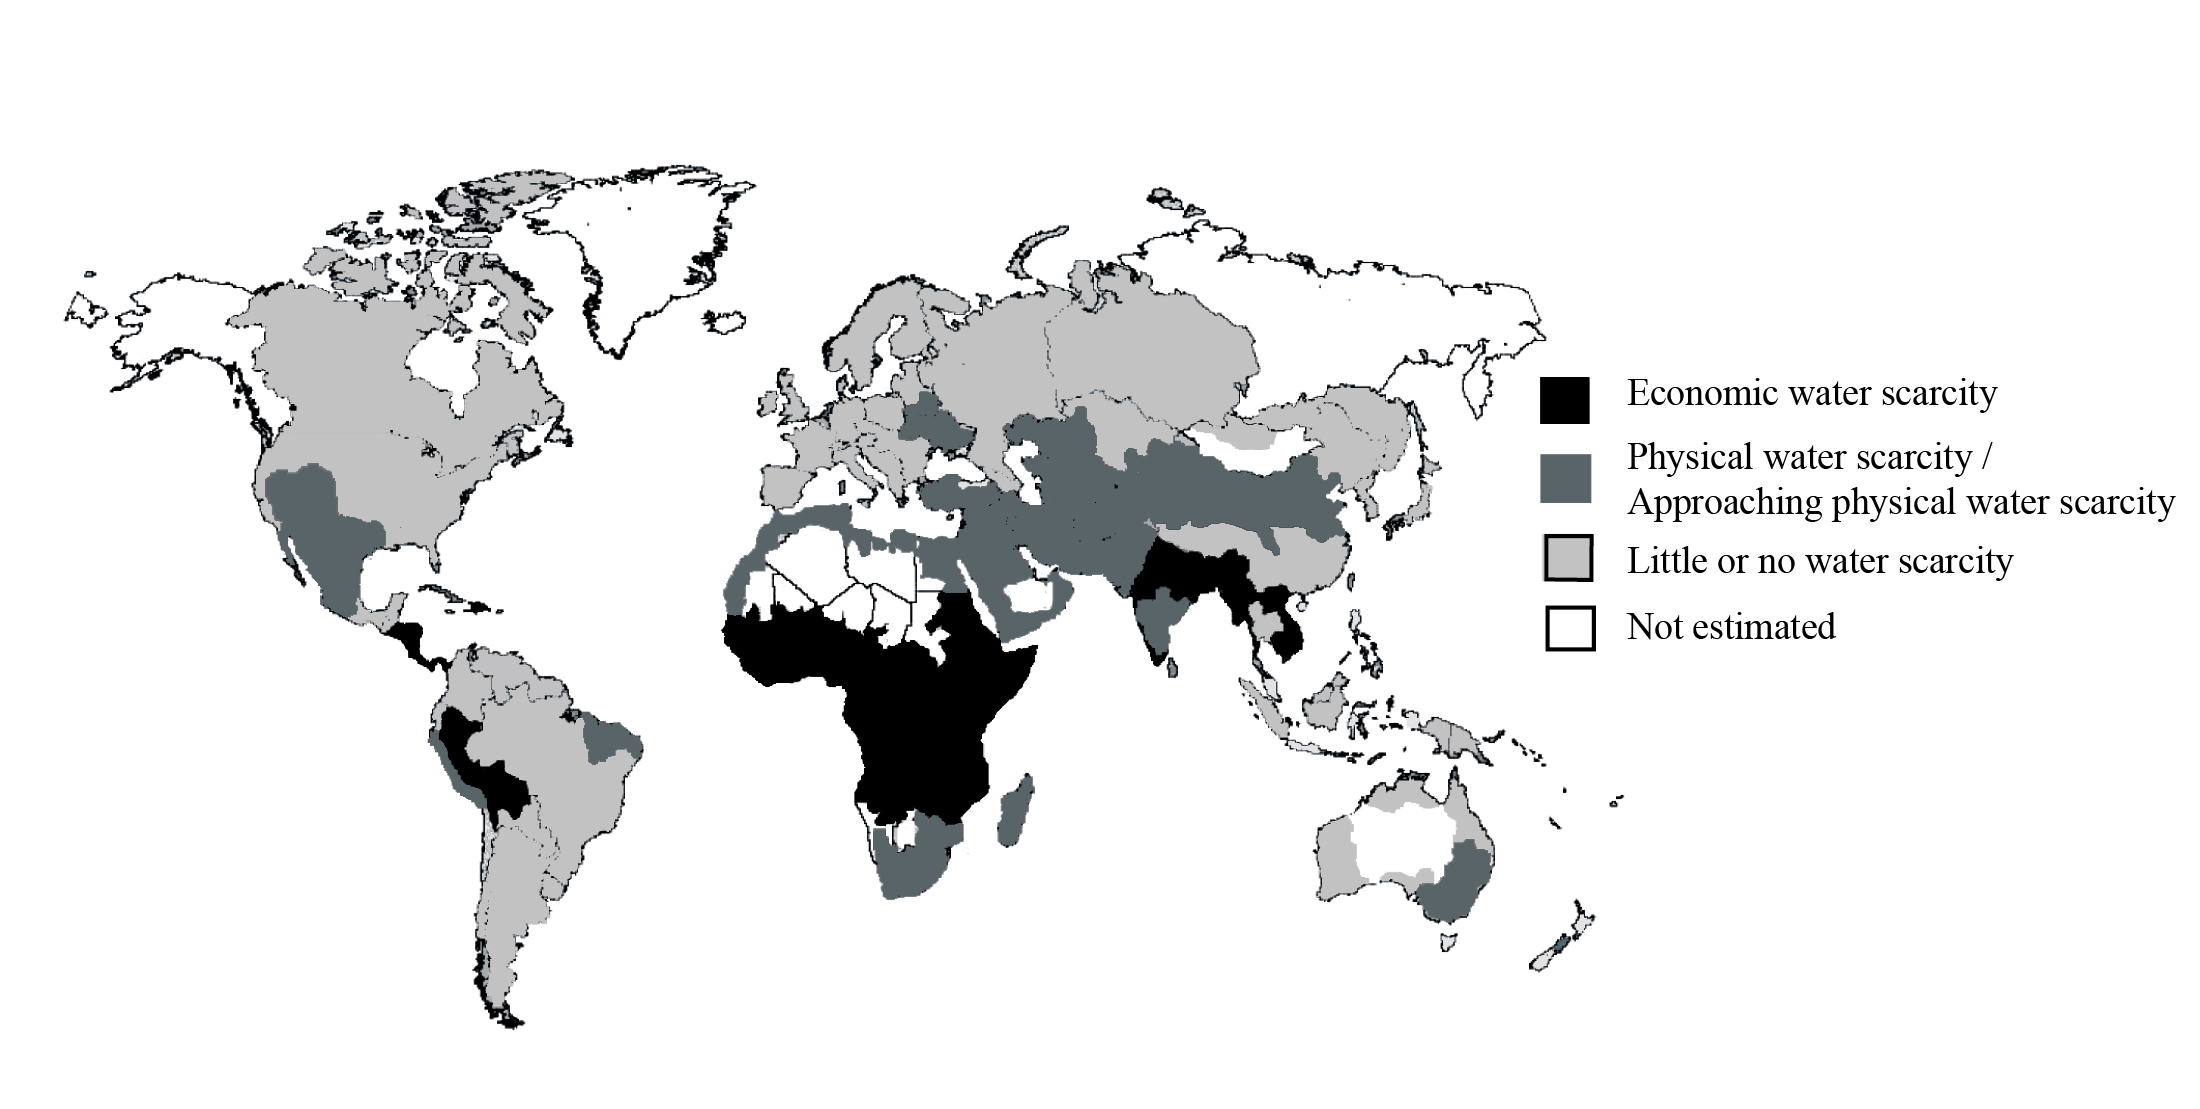
[Source: modified from Comprehensive Assessment of Water Management in Agriculture 2007. Water for Food, Water for Life: A comprehensive Assessment of Water Management in Agriculture. London: Earthscan and Colombo: International Water Management Institute]
Define physical water scarcity.
Define economic water scarcity.
Describe the global pattern of water scarcity shown on the map.
Explain the factors affecting access to safe drinking water.
Examine the reasons for and against preserving the biodiversity of tropical rainforests.
The graph shows the carbon dioxide (CO2) emissions and population for selected countries and the rest of the world as a percentage of world totals.
[Used with permission]
Identify which country or region has the lowest emissions of CO2 per person.
Explain why some countries have higher CO2 emissions per person than others.
Explain the relationship between atmospheric greenhouse gases and the temperature of the Earth’s surface.
Examine the relationship between energy consumption and environmental sustainability.
“The world is far too dependent on oil.” To what extent do you agree with this statement?
“Only high-income countries can effectively develop sustainable sources of energy.” Discuss this statement, referring to examples.
“Rapid population growth is the main cause of soil degradation and reduced biodiversity.” Discuss this statement.
“Of all the environmental challenges we face, soil degradation is the most serious.” Discuss this statement.
Examine the view that population change is responsible for water scarcity.
“Population growth is the greatest threat to our planet’s soil quality and biodiversity.” Discuss this statement.
Patterns in environmental quality and sustainability
The graph shows one estimate of the long-term impact of global climate change on agricultural production.

[Source: Republished with permission of International Monetary Fund, from Global Warming and Agriculture in Finance & Development, William R. Cline, Vol 45, Issue 1, 2007; permission conveyed through Copyright Clearance Center, Inc.]
Describe how the estimated impact of climate change on agricultural production varies with latitude.
Suggest two reasons why global climate change may lead to an increase in agricultural production in some places.
Distinguish between physical water scarcity and economic water scarcity.
The graph shows how the percentage of forest cover in a country changes as the country develops over time. The graph includes some present-day examples of countries at different stages of development.

Identify the country shown on the graph with the lowest percentage of forest cover.
Distinguish between forest cover and biodiversity.
Suggest two reasons why forest cover in some countries has increased in recent years.
Reason 1:
Reason 2:
Explain two consequences of the reduction of biodiversity in some tropical rainforests.
Consequence 1:
Consequence 2:
The graph shows external forcings, such as greenhouse gases, causing changes in the Earth’s atmospheric system.

[Source: Figure SPM.2 from Climate Change 2007: The Physical Science Basis. Working Group I Contribution to the Fourth Assessment Report of the Intergovernmental Panel on Climate Change [Solomon, S., D. Qin, M. Manning, Z. Chen, M. Marquis, K.B. Averyt, M. Tignor and H.L. Miller (eds.)]. Cambridge University Press, Cambridge, United Kingdom and New York, NY, USA.]
State which external forcing shown on the graph has the greatest impact on temperature in the atmosphere.
Outline what is meant by “albedo”.
Briefly describe the difference between stratospheric ozone and tropospheric ozone.
Explain two environmental consequences of global climatic change (global warming).
Consequence 1:
Consequence 2:
The graph shows total carbon dioxide (CO2) emissions by region from 1990 to 2010.

Describe the trend of CO2 emissions in Asia between 1990 and 2010.
Suggest two reasons why CO2 emissions in Europe have decreased since 1990.
Distinguish between global climate change and the enhanced greenhouse effect.
Patterns in environmental quality and sustainability
The diagram shows the level of poverty and the level of soil degradation in three countries.

Describe the relationship between the level of poverty and the level of soil degradation shown on the diagram.
Explain one strategy that has been successful in reducing soil degradation.
Explain the importance of maintaining biodiversity in tropical rainforests.
The graph shows the progress made by a manufacturing corporation since 2010 towards meeting its 2020 targets for environmental sustainability. All values are relative to an index value of 100 in 2010.

Describe what is meant by the term “environmental sustainability”.
State the aspect of environmental sustainability that should replace “A” on the graph.
Describe the progress made by this corporation since 2010 towards meeting its 2020 targets for environmental sustainability.
Suggest two environmental disadvantages of sending waste to landfill.
The table shows deforestation rates for six countries that share the Congo rainforest.

Rank the three countries with the largest areas of rainforest from highest to lowest.
Referring to the data in the table, describe the trend in rainforest loss between the 1990s and 2000s.
Explain three reasons why it is important to maintain the biodiversity of tropical rainforests.

State a likely cause for X.
Referring to the diagram/map, describe the global pattern of soil degradation due to overgrazing.
Explain two socio-economic consequences of soil degradation.
Explain one management strategy that is likely to achieve environmental sustainability.
The map shows the severity of human-induced soil degradation.
Please rotate this page to view the map.

Describe the distribution of areas of very high soil degradation.
Suggest two reasons why areas of high soil degradation occur in Europe and/or North America.
1.
2.
Explain two ways, other than food production, in which soil provides valuable environmental benefits for people.
1.
2.
3. Patterns in environmental quality and sustainability
The map shows the global distribution of physical water scarcity.

Describe the pattern of high physical water scarcity shown on the map.
Explain why some of the world’s arid areas are not areas of physical water scarcity.
Explain the energy flows involved in the greenhouse effect.