SL Paper 2
The photograph shows a periglacial environment.
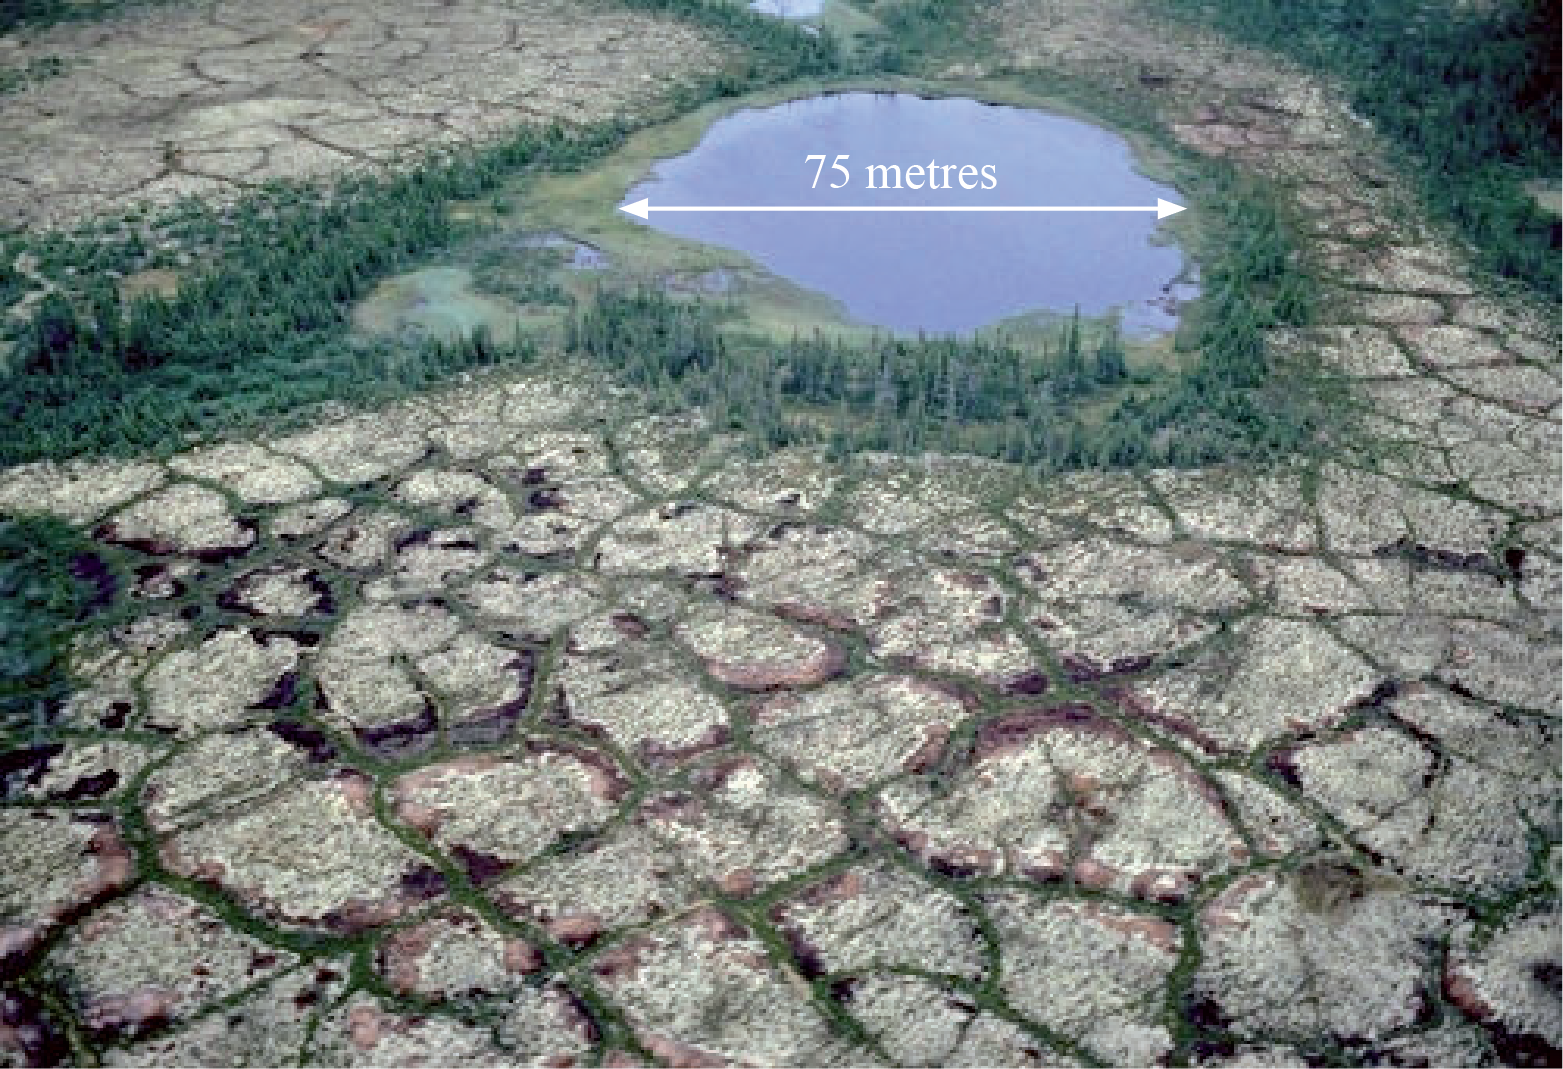
[“Reproduced with the permission of Natural Resources Canada (Photo "10ag-7")."]
Name and describe two landforms shown on the photograph.
Explain the process of solifluction.
Explain the formation of pingos.
Examine the impacts of permafrost on human activities.
Identify one type of cold extreme environment.
State three physical characteristics of the cold extreme environment that you identified in (a)(i).
Explain why semi-arid areas are considered to be extreme environments.
“Global climate change will prevent people from living in extreme environments.” Discuss this statement with reference to one or more extreme environments.
(i) State and locate one example of mineral extraction in an extreme environment.
(ii) Outline one economic reason why the mineral identified in (a)(i) is extracted in this extreme environment.
Explain two physical challenges for resource development posed by extreme environments.
Examine why desertification has become a problem in some parts of the world.
The graph below shows the retreat (by altitude) and the surface area of the Santa Rosa glacier in Peru.
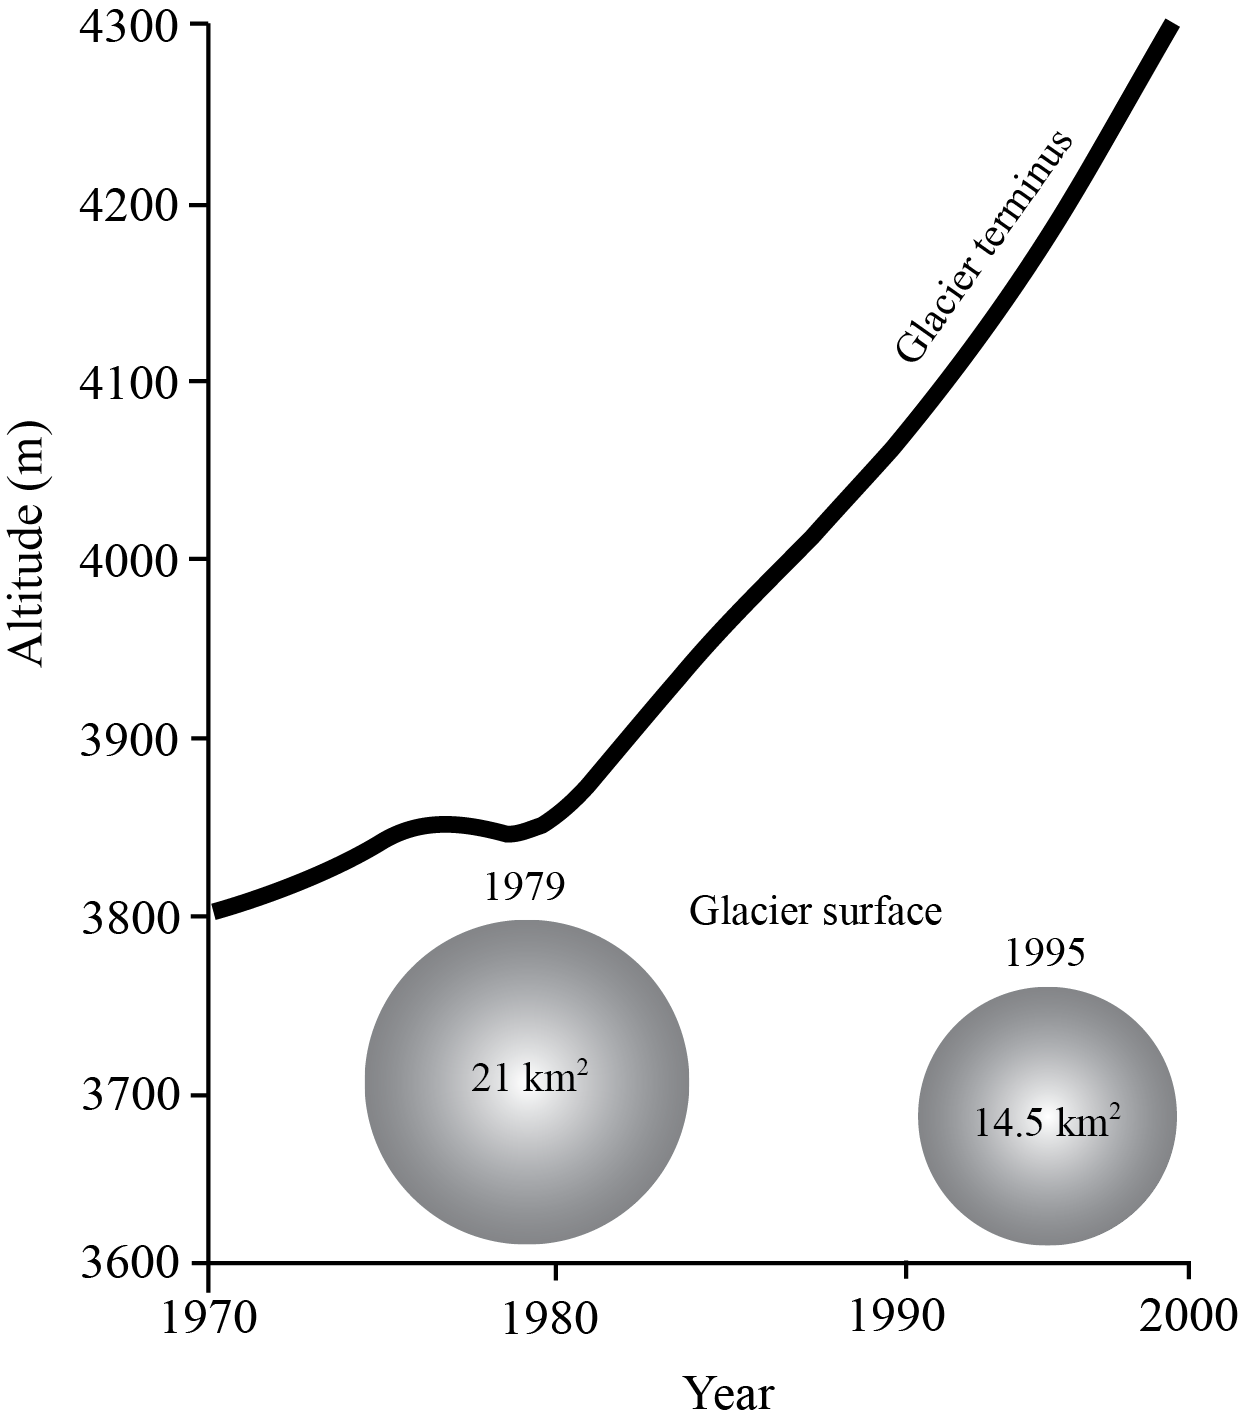
[Source: Peru National Communication to the UNFCCC2001]
Referring to the graph, describe the changes in the terminus of the Santa Rosa glacier from 1970–2000.
Explain the processes involved in the advance and retreat of glaciers.
Discuss the main environmental problems caused by tourism in one extreme environment.
Define glacial environment.
Define periglacial environment.
Explain how and why glaciers retreat.
“Periglacial areas offer more opportunities for human activity than glacial areas.” Discuss this statement.
Briefly outline two human factors that are possible causes of desertification in a hot, arid environment.
Briefly outline two physical factors that influence the occurrence of flash floods in hot, arid environments.
Explain three reasons why there are concentrations of people in some parts of hot, arid areas.
Examine the severity of the different challenges for resource development in periglacial areas.
The image shows changes in the melting of the Greenland ice sheet.
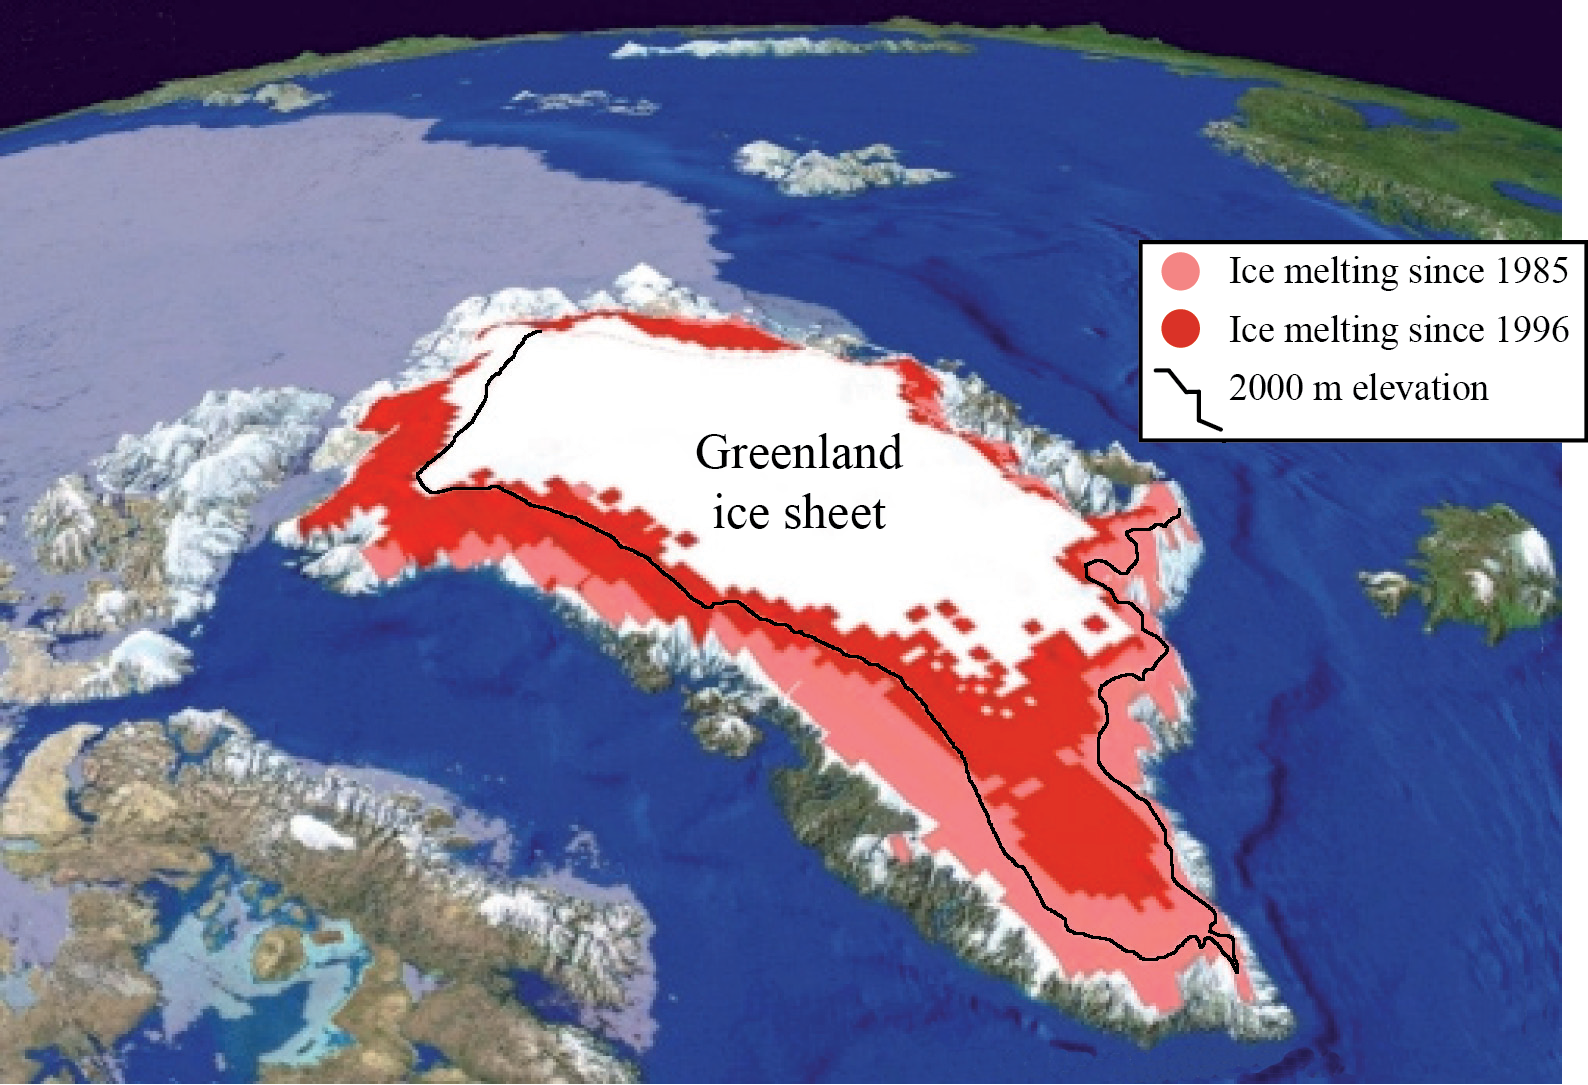
[©University of Colorado CIRES, courtesy Russel Huff and Konrad Steffen]
Describe the changes that have taken place in the Greenland ice sheet since 1985.
Explain how and why glaciers and ice masses have sometimes advanced.
“Agriculture in hot, arid areas inevitably results in desertification.” Discuss this statement.
Outline two ways in which people have adapted their outdoor activities to extremes of weather in hot, arid environments.
Distinguish between the terms “accumulation” and “ablation” in the glacial environment.
Explain two reasons why many glaciers are retreating.
“Global climate change will create more opportunities than challenges for indigenous populations.” Discuss this statement, with reference to one or more extreme environments.
The map shows different levels of aridity in Africa and the areas at most risk from climate change.
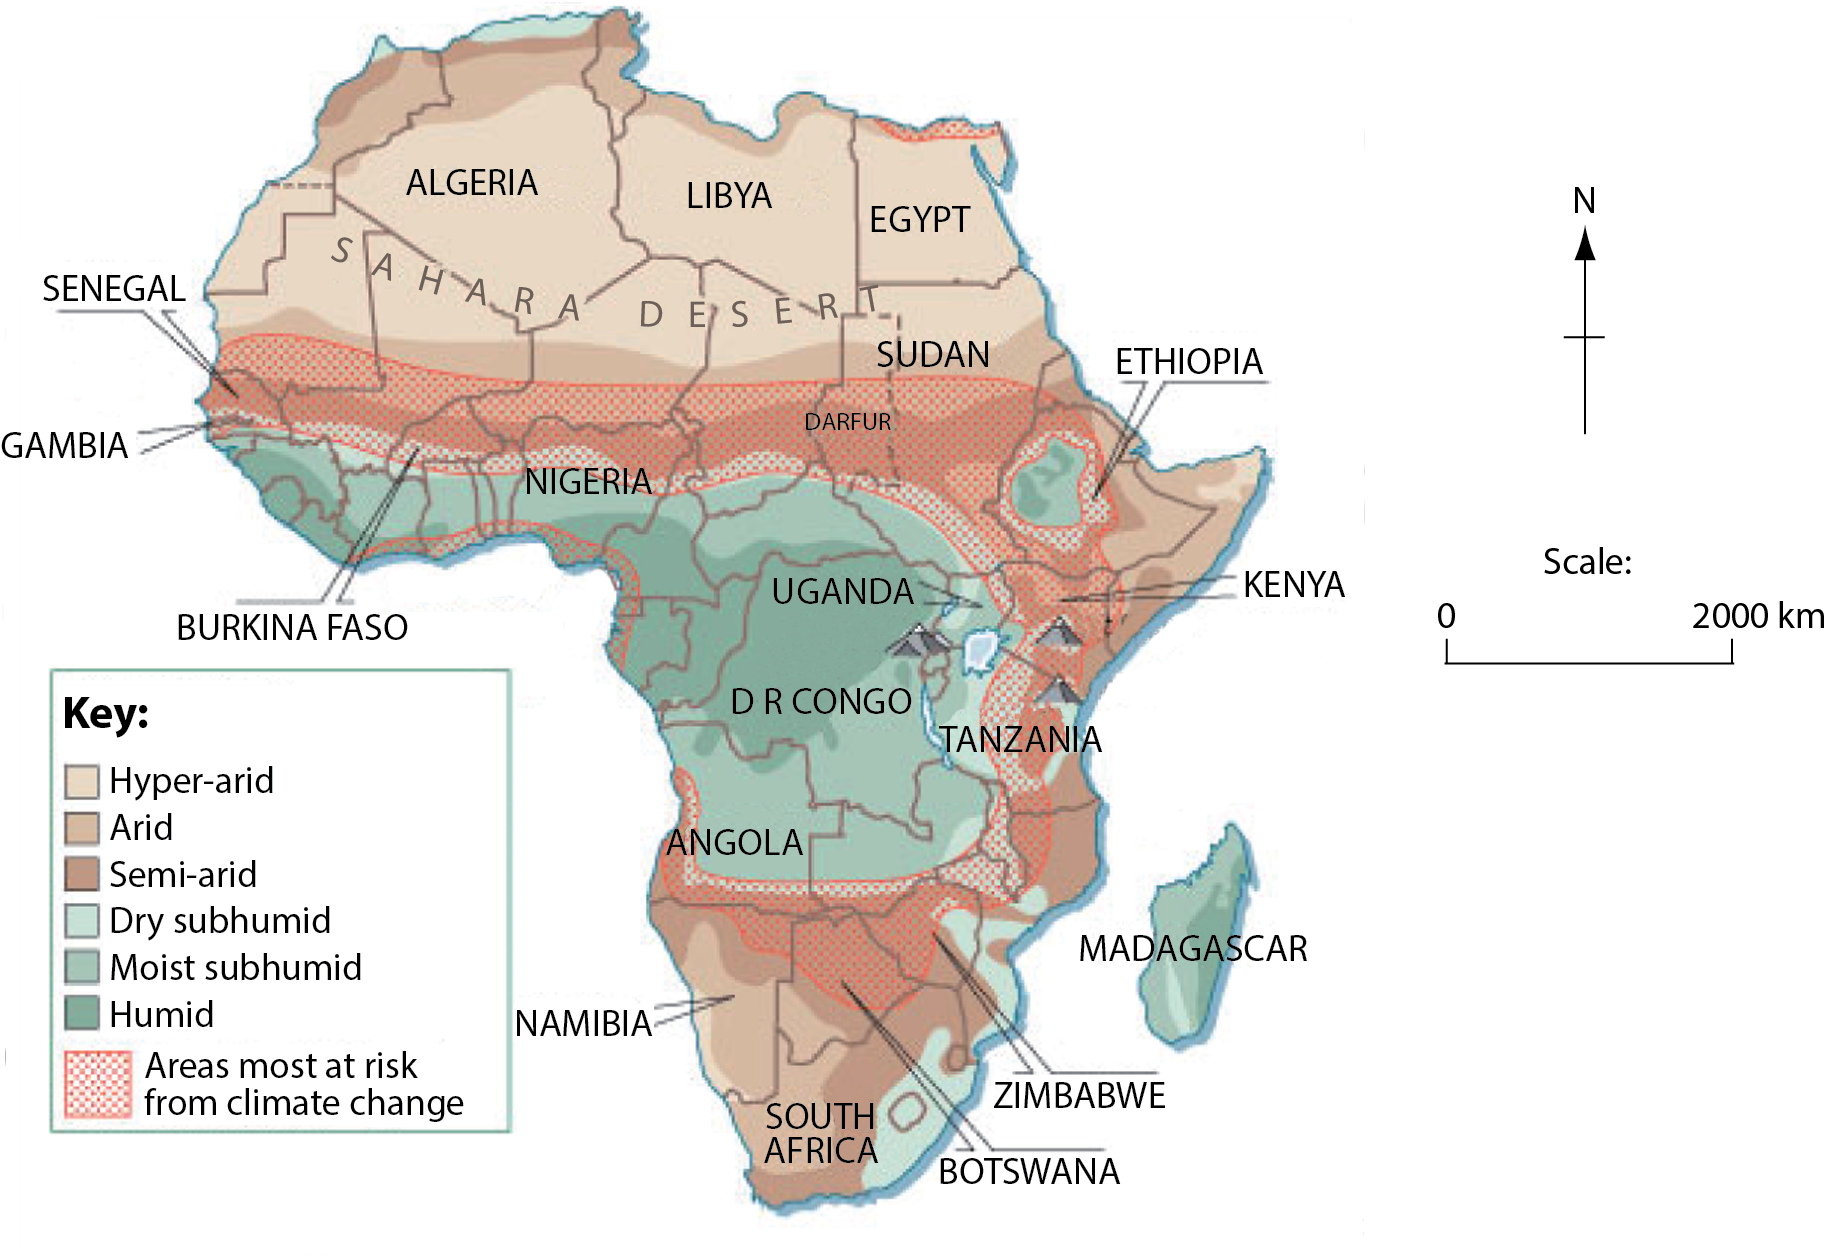
[Source: The Economist, 12 May 2007]
Describe the distribution of hyper-arid and semi-arid regions in Africa.
Using located examples, suggest possible socio-economic impacts of climate change for arid and/or semi-arid environments.
Examine the importance of water in the development of the landforms in any one extreme environment (glacial, periglacial, or hot, arid).
With reference to a named hot, arid environment, explain two geographic factors (other than climate) that can make them extreme.
Contrast the landforms that result from erosional and depositional glacial processes.
(i) Define the term aridity.
(ii) Define the term infertility.
Explain three factors, other than aridity and infertility, that affect the sustainability of human activities in extreme environments.
“Periglacial areas offer more opportunities for human activities than hot, arid areas.” Discuss this statement.
The maps show world population density and the location of hot, arid environments.
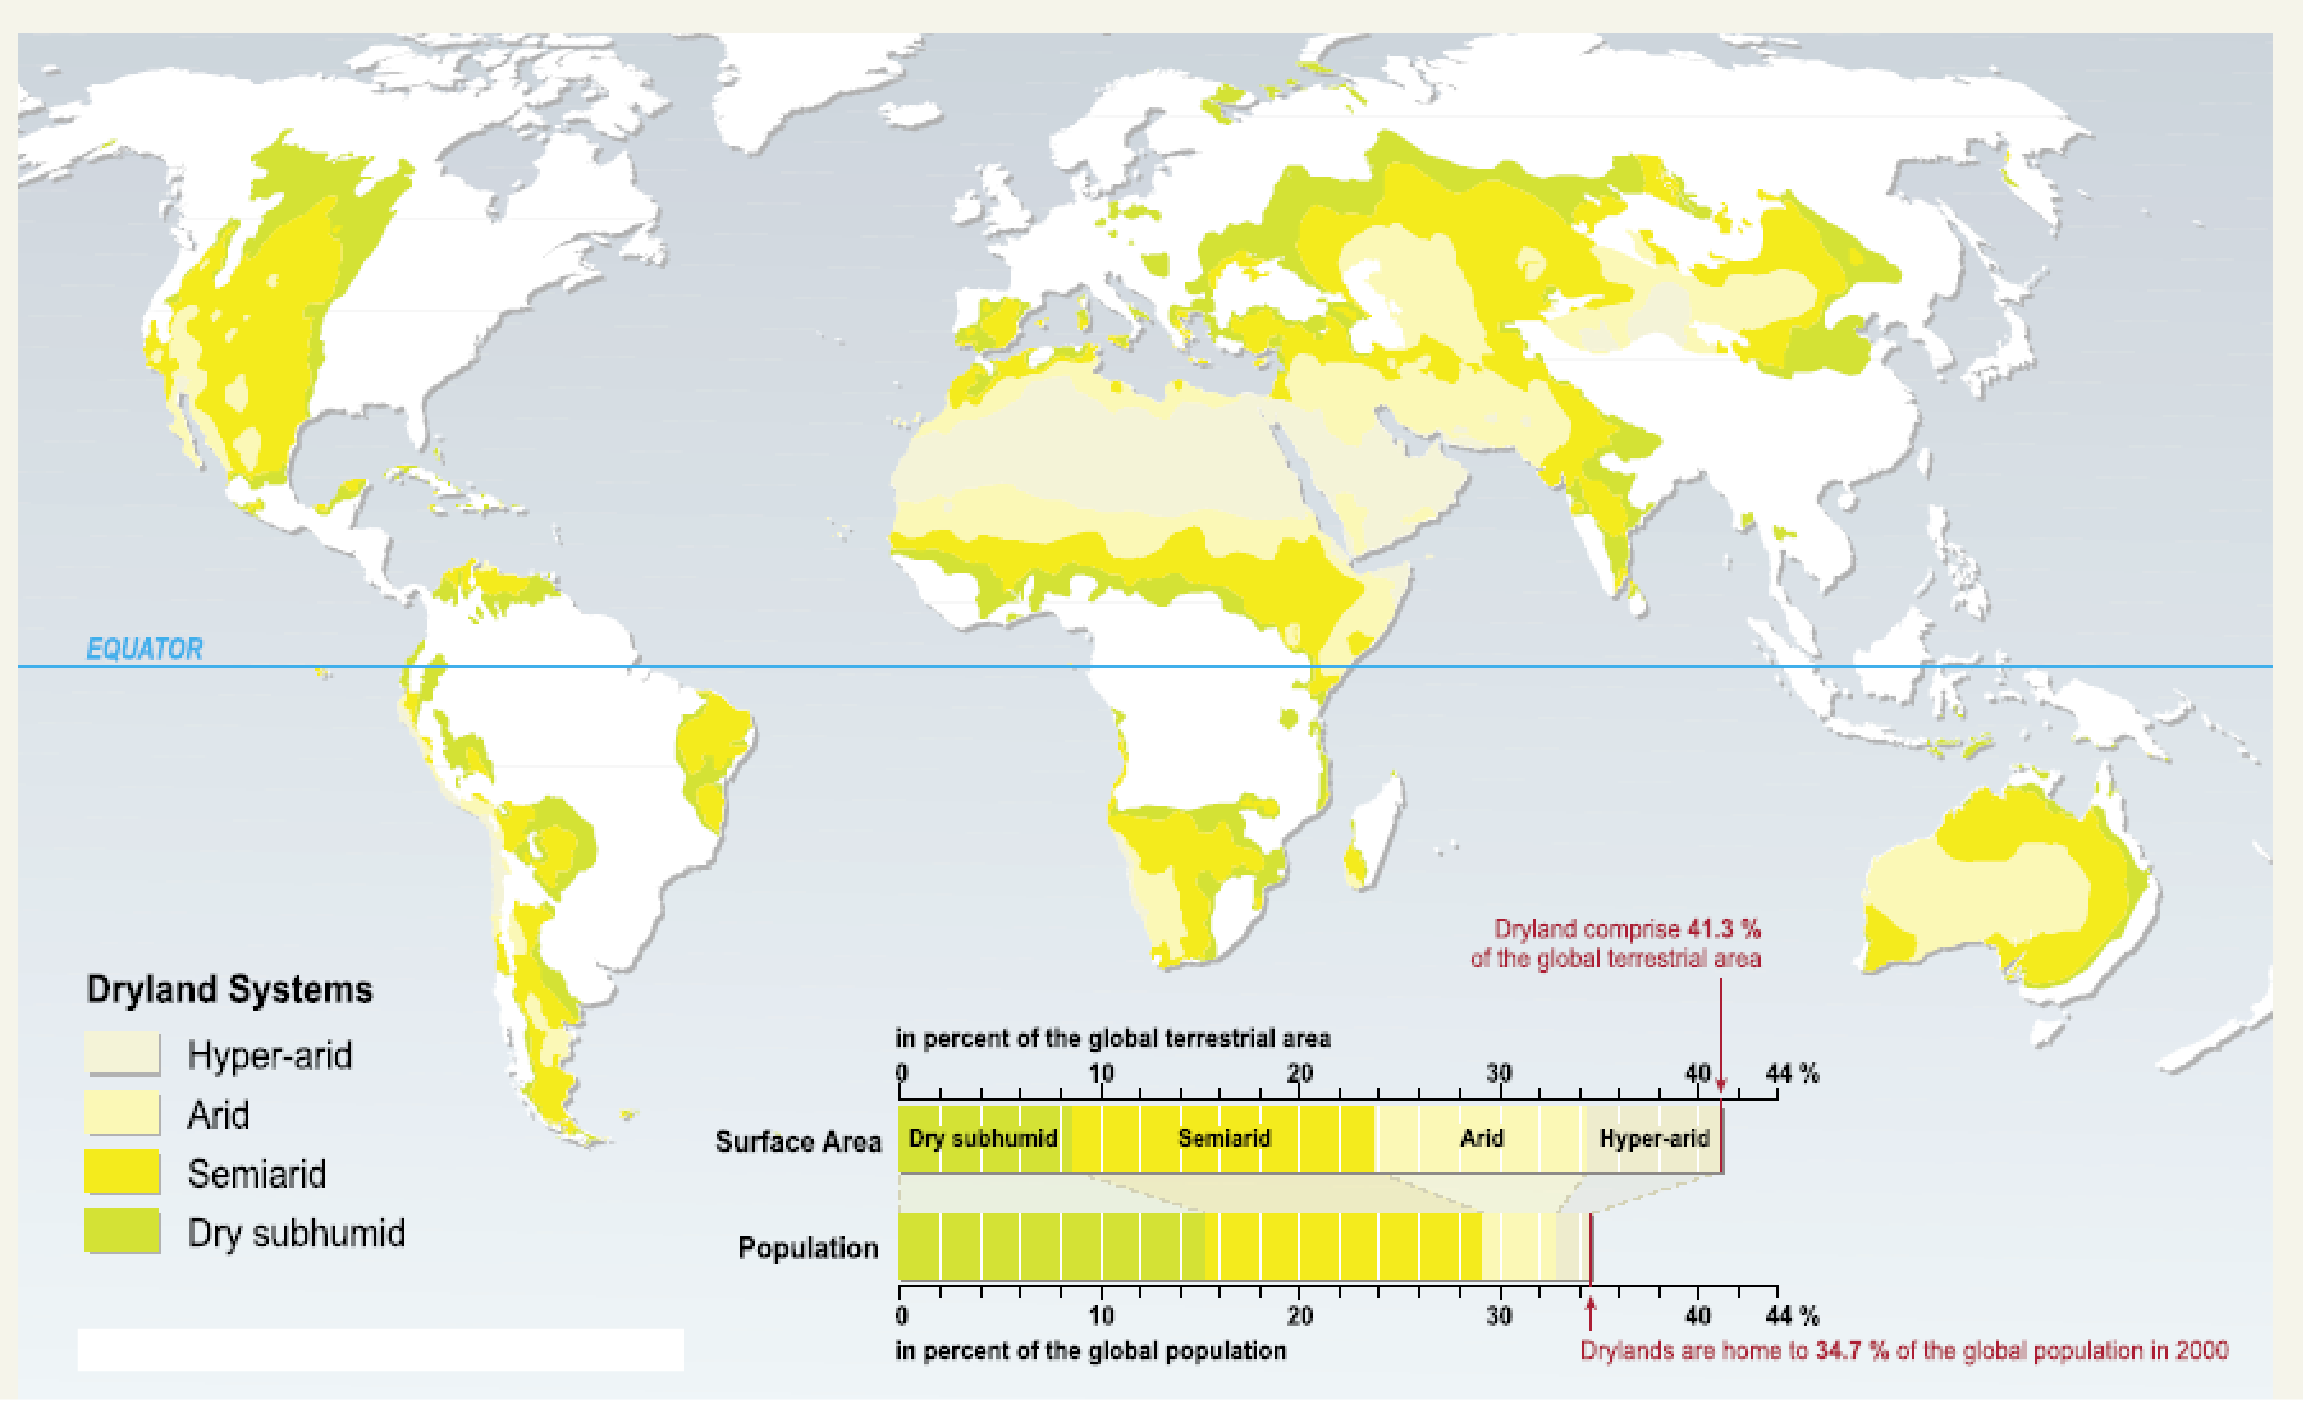
[Source: Millennium Ecosystem Assessment]
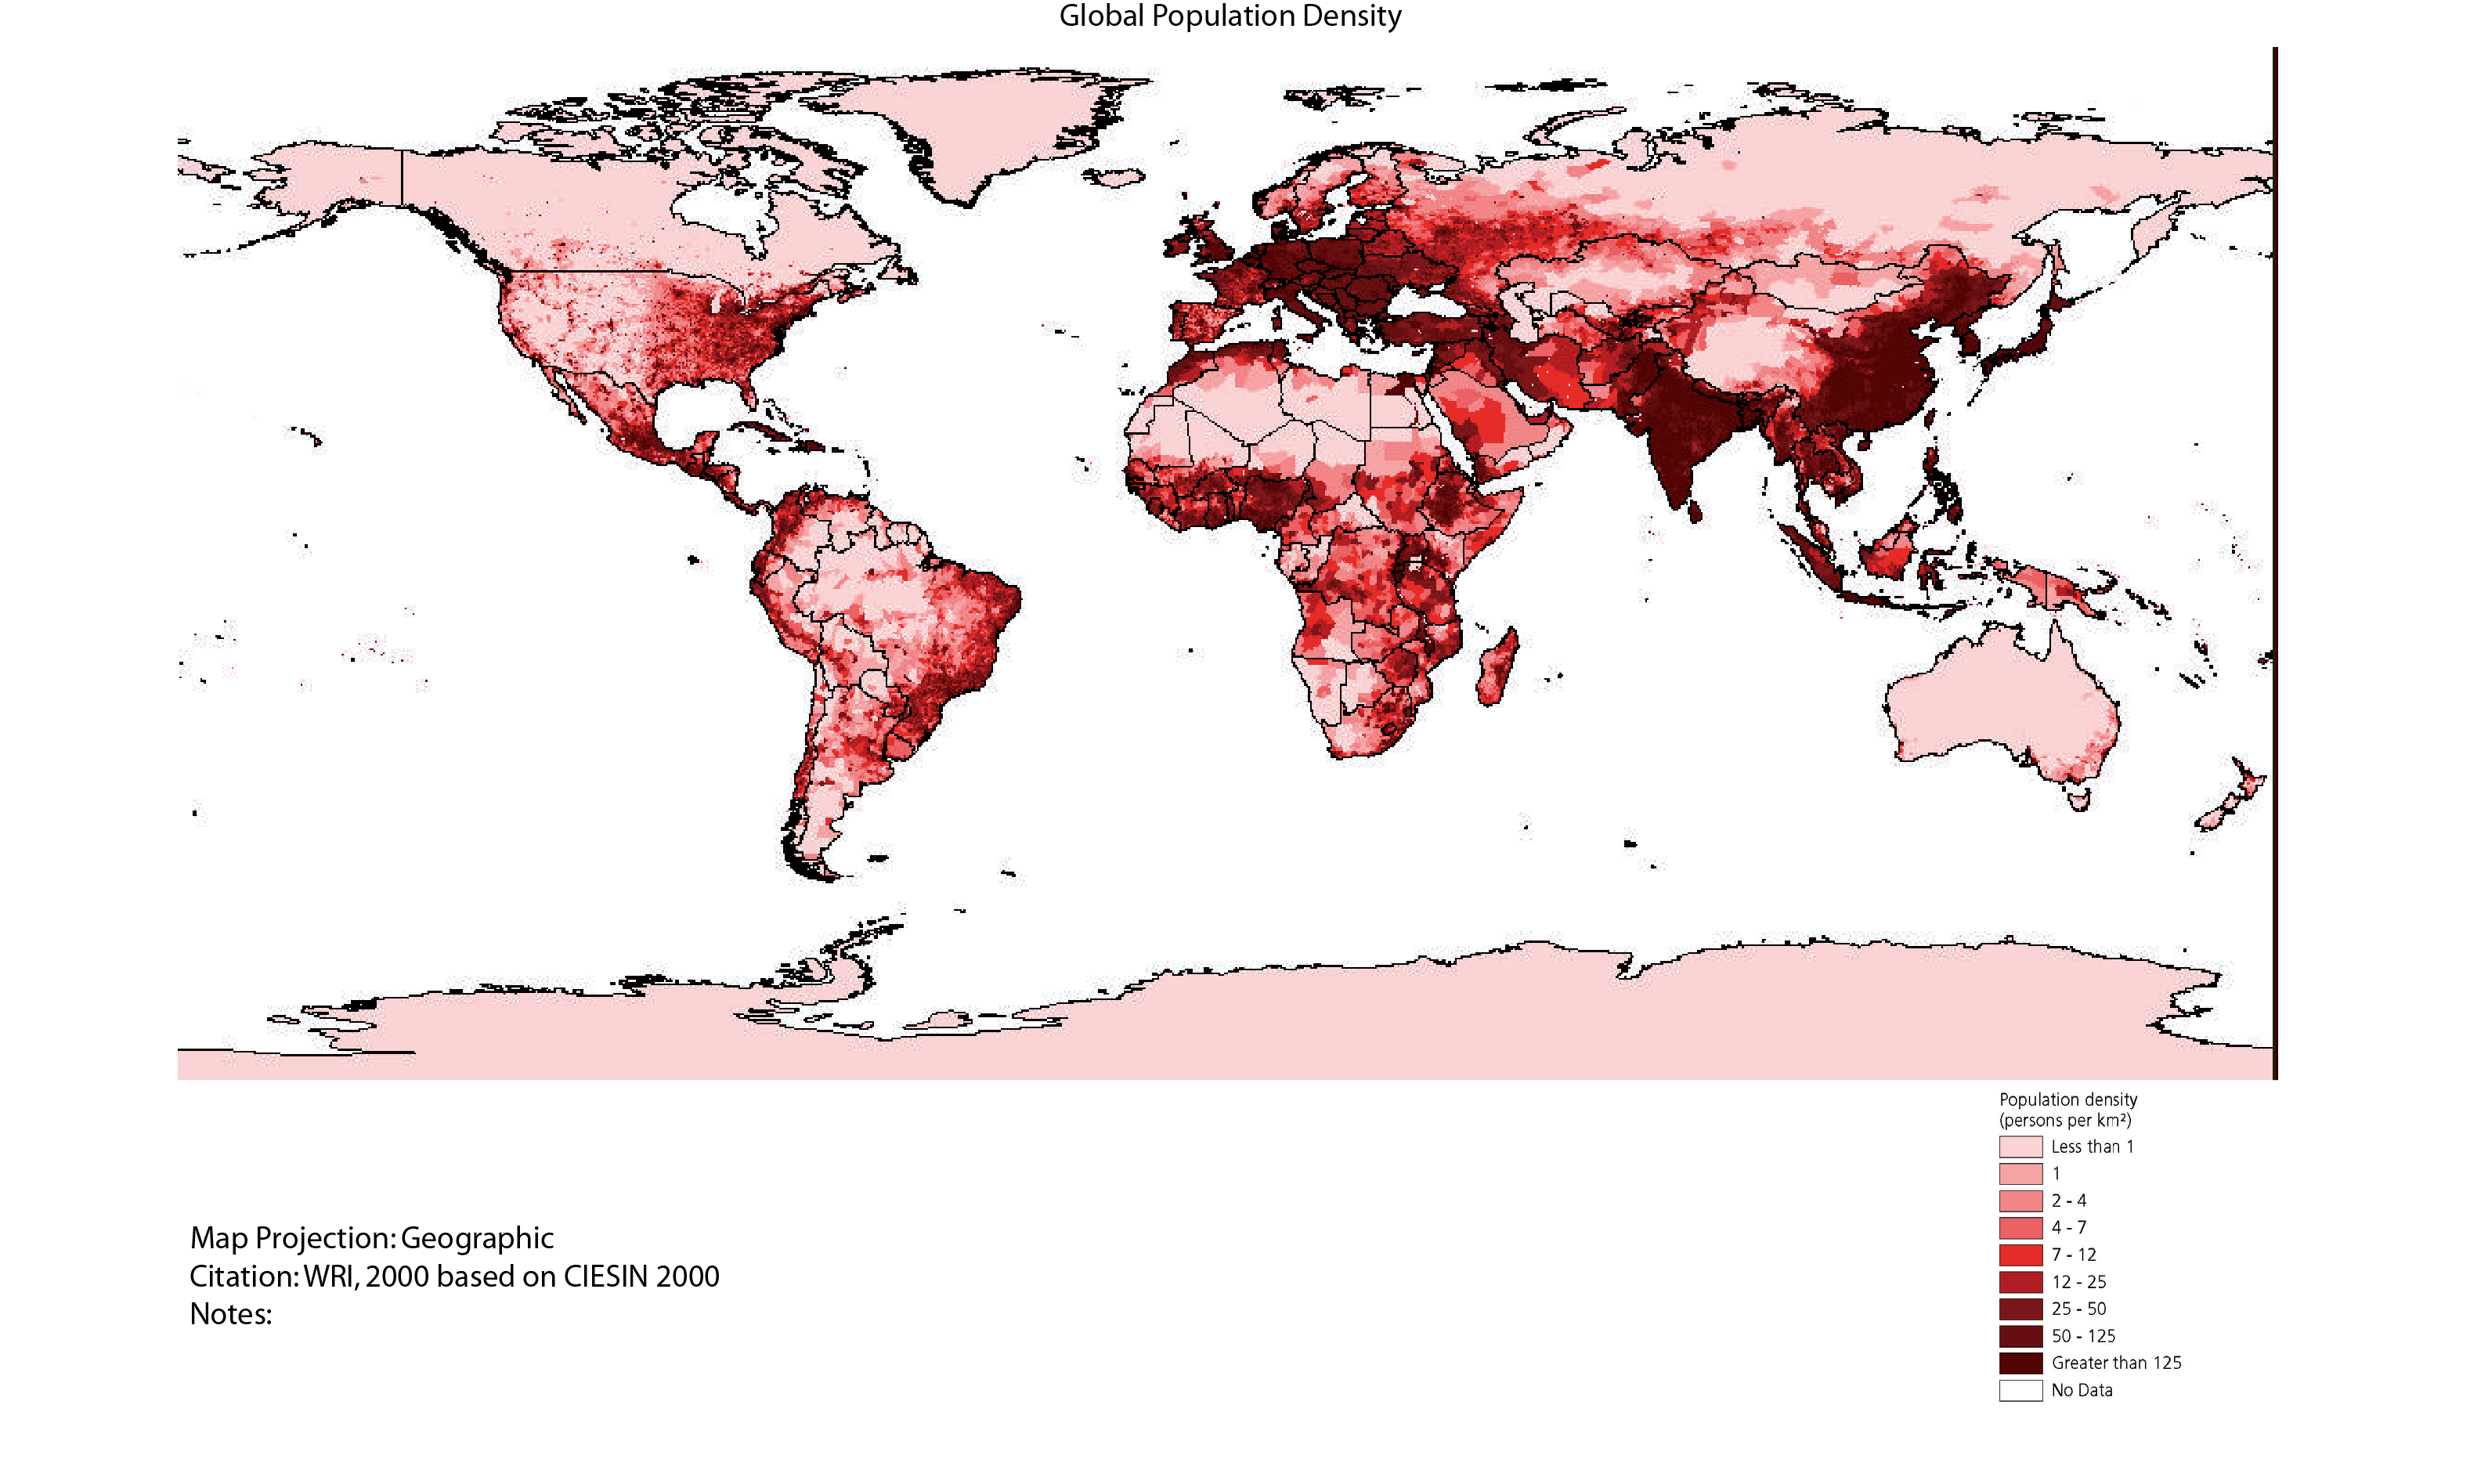
[Source: ©Earth Trends 2001 World Resources Institute]
Using the two maps, describe the population density in hot, arid areas.
Explain how and why the following factors may influence population density in hot, arid areas:
- human discomfort,
- inaccessibility.
Using examples, examine how extreme environments offer both challenges and opportunities for mineral extraction.
The photograph shows an arid landscape.
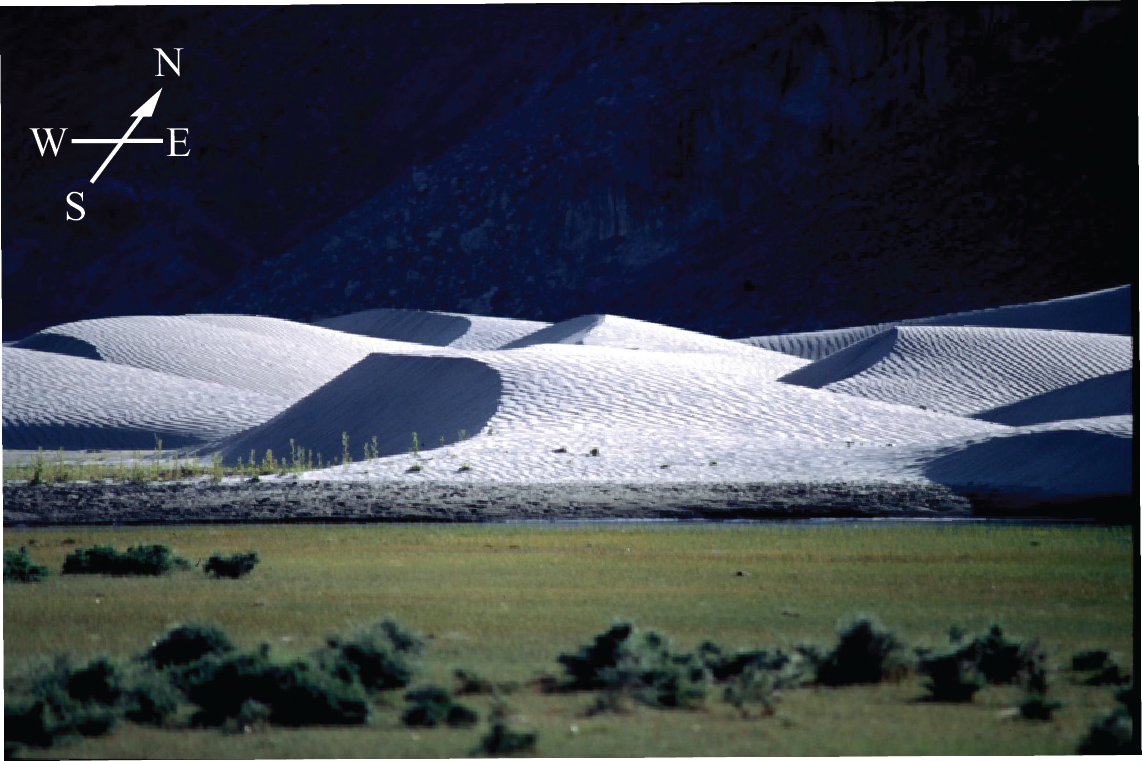
[Source: Trevor Cole ©www.coleimages.com]
(i) Name the landform in the background of the photograph.
(ii) State two processes of wind transport found in areas such as this.
(iii) State the direction from which the wind normally blows.
Explain the occurrence of flash floods in areas like the one shown in the photograph.
“The opportunities for tourism outweigh the challenges.” Discuss this statement with reference to one extreme environment.
Describe the climatic characteristics of either periglacial or glacial environments.
Explain two landforms associated with deposition by glaciers.
Examine the opportunities and challenges for agriculture in hot, arid areas.
The photograph shows a periglacial landscape in southern Iceland.
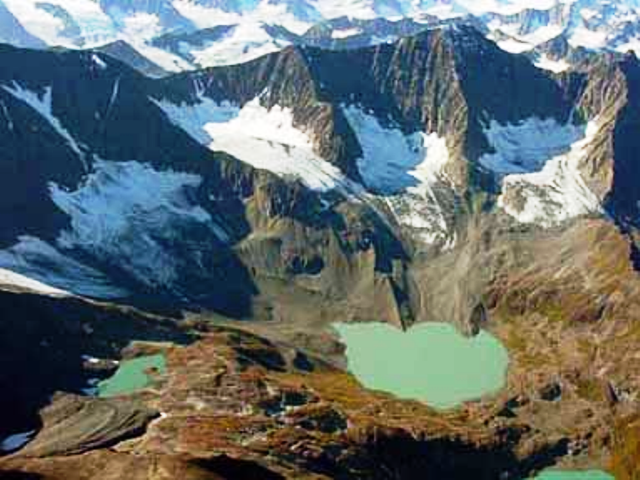
[Source: Copyright Bruce Molnia, Courtesy Earth Science World Image Bank (http://www.earthscienceworld.org/images)]
Briefly describe two erosional landforms shown in this photograph.
Explain three ways in which the characteristics of periglacial environments hinder resource development.
With reference to one or more extreme environments, discuss whether human activities can be sustainable.
The diagram shows temperature conditions for a year in a periglacial region of the northern hemisphere.
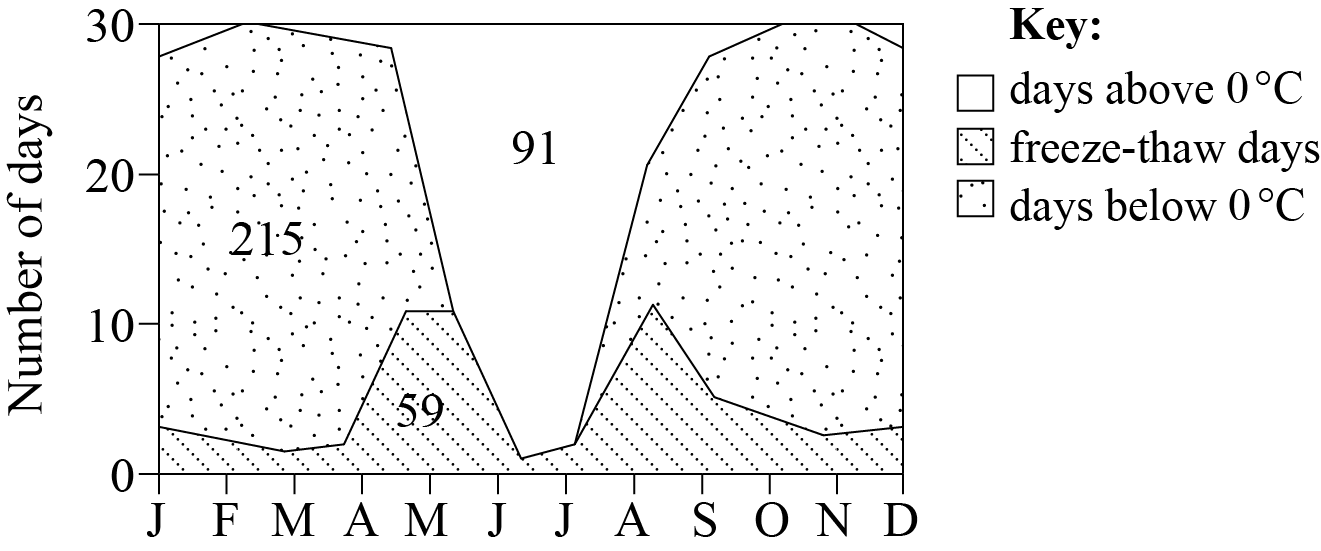
[Source: H French, The Periglacial Environment, Longman, (1996), page 24]
Define the term freeze-thaw.
Describe the seasonal variations in the number of freeze-thaw days.
Explain the importance of freeze-thaw cycles and solifluction processes for the development of periglacial landforms.
Examine how the physical characteristics of any one extreme environment (glacial, periglacial, or hot, arid) affect resource development.
The graph shows the change in the volume of ice for one glacier from 1850 to 2010.

[Source: Reprinted from the Annals of Glaciology with permission of the International Glaciological Society]
Estimate the volume of ice lost between 1850 and 1950.
State the year when the glacier began a continuous decline lasting to 2010.
Suggest why a short-term increase in glacial ice (positive balance) begins around 1950.
Distinguish between aridity and infertility in hot, arid areas.
Examine the causes and consequences of the melting of permafrost.
Outline two physical causes of aridity in hot, arid environments.
Explain two processes of weathering commonly found in hot, arid environments.
“Human activity within periglacial environments is unsustainable.” Discuss this statement.
The graph shows climatic data for an extreme arid environment.

(i) Identify the month with the highest rainfall.
(ii) Estimate the annual temperature range.
(iii) Suggest why October is a more challenging month for human activity than June.
Explain two processes of weathering or erosion that operate in hot, arid areas.
“All cold extreme environments are equally challenging for human activity.” Discuss this statement.
The diagram shows a cross-section of the location of permanently frozen ground (permafrost).

Describe how the characteristics of permafrost vary with latitude.
Outline how the seasonal changes taking place in the active layer differ between 50°N and 60°N.
Explain two ways in which the active layer creates challenges for settlement and/or communications in a permafrost area.
“The opportunities for mineral extraction outweigh the challenges in hot, arid areas.” Discuss this statement.
The map shows a polar view of the Southern Hemisphere and locates Antarctica, an area experiencing an extreme environment.

(i) Estimate the distance of Mawson Station from the South Pole.
(ii) Estimate the latitude of the Vinson Massif.
(iii) State two reasons why most of Antarctica is covered in ice.
Referring to at least one example, suggest three reasons why mineral extraction has led to the growth of settlements in extreme environments.
Using located examples, discuss the opportunities and risk associated with the use of irrigation in hot, arid environments.
The climate graph is of Arkhangelsk (64°N, 60°E), a periglacial area in northern Russia.

From information shown on the graph:
(i) State the number of months of the year when the average temperature is below 0°C.
(ii) Estimate the annual temperature range in °C.
(iii) Apart from temperature, outline one other climatic characteristic shown on the graph that indicates Arkhangelsk is located in an extreme environment.
Explain three ways in which people have adapted to the extremes of weather and climate in periglacial areas such as Arkhangelsk.
“Desertification is the main environmental risk for agriculture in hot deserts and semi-arid areas.” Discuss this statement, with reference to examples.
The graph shows the probability (likelihood) of the depth of snow on a ski field being over 1 metre, and over 2 metres, between June and October.

[Source: Michael Paine]
State the earliest date on which there is a 50 % probability of snow depth exceeding 1 metre.
Estimate the probability of snow depth exceeding 2 metres on 1 September.
Briefly explain how the graph provides evidence that this ski field is located in the southern hemisphere.
Explain two environmental impacts of tourism in one named extreme environment.
Compare the importance of water and wind in the development of landform features in hot, arid areas.
The diagram shows the proportions of land and water at each degree of latitude and the locations of some cold extreme environments.

(i) Estimate the latitude at which the percentage of land is highest in the Northern Hemisphere.
(ii) State one reason why extreme cold environments can even be found at latitude A.
(iii) Briefly outline the seasonal variations in temperature likely to be found at latitude B.
Explain the characteristics and formation in periglacial environments of:
(i) patterned ground;
(ii) thermokarst.
Referring to examples, evaluate the varied economic opportunities in hot, arid environments.
Optional Theme C — Extreme environments
6. The map of Australia shows regions that are at high risk of desertification.

(i) Define the term desertification.
(ii) Describe the pattern of areas with a high risk of desertification shown on the map.
Suggest three reasons why some rainstorms in hot, arid environments result in flash floods.
Examine how human activity may be affected by global climate change in one named extreme environment.
The photograph shows a feature formed by erosion in the Atacama Desert in Chile.

(i) Outline the main erosional process that accounts for the feature shown in the photograph.
(ii) Identify and explain the formation of one water-formed feature commonly found in a hot, arid environment.
Explain how two factors (other than heat) restrict human settlement in hot, arid environments.
“Some human activities in extreme environments are more sustainable than others.” Discuss this statement, with reference to one or more types of extreme environment.
The two photographs show the Qori Kalis Glacier, Quelccaya Ice Cap, Peru. Photograph A was taken in summer 1978; photograph B was taken in summer 2002.


Describe two changes in the landscape shown by the two photographs that demonstrate glacial retreat.
Explain the formation of two features resulting from the processes of glacial and/or fluvioglacial deposition.
Using examples, discuss the opportunities for agriculture in hot, arid areas.
The photograph was taken at 68° North.
Referring to the photograph, briefly describe how people have adapted their clothing and transport in order to live in extreme cold environments.
Explain two causes of low rainfall in hot, arid environments.
Examine how tourism in one type of extreme environment has led to a wide range of adverse environmental impacts.
Option C — Extreme environments
The photograph shows a hot, arid landscape.

(i) Identify any one landform shown in area A on the photograph.
(ii) Suggest how landform B in the photograph was formed.
Explain two environmental impacts of tourism on one named extreme environment.
Contrast the challenges for mineral extraction in periglacial environments and hot, arid environments.
Optional Theme C — Extreme environments
5. The map extract shows a glaciated area of South Island, New Zealand. The scale of the map is 1:250 000. The contour interval is 100 m.


(i) Identify and describe a landform of glacial erosion in area A on the map.
(ii) Identify and describe a landform of glacial erosion in area B on the map.
Using map evidence, suggest two reasons why the area shown on the map has a low population density.
“Mineral resources in extreme environments rarely bring benefits to the local people.” Discuss this statement.


Identify the vegetation types found at A and B.
Using the map extract and key, suggest two reasons why the area shown could be considered an extreme environment.
Briefly explain two weathering processes likely to operate in area C on the map.
For one named type of extreme environment, examine the impacts of tourism on the natural environment.
The map extract shows a glaciated area of part of the Lake District in the north-west of England. The scale of the map is 1:25 000. The contour interval is 10 metres. The key for the map extract is below.

[Source: © Crown copyright 2018. Ordnance Survey 100041139.]

Identify one landform of glacial erosion in square 3415.
State the name of one U-shaped valley/trough shown on the map.
Estimate the length in kilometres of the walking track between the start of the walking track (footpath) at Highpark Wood (3116) to the summit of Helvellyn (3415).
State the height gained from the spot height in square 3315 to the triangulation pillar in square 3415.
Using map evidence, explain one reason, other than climate, why mining in this extreme environment is challenging.
Explain the formation of one feature or landform of glacial deposition.
Examine how the balance between challenges and opportunities affects economic activities in one or more extreme environments.