SL Paper 3
Amino acids are the building blocks of proteins.
Draw the dipeptide represented by the formula Ala-Gly using section 33 of the data booklet.
Deduce the number of 1H NMR signals produced by the zwitterion form of alanine.
Outline why amino acids have high melting points.
Markscheme
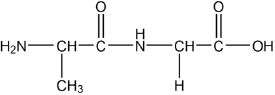
peptide bond
order of amino acids
Accept zwitterion form of dipeptide.
Accept a condensed structural formula or a skeletal structure.
Penalize missing hydrogens or incorrect bond connectivities once only in Option B.
[2 marks]
3
[1 mark]
form zwitterions
«strong» ionic bonding
OR
«strong» ionic lattice
OR
«strong» electrostatic attraction/forces
Do not accept hydrogen bonding or IMFs for M2.
[2 mark]
Examiners report
Students were asked to investigate how a change in concentration of hydrochloric acid, HCl, affects the initial rate of its reaction with marble chips, CaCO3.
They decided to measure how long the reaction took to complete when similar chips were added to 50.0 cm3 of 1.00 mol dm−3 acid and 50.0 cm3 of 2.00 mol dm−3 acid.
Two methods were proposed:
(1) using small chips, keeping the acid in excess, and recording the time taken for the solid to disappear
(2) using large chips, keeping the marble in excess, and recording the time taken for bubbles to stop forming.
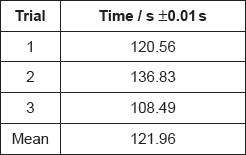
A group recorded the following results with 1.00 mol dm−3 hydrochloric acid:
Annotate the balanced equation below with state symbols.
CaCO3(__) + 2HCl(__) → CaCl2(__) + CO2(__) + H2O(__)
Neither method actually gives the initial rate. Outline a method that would allow the initial rate to be determined.
Deduce, giving a reason, which of the two methods would be least affected by the chips not having exactly the same mass when used with the different concentrations of acid.
State a factor, that has a significant effect on reaction rate, which could vary between marble chips of exactly the same mass.
Justify why it is inappropriate to record the uncertainty of the mean as ±0.01 s.
If doubling the concentration doubles the reaction rate, suggest the mean time you would expect for the reaction with 2.00 mol dm−3 hydrochloric acid.
Another student, working alone, always dropped the marble chips into the acid and then picked up the stopwatch to start it. State, giving a reason, whether this introduced a random or systematic error.
Markscheme
CaCO3(s) + 2HCl(aq) → CaCl2(aq) + CO2(g) + H2O(l)
Accept “CO2(aq)”.
[1 mark]
measure the volume of gas at different times «plot a graph and extrapolate»
OR
measure the mass of the reaction mixture at different times «plot a graph and extrapolate»
Accept other techniques that yield data which can be plotted and extrapolated.
[1 mark]
method 2 AND marble is in excess «so a little extra has little effect»
OR
large chips AND marble is in excess «so a little extra has little effect»
OR
method 2 AND HCl is limiting reagent «so a little extra marble has little effect»
OR
large chips AND HCl is limiting reagent «so a little extra marble has little effect»
Accept, as a reason, that “as the mass is greater the percentage variation will be lower”.
[1 mark]
surface area
OR
purity «of the marble»
Accept “shape of the chip”.
[1 mark]
variation of individual values is much greater «than this uncertainty»
OR
«uncertainty» does not take into account «student» reaction time
[1 mark]
«\(\frac{{121.96{\text{ s}}}}{2}\) = 60.98 s» = 61 «s»
[1 mark]
systematic AND always makes the time shorter «than the actual value»
OR
systematic AND it is an error in the method used «not an individual measurement»
OR
systematic AND more repetitions would not reduce the error
Accept, as reason, “it always affects the value in the same direction” OR “the error is consistent”.
[1 mark]
Examiners report
Analytical techniques are very useful in determining molecular structures. A compound, X, has the empirical formula \({{\text{C}}_{\text{2}}}{{\text{H}}_{\text{4}}}{\text{O}}\).
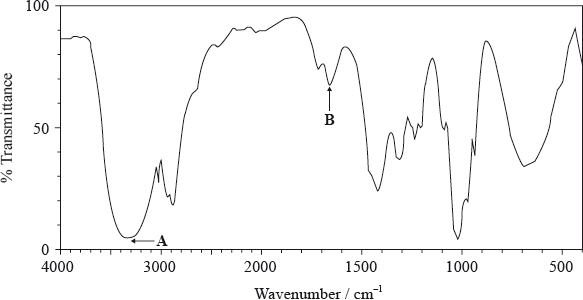
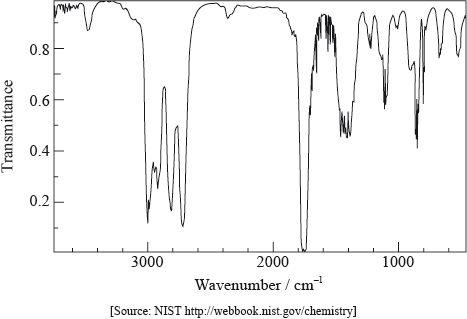
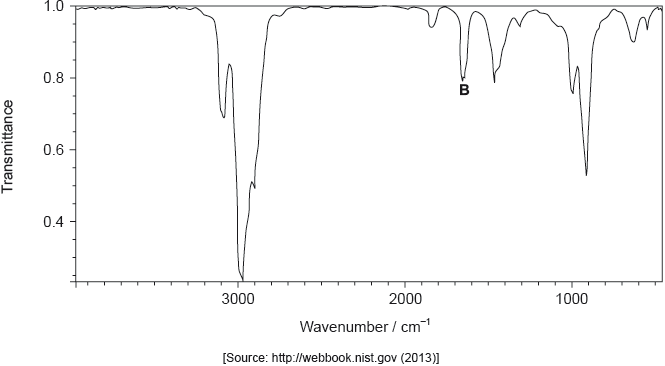
The molecular formula of X is \({{\text{C}}_{\text{4}}}{{\text{H}}_{\text{8}}}{{\text{O}}_{\text{2}}}\). The information in the IR spectrum below can be used to help determine the structure of X.
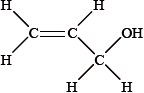
The \(^{\text{1}}{\text{H}}\,{\text{NMR}}\) spectrum of X shows three peaks with relative areas of 2:1:1.
Identify the analytical technique that would most readily provide the additional data required to calculate the molecular formula of X.
(i) State what information about a molecule can be obtained from its IR spectrum.
(ii) Deduce the information obtained from absorptions A and B.
A:
B:
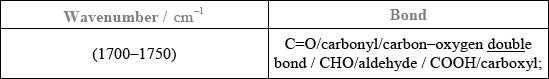
(iii) Comment on the absence of any major absorption in the region 1700–1750 \({\text{c}}{{\text{m}}^{ - 1}}\).
(i) Deduce what information can be obtained from these data.
(ii) Deduce the structure of X.
Markscheme
mass spectrometry/spectroscopy / MS;
(i) presence (or absence) of particular bonds;
Accept functional groups.
(ii) A: O–H/hydroxyl;
B: C=C/carbon-carbon double bond;
(iii) no C=O/carbonyl present;
(i) protons/H’s in three different chemical environments / OWTTE;
2:1:1 ratio of protons/H’s (in these environments) / OWTTE;
Accept 4:2:2
(ii) HO–\({\text{C}}{{\text{H}}_{\text{2}}}\)–CH=CH–\({\text{C}}{{\text{H}}_{\text{2}}}\)–OH / \({\text{C}}{{\text{H}}_{\text{2}}}\)=\({\text{C(C}}{{\text{H}}_{\text{2}}}{\text{OH}}{{\text{)}}_{\text{2}}}\);
Examiners report
Candidates were for the most part, able to correctly deduce the structural features from the different spectroscopic evidence but were not able to deduce the structure of X as the molecular formula was not considered.
Candidates were for the most part, able to correctly deduce the structural features from the different spectroscopic evidence but were not able to deduce the structure of X as the molecular formula was not considered.
Candidates were for the most part, able to correctly deduce the structural features from the different spectroscopic evidence but were not able to deduce the structure of X as the molecular formula was not considered.
Infrared spectroscopy is commonly used as an analytical technique by inorganic, physical and organic chemists.
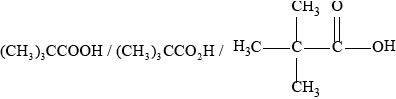
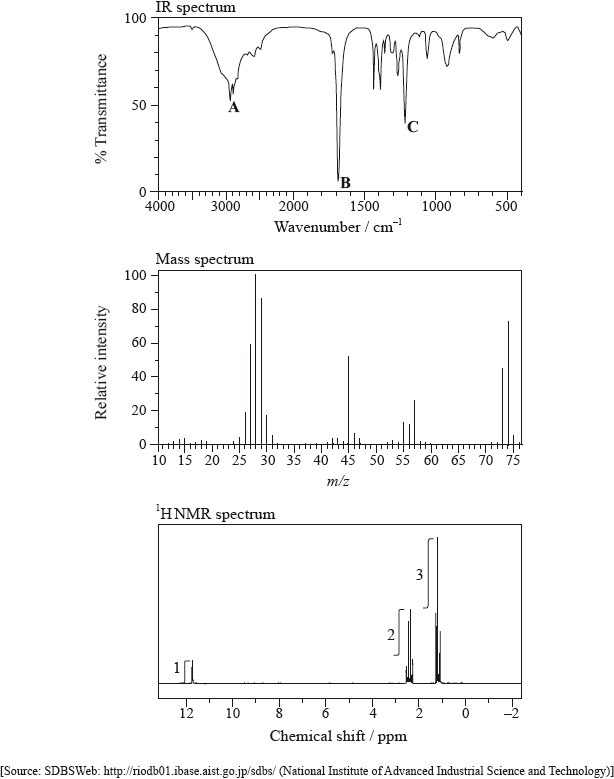
The IR spectrum, mass spectrum and \(^{\text{1}}{\text{H}}\,{\text{NMR}}\) spectrum of an unknown compound, X, of molecular formula \({{\text{C}}_{\text{5}}}{{\text{H}}_{{\text{10}}}}{{\text{O}}_{\text{2}}}\), are as follows.
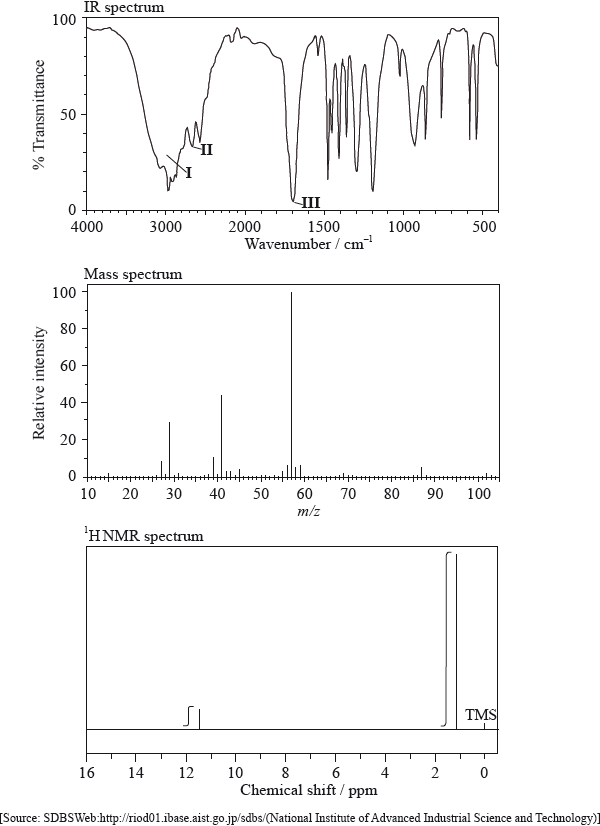
In the IR spectrum, identify the bond responsible for each of the absorptions labelled I, II and III.
I:
II:
III:
In the mass spectrum, deduce which fragments the m/z values at 102, 57 and 45 correspond to.
m/z =102:
m/z = 57:
m/z = 45:
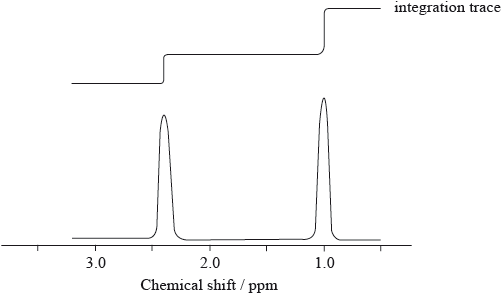
Identify the peak at 11.5 ppm in the \(^{\text{1}}{\text{H}}\,{\text{NMR}}\) spectrum.
State what information can be obtained from the integration traces in the \(^{\text{1}}{\text{H}}\,{\text{NMR}}\) spectrum about the hydrogen atoms responsible for the peak at 1.2 ppm.
Deduce the structure of X.
\({\text{C}}{{\text{H}}_{\text{3}}}{\text{COOC}}{{\text{H}}_{\text{2}}}{\text{C}}{{\text{H}}_{\text{2}}}{\text{C}}{{\text{H}}_{\text{3}}}\) is an isomer of X. Deduce two differences between the \(^{\text{1}}{\text{H}}\,{\text{NMR}}\) spectrum of this isomer and that of X.
Markscheme
I: O–H;
II: C–H;
III: C=O;
Award [2] for C–H for I and O–H for II.
m/z = 102: molecular ion peak / \({{\text{(C}}{{\text{H}}_3}{\text{)}}_3}{\text{CCOO}}{{\text{H}}^ + }/{{\text{C}}_5}{{\text{H}}_{10}}{\text{O}}_2^ + /{{\text{M}}^ + }\);
m/z = 57: \({{\text{(C}}{{\text{H}}_3}{\text{)}}_3}{{\text{C}}^ + }\) / \({{\text{(M}}–{\text{COOH)}}^ + }\) / \({{\text{C}}_4}{\text{H}}_9^ + \);
m/z = 45: \({\text{COO}}{{\text{H}}^{\text{ + }}}\);
Penalize missing + once only.
(H of) COOH group;
nine hydrogens in the same environment / \({{\text{(C}}{{\text{H}}_3}{\text{)}}_3}{\text{C}}–{\text{(group)}}\);
 ;
;
no peak at 11.5 ppm in spectrum of isomer / different chemical shift values;
four peaks (instead of two) / different number of peaks;
Three of these peaks can be split in actual spectrum, so allow for this in answers if exactly four peaks is not stated.
different integration trace / different areas under the peaks / integration trace would have a 3:2:2:3 peak area ratio;
Do not award mark if incorrect peak area ratios are given for the structure drawn in (v).
Examiners report
In (b) most candidates confused the IR absorptions of O-H and C-H bonds. The positive charge was frequently omitted from the mass spectroscopy fragments and the number of hydrogen atoms in the same chemical environment was often not stated. Most candidates were unable to coordinate all the spectroscopic data to deduce the tertiary structure.
In (b) most candidates confused the IR absorptions of O-H and C-H bonds. The positive charge was frequently omitted from the mass spectroscopy fragments and the number of hydrogen atoms in the same chemical environment was often not stated. Most candidates were unable to coordinate all the spectroscopic data to deduce the tertiary structure.
In (b) most candidates confused the IR absorptions of O-H and C-H bonds. The positive charge was frequently omitted from the mass spectroscopy fragments and the number of hydrogen atoms in the same chemical environment was often not stated. Most candidates were unable to coordinate all the spectroscopic data to deduce the tertiary structure.
In (b) most candidates confused the IR absorptions of O-H and C-H bonds. The positive charge was frequently omitted from the mass spectroscopy fragments and the number of hydrogen atoms in the same chemical environment was often not stated. Most candidates were unable to coordinate all the spectroscopic data to deduce the tertiary structure.
In (b) most candidates confused the IR absorptions of O-H and C-H bonds. The positive charge was frequently omitted from the mass spectroscopy fragments and the number of hydrogen atoms in the same chemical environment was often not stated. Most candidates were unable to coordinate all the spectroscopic data to deduce the tertiary structure.
In (b) most candidates confused the IR absorptions of O-H and C-H bonds. The positive charge was frequently omitted from the mass spectroscopy fragments and the number of hydrogen atoms in the same chemical environment was often not stated. Most candidates were unable to coordinate all the spectroscopic data to deduce the tertiary structure.
Distinguish between the \(^{\text{1}}{\text{H}}\,{\text{NMR}}\) spectra of 1-bromopropane and 2-bromopropane (splitting patterns are not required).
Markscheme
2-bromopropane will show two separate absorptions/peaks;
in the ratio 6:1;
1-bromopropane will show three separate absorptions/peaks;
in the ratio 3:2:2;
Examiners report
In (a) most candidates correctly determined the difference in the number of peaks in the \(^{\text{1}}{\text{H}}\,{\text{NMR}}\) spectra of 1- bromopropane and 2 – bromopropane but neglected to mention or misinterpreted the differences in area under the peaks.
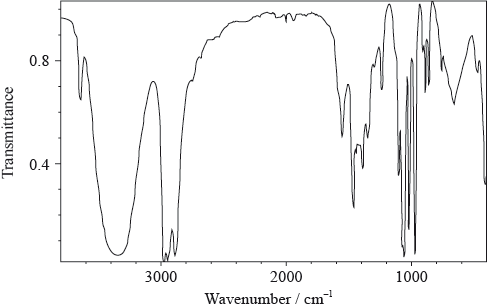
The structures of oseltamivir (Tamiflu) and zanamivir (Relenza) are given in section 37 of the data booklet.
Compare and contrast the structures of oseltamivir and zanamivir, stating the names of functional groups.

Deduce the wavenumber of one absorbance seen in the IR spectrum of only one of the compounds, using section 26 of the data booklet.
Suggest one ethical consideration faced by medical researchers when developing medications.
Markscheme
One similarity:
both contain amido «group»
One difference:
oseltamivir contains ester «group» AND zanamivir does not
OR
oseltamivir contains amino «group» AND zanamivir does not «but contains a guanidino group»
OR
zanamivir contains carboxyl «group» AND oseltamivir does not
OR
zanamivir contains «several» hydroxyl «groups» AND oseltamivir does not
OR
oseltamivir contains ester «group» AND zanamivir contains carboxyl «group»
OR
oseltamivir contains ester «group» AND zanamivir contains «several» hydroxyl «groups»
Accept “both contain ether «group»” OR “both contain alkene/alkenyl «group»” OR “both contain carbonyl «group»” OR “both contain amino/amine «group»”. Latter cannot be given in combination with second difference alternative with respect to amino group.
Accept “amide/carboxamide/carbamoyl” for “amido”.
Accept “amine” for “amino”.
Accept “carboxylic acid” for “carboxyl”.
Accept “hydroxy/alcohol” for “hydroxyl”, but not “hydroxide”.
[2 marks]
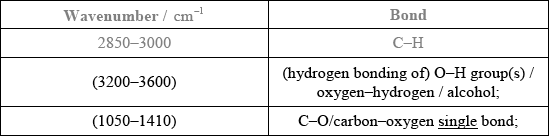
1050–1410
OR
1620–1680
OR
1700–1750
OR
2500–3000
OR
3200–3600
OR
2850–3090
OR
3300–3500 «cm–1»
[1 mark]
«negative» side-effects of medication on patient/volunteers
OR
effects on environment «from all materials used and produced»
OR
potential for abuse
OR
drugs may be developed that are contrary to some religious doctrines
OR
animal testing
OR
risk to benefit ratio
OR
appropriate consent of patient volunteers
[1 mark]
Examiners report
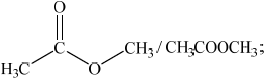
Mass spectrometry is a powerful analytical technique used in the identification of organic compounds. The mass spectrum of a compound with empirical formula \({\text{C}}{{\text{H}}_{\text{2}}}{\text{O}}\) displays peaks at m/z 15, 45 and 60.
Determine the molecular formula of the compound.
Identify the fragments responsible for the peaks at
m/z = 15
m/z = 45
Identify a compound that could produce this spectrum.
Markscheme
\({{\text{C}}_{\text{2}}}{{\text{H}}_{\text{4}}}{{\text{O}}_{\text{2}}}\);
No mark for (CH2O)2.
m/z = 15
\({\text{CH}}_3^ + \);
m/z = 45
\({\text{COO}}{{\text{H}}^ + }{\text{/C}}{{\text{O}}_{\text{2}}}{{\text{H}}^ + }{\text{/HCO}}{{\text{O}}^ + }{\text{/OCO}}{{\text{H}}^ + }\);
Penalize once if charges are missing.
ethanoic acid/ \({\text{C}}{{\text{H}}_{\text{3}}}{\text{COOH}}\) / methyl methanoate/ \({\text{HCOOC}}{{\text{H}}_{\text{3}}}\);
Accept acetic acid.
Examiners report
Most candidates gave the correct molecular formula (a) and many candidates identified the fragments correctly.
Many candidates did not give the charge of the ion.
Many candidates identified acetic acid.
Medicines have a variety of different effects on the body and act at the molecular level.
Morphine and codeine are strong analgesics. Their structures are given in section 37 of the data booklet.
Dose response curves are determined for each drug.
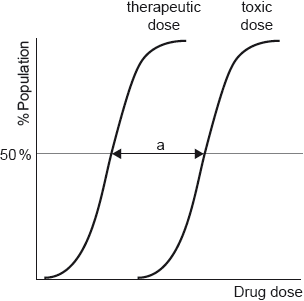
Outline the significance of range “a”.
Suggest the type of reaction used to convert morphine to codeine.
State and explain the action of opiates as painkillers.
Markscheme
«measures» therapeutic window/margin «of a drug»
OR
range of doses that produce a therapeutic effect without causing toxic effects
Accept “difference between ED50/minimum effective/therapeutic dose «for 50% of population» AND TD50 /toxic dose «for 50% of population»”.
Do not accept “therapeutic index”.
Do not accept “lethal/fatal dose” as this is not LD50.
[1 mark]
«nucleophilic» substitution/SN
Accept “methylation”.
[1 mark]
work directly on opioid/pain receptors «in brain»
suppress pain impulses in brain/CNS
resemble endorphins/enkephalins/natural chemical painkillers «produced in the brain and spinal cord»
Do not award mark for “resemble hormones”.
[2 marks]
Examiners report
Infrared spectroscopy is an analytical technique that uses electromagnetic radiation.
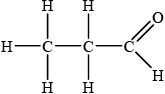
The infrared spectrum of a substance, X, with empirical formula \({{\text{C}}_{\text{3}}}{{\text{H}}_{\text{6}}}{\text{O}}\) is given below.
Explain why the structural formula of X cannot be:
The \(^{\text{1}}{\text{H}}\,{\text{NMR}}\) spectrum of X consists of three peaks. Deduce the structural formula of X and the relative areas under each peak.
Markscheme
absence of peak between 3200–3600 \({\text{c}}{{\text{m}}^{ - 1}}\)/above 3000 \({\text{c}}{{\text{m}}^{ - 1}}\)/peak for OH;
presence of peak between 1700–1750 \({\text{c}}{{\text{m}}^{ - 1}}\)/peak for C=O;
absence of peak between 1610–1680 \({\text{c}}{{\text{m}}^{ - 1}}\) /peak for C=C;
 ;
;
Accept CH3CH2CHO.
3:2:1;
Ignore order
ECF if structure is incorrect only if its NMR spectrum contains three peaks.
Examiners report
Many candidates only gave at least one reason why X cannot be the given formula.
Many gave the correct formula for X, but some could not identify the relative areas under the peaks.
Magnetic resonance imaging (MRI) is a medical application of NMR spectroscopy.
State one advantage of MRI over X-ray medical imaging with reference to the electromagnetic spectrum.
Outline how MRI is used to scan the human body.
Markscheme
uses no ionizing radiation / uses low-energy radio waves / radio waves safer than x-rays / OWTTE;
Accept “does not damage body tissue”.
MRI is (usually) a proton NMR/\(^{\text{1}}{\text{H}}\,{\text{NMR}}\);
(the states of) protons/hydrogen atoms in water/lipids/carbohydrates/proteins/different (chemical) environments are detected;
different organs have different water concentration;
(strong) magnetic field and radio waves/frequency are used;
(by focusing the scanner on different parts of the body) three-dimensional/3-D
images of (organs in) the body are produced / OWTTE;
Examiners report
Most realized that radio waves are lower in energy than X-rays and so less harmful and in (b) quite a number of possible answers were accepted.
Most realized that radio waves are lower in energy than X-rays and so less harmful and in (b) quite a number of possible answers were accepted.
Deduce the number of peaks in the \(^{\text{1}}{\text{H}}\,{\text{NMR}}\) spectra of 1-bromobutane and 2-bromobutane. Explain how the integration trace can be used to distinguish between the two compounds.
Compare the \(^{\text{1}}{\text{H}}\,{\text{NMR}}\) spectrum of 1-bromo-2-methylpropane with the two spectra considered in (a). Include the number of peaks and the integration trace.
Markscheme
both 1-bromobutane and 2-bromobutane have four peaks;
(ratio of areas in) 1-bromobutane: 3:2:2:2;
(ratio of areas in) 2-bromobutane: 3:1:2:3;
For second and third points accept correct ratios given in a different order.
Accept correct number of hydrogen atoms for each peak instead of area.
three peaks (not four);
ratio of areas/integration trace: 6:1:2;
Accept correct ratio given in a different order.
Examiners report
This is a topic that showed better understanding, but many candidates lost marks as their answers did not focus on integration traces. Thus, it looks like quite a few candidates are actually proficient in this technique, but failed to interpret the question properly. Very few candidates could explain the role of \(^{\text{1}}{\text{H}}\,{\text{NMR}}\) in magnetic resonance imaging. Explanations were very shallow evidencing no clear understanding of this technique.
This is a topic that showed better understanding, but many candidates lost marks as their answers did not focus on integration traces. Thus, it looks like quite a few candidates are actually proficient in this technique, but failed to interpret the question properly. Very few candidates could explain the role of \(^{\text{1}}{\text{H}}\,{\text{NMR}}\) in magnetic resonance imaging. Explanations were very shallow evidencing no clear understanding of this technique.
Details of the \(^{\text{1}}{\text{H}}\,{\text{NMR}}\) spectra of two of these alcohols are given below.
\[\begin{array}{*{20}{l}} {Spectrum 1}&{} \\ {{\text{Two peaks:}}}&{{\text{One at 1.3 ppm (relative to the TMS reference) with an integration trace}}} \\ {}&{{\text{of nine units, and the other at 2.0 ppm with an integration trace of one unit.}}} \\ {Spectrum 2}&{} \\ {{\text{Four peaks:}}}&{{\text{The first at 0.9 ppm with an integration trace of six units.}}} \\ {}&{{\text{The second at 1.7 ppm with an integration trace of one unit.}}} \\ {}&{{\text{The third at 2.1 ppm with an integration trace of one unit.}}} \\ {}&{{\text{The fourth at 3.4 ppm with an integration trace of two units.}}} \end{array}\]
Consider the proton environments present in each of the alcohol molecules when answering the following questions.
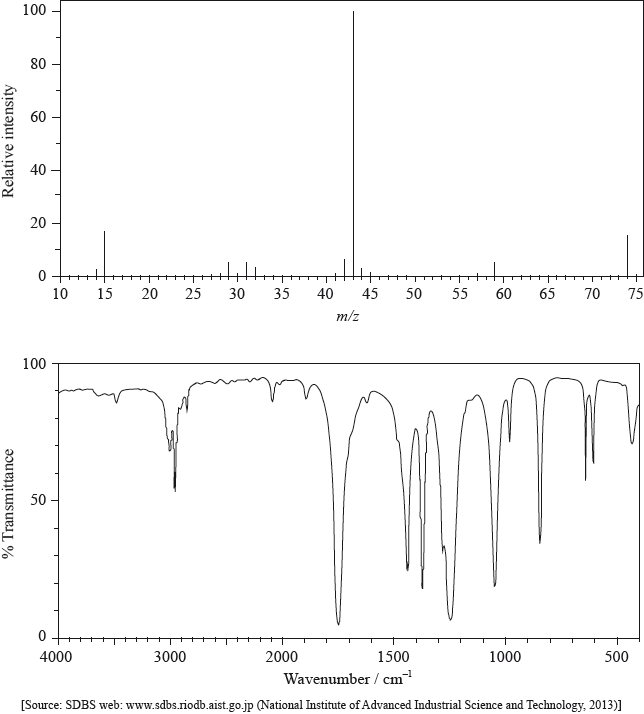
The mass spectrum of one of the alcohols shows peaks at m/z values of 74, 59 and 45.
(i) Identify which alcohol gives spectrum 1 and explain your answer by stating which hydrogen atoms in the molecule are responsible for each of the two peaks.
(ii) Deduce which alcohol gives spectrum 2. Explain which particular hydrogen atoms in the molecule are responsible for the peaks at 0.9 ppm and 3.4 ppm.
(i) Deduce which two of the alcohols could produce this spectrum and identify the species responsible for the three peaks.
(ii) The spectrum also shows a significant peak at m/z = 31. Suggest which alcohol is responsible for this spectrum and deduce the species responsible for the peak at m/z = 31.
Explain why the infrared spectra of all four alcohols are very similar.
Markscheme
(i) (2-)methylpropan-2-ol;
the (H atoms in the three) –CH3 groups are responsible for the peak at 1.3 ppm (as there are 9 H atoms in the same environment with no H on the adjacent C atom);
the –OH hydrogen atom is responsible for the peak at 2.0 ppm;
Accept explanations with suitable diagram.
(ii) (2-)methylpropan-1-ol;
the first peak (at 0.9 ppm) is due to the (H atoms in the) two –CH3 groups
(bonded to the second carbon atom) / (CH3)2CHCH2OH;
the peak at 3.4 ppm is due to the (H atoms in the) –CH2– group /
(CH3)2CHCH2OH;
Accept explanations with suitable diagram.
(i) butan-1-ol and butan-2-ol (as they both contain a \(–{{\text{C}}_{\text{2}}}{{\text{H}}_{\text{5}}}\) group);
74: \({{\text{M}}^ + }{\text{ / }}{{\text{C}}_{\text{4}}}{{\text{H}}_{{\text{10}}}}{{\text{O}}^ + }{\text{ / C}}{{\text{H}}_{\text{3}}}{\text{C}}{{\text{H}}_{\text{2}}}{\text{C}}{{\text{H}}_{\text{2}}}{\text{C}}{{\text{H}}_{\text{2}}}{\text{O}}{{\text{H}}^ + }\) and \({\text{C}}{{\text{H}}_{\text{3}}}{\text{C}}{{\text{H}}_{\text{2}}}{\text{CH(OH)CH}}_3^ + \);
59: \({{\text{C}}_{\text{3}}}{{\text{H}}_{\text{7}}}{{\text{O}}^ + }{\text{ / (M}}–{\text{C}}{{\text{H}}_{\text{3}}}{{\text{)}}^ + }{\text{ / C}}{{\text{H}}_{\text{2}}}{\text{C}}{{\text{H}}_{\text{2}}}{\text{C}}{{\text{H}}_{\text{2}}}{\text{O}}{{\text{H}}^ + }\) and
\({\text{C}}{{\text{H}}_{\text{2}}}{\text{CH(OH)CH}}_3^ + {\text{ / C}}{{\text{H}}_{\text{3}}}{\text{C}}{{\text{H}}_{\text{2}}}{\text{CH(OH}}{{\text{)}}^ + }\);
45: \({{\text{C}}_{\text{2}}}{{\text{H}}_{\text{5}}}{{\text{O}}^ + }{\text{ / (M}}–{{\text{C}}_{\text{2}}}{{\text{H}}_{\text{5}}}{{\text{)}}^ + }{\text{ / C}}{{\text{H}}_{\text{2}}}{\text{C}}{{\text{H}}_{\text{2}}}{\text{O}}{{\text{H}}^ + }\) and \({\text{CH(OH)CH}}_3^ + \);
Accept explained answers instead of formulas.
(ii) butan-1-ol;
\({\text{C}}{{\text{H}}_{\text{2}}}{\text{O}}{{\text{H}}^ + }\) / \({{\text{(M}}–{{\text{C}}_{\text{3}}}{{\text{H}}_{\text{7}}}{\text{)}}^ + }\);
Penalize missing + signs once only in parts (b) (i) and (ii).
they all contain O–H (which will give a broad peak at ca. \({\text{3500 c}}{{\text{m}}^{ - 1}}\));
they all contain C–H (which will absorb at ca. \({\text{3000 c}}{{\text{m}}^{ - 1}}\));
Award [1 max] for same functional groups/bonds.
Examiners report
Most candidates correctly identified the alcohols, but only the better candidates could explain which hydrogen atoms in the molecule were responsible for the peaks. One comment on the G2 forms was surprised by the reference to TMS. However, all \(^{\text{1}}{\text{H}}\,{\text{NMR}}\) spectra have chemical shifts relative to TMS, and no questions were asked about its function.
Many forgot the + charge of the fragments passing through a mass spectrometer and so lost marks.
The similar infrared spectra of the alcohols was often explained in general terms with no reference to the particular bonds present.
Three isomers of \({{\text{C}}_{\text{3}}}{{\text{H}}_{\text{6}}}{{\text{O}}_{\text{2}}}\) are ethyl methanoate, methyl ethanoate and propanoic acid.
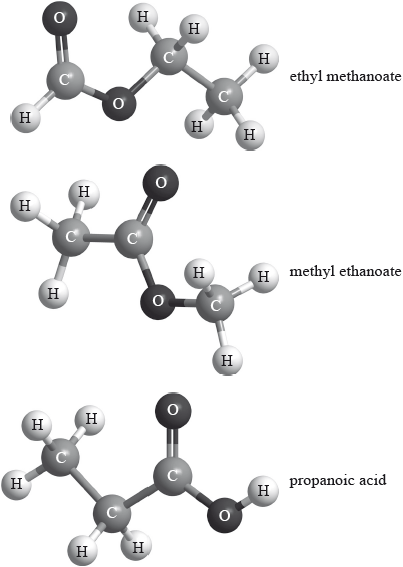
Explain which of the three compounds has a mass spectrum which contains peaks at \(m{\text{/}}z = 59\) and 44.
Markscheme
methyl ethanoate;
peak at 44 corresponds to loss of two methyl/CH3 groups (and peak at 59 the loss of the first) / the only isomer with two methyl groups / OWTTE;
Examiners report
Many students could use the spectroscopic data provided to correctly identify the compounds, with the first part of the question, dealing with mass spectrometer data, probably proving the most challenging.
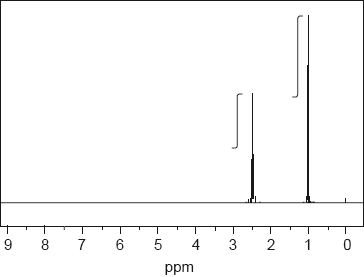
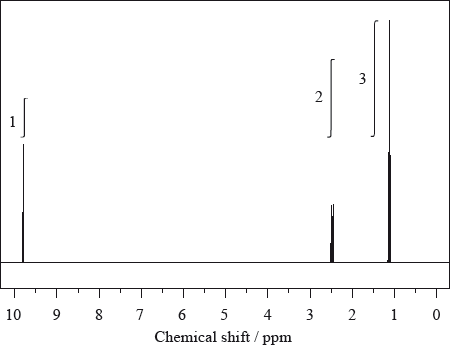
NMR spectroscopy is one of the most powerful analytical tools for determining molecular structure.
The 1H NMR spectrum, including the integration trace, of a ketone with relative molecular mass 86 is shown below.
[Source: SDBS web: www.sdbs.riodb.aist.go.jp (National Institute of
Advanced Industrial Science and Technology, 2014)]
Deduce the structural formula of the compound, justifying your choice.
Markscheme
CH3CH2COCH2CH3;
Accept full or condensed structural formula.
Any two for [2 max] from:
two H (atom)/proton environments;
3:2/2:3 ratio of atoms in these environments;
one environment an alkyl group / one environment next to a carbonyl;
Accept –CH3 (0.9–1.0 ppm) / –CO–CH2– (2.2–2.7 ppm)
Examiners report
Many candidates did elicit the correct structure although the most common error was the incorrect positioning of the carbonyl group. The number of H environments was often established but the ratios of atoms was not seen very often. Many did score a mark for stating a correct shift associated with the methyl group.
Consider the compound chloroethene, CH2=CHCl.
Deduce two features you would expect to observe in its mass spectrum.
Predict two features you would expect to observe in its infrared (IR) spectrum.
Markscheme
peaks at (m/z =) 62 and 64 / two molecular ion peaks;
height ratio of molecular ion peaks is 3 :1;
peak at (m/z =) 27 (due to loss of Cl);
Accept peaks at 63/65 (13C)/peak(s) resulting from 13C / peaks at 61/63 (loss of H)/peak(s) resulting from loss of H / peaks at 48/50 (loss of CH2)/peak(s) resulting from loss of CH2/ 35/37 Cl+ as an alternative to final marking point.
absorption at 600 – 800 (\({\text{c}}{{\text{m}}^{ - 1}}\) C–Cl);
absorption at 1610 – 1680 (\({\text{c}}{{\text{m}}^{ - 1}}\) >C=C<);
absorption at 2850 – 3100 (\({\text{c}}{{\text{m}}^{ - 1}}\) C–H);
Examiners report
The first and second marking points were rarely scored as most students did not recall that chlorine exists as a mixture of isotopes. The most common molecular ion peak stated was 62.5 instead of both 62 and 64. A common incorrect response in this question was to suggest fragmentation at the double bond with the production of the CH2 fragment. The identification of possible IR absorption bands and the effect of IR radiation being absorbed by molecules was well done by most candidates. It was clear that most candidates understood that bond stretching/bending occurred when IR radiation is absorbed but there were fewer correct references to the change in bond polarity which was required for the second mark.
The first and second marking points were rarely scored as most students did not recall that chlorine exists as a mixture of isotopes. The most common molecular ion peak stated was 62.5 instead of both 62 and 64. A common incorrect response in this question was to suggest fragmentation at the double bond with the production of the CH2 fragment. The identification of possible IR absorption bands and the effect of IR radiation being absorbed by molecules was well done by most candidates. It was clear that most candidates understood that bond stretching/bending occurred when IR radiation is absorbed but there were fewer correct references to the change in bond polarity which was required for the second mark.
The structure of an unknown compound A with empirical formula CH2 can be determined using information from a variety of analytical techniques.
The mass spectrum of A is shown below.
The infrared (IR) spectrum of A is shown below.
Determine the relative molecular mass of the compound from the mass spectrum and deduce the formula of the molecular ion.
Deduce the formulas of the fragments which give rise to peaks at \(m/z = 27\) and 29.
\(m/z = 27\):
\(m/z = 29\):
Identify the bond responsible for the IR absorption at B.
Deduce a structural formula consistent with the data.
Markscheme
56;
\({{\text{C}}_{\text{4}}}{\text{H}}_{\text{8}}^ + \);
Penalize missing charge only once in (i) and (ii).
\(m/z = 27:{{\text{C}}_{\text{2}}}{\text{H}}_3^ + /{\text{C}}{{\text{H}}_{\text{2}}}{\text{C}}{{\text{H}}^ + }/{\text{C}}{{\text{H}}_{\text{2}}}\)=\({\text{C}}{{\text{H}}^ + }\) and \(m/z = 29:{{\text{C}}_{\text{2}}}{\text{H}}_{\text{5}}^ + /{\text{C}}{{\text{H}}_{\text{3}}}{\text{CH}}_{\text{2}}^ + {\text{;}}\)
Penalize missing charge only once in (i) and (ii).
C=C/carbon−carbon double bond;
Accept “alkenyl/alkene”.
CH3CH2CH=CH2;
Accept either a full or a condensed structural formula.
Examiners report
More than half of the candidates obtained the molecular mass from the spectrum. About a third of the candidates identified \({{\text{C}}_{\text{4}}}{{\text{H}}_{\text{8}}}\) as the molecular formula but only a few candidates remembered to include the positive charge on the molecular ion and scored the second mark.
About a third of the candidates identified the correct fragments. It was disappointing to see candidates suggesting fragments that did not match the masses of the peaks.
Very well answered.
Only a few candidates deduced the correct structural formula consistent with the data.
The low resolution \(^1{\text{H}}\,{\text{NMR}}\) spectrum of compound Q is shown.
Identify what information from the spectrum allows the determination of the relative numbers of hydrogen atoms producing each peak.
Deduce which of the following compounds is Q.
\[{\text{C}}{{\text{H}}_{\text{3}}}{\text{C}}{{\text{H}}_{\text{2}}}{\text{C}}{{\text{H}}_{\text{3}}}\quad \quad \quad \quad \quad {\text{C}}{{\text{H}}_{\text{3}}}{\text{C}}{{\text{H}}_{\text{2}}}{\text{COC}}{{\text{H}}_{\text{2}}}{\text{C}}{{\text{H}}_{\text{3}}}\quad \quad \quad \quad \quad {\text{C}}{{\text{H}}_{\text{3}}}{\text{C}}{{\text{H}}_{\text{2}}}{\text{OH}}\]
Identify the wavenumbers of two peaks in the infrared spectrum of compound Q, using Table 17 of the Data Booklet.
Markscheme
(ratio of) area under each peak / integration trace;
Accept size of peak but not height of peak.
\({\text{C}}{{\text{H}}_{\text{3}}}{\text{C}}{{\text{H}}_{\text{2}}}{\text{COC}}{{\text{H}}_{\text{2}}}{\text{C}}{{\text{H}}_{\text{3}}}\);
1700–1750 \({\text{(c}}{{\text{m}}^{ - 1}}{\text{)}}\) and 2850–3100 \({\text{(c}}{{\text{m}}^{ - 1}}{\text{)}}\);
Accept a single value or a smaller range within each range.
Examiners report
This was a well-answered question generally. In part (a) most candidates recognized the area under the peak as the indicator of the number of hydrogen atoms in NMR spectroscopy, although few candidates thought it was the chemical shift, and few candidates incorrectly stated that it was the height of the peak (rather than the area underneath it).
This was a well-answered question generally. The majority of candidates chose the correct molecule (pentan-2-one) in part (b) and gave the correct ranges of IR absorptions in part (c).
This was a well-answered question generally. The majority of candidates chose the correct molecule (pentan-2-one) in part (b) and gave the correct ranges of IR absorptions in part (c).
A student wished to determine the concentration of a solution of sodium hydroxide by titrating it against a 0.100moldm−3 aqueous solution of hydrochloric acid.
4.00g of sodium hydroxide pellets were used to make 1.00dm3 aqueous solution.
20.0cm3 samples of the sodium hydroxide solution were titrated using bromothymol blue as the indicator.
Outline, giving your reasons, how you would carefully prepare the 1.00dm3 aqueous solution from the 4.00g sodium hydroxide pellets.
(i) State the colour change of the indicator that the student would see during his titration using section 22 of the data booklet.
(ii) The student added the acid too quickly. Outline, giving your reason, how this could have affected the calculated concentration.
Suggest why, despite preparing the solution and performing the titrations very carefully, widely different results were obtained.
Markscheme
Key Procedural Steps:
use volumetric flask
mix the solution
fill up to line/mark/«bottom of» meniscus/1 dm3 «with deionized/distilled water»
Key Technique Aspects:
use balance that reads to two decimal places/use analytical balance/use balance of high precision
mix pellets in beaker with deionized/distilled water «and stir with glass rod to dissolve»
use a funnel «and glass-rod» to avoid loss of solution
need to rinse «the beaker, funnel and glass rod» and transfer washings to the «volumetric» flask
Safety Precautions:
NaOH corrosive/reacts with water exothermically
keep NaOH in dessicator
let the solution cool
Two marks may be awarded from two different categories or from within one category.
Do not accept “use of a funnel to transfer the solid”.
Do not accept “keep volumetric flask in cold water/ice”.
(i) blue to green/yellow
(ii) equivalence point has been exceeded
OR
greater volume of/too much acid has been added
«calculated» concentration increased
Accept “end-point” for “equivalence point”.
colour difficult to detect
OR
using different HCl standards
OR
no significant figures used in subsequent calculation
OR
incorrect method of calculation
Accept any valid hypothesis.
Do not accept any mistakes associated with techniques (based on stem of question) eg. parallax error, not rinsing glassware, etc.
Do not accept “HCl was not standardized”.
Accept “reaction of NaOH with CO2 «from air»”.
Accept “NaOH hygroscopic/absorbs moisture/H2O «from the air/atmosphere»”.
Accept “impurities in NaOH”.
Accept "temperature changes during experiment".
Ignore a general reference to random errors.
Examiners report
A healthy diet consists of a range of food groups in the right proportions that provide the energy for the body to function, grow and repair itself.
Examples of straight-chain fatty acids include \({{\text{C}}_{{\text{19}}}}{{\text{H}}_{{\text{39}}}}{\text{COOH}}\), \({{\text{C}}_{{\text{19}}}}{{\text{H}}_{{\text{31}}}}{\text{COOH}}\) and \({{\text{C}}_{{\text{19}}}}{{\text{H}}_{{\text{29}}}}{\text{COOH}}\).
State the empirical formula and structural features of monosaccharides.
Deduce the structural formula of a triester formed from three long-chain carboxylic acid molecules, RCOOH, and one propane-1,2,3-triol molecule, \({\text{HO–C}}{{\text{H}}_{\text{2}}}{\text{CH(OH)–C}}{{\text{H}}_{\text{2}}}{\text{OH}}\). Identify one of the ester linkages in the structure by drawing a rectangle around it.
Deduce the number of C=C bonds present in one molecule of each fatty acid.
\({{\text{C}}_{{\text{19}}}}{{\text{H}}_{{\text{39}}}}{\text{COOH}}\):
\({{\text{C}}_{{\text{19}}}}{{\text{H}}_{{\text{31}}}}{\text{COOH}}\):
\({{\text{C}}_{{\text{19}}}}{{\text{H}}_{{\text{29}}}}{\text{COOH}}\):
Markscheme
\({\text{C}}{{\text{H}}_2}{\text{O}}\);
Accept (CH2O)n
one carbonyl/C=O and (at least two) hydroxyl/OH groups;
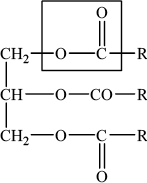
Award [1] for structure that shows unambiguously how the atoms are arranged together.
Award [1] for identifying one of the three ester linkages – must not include R and/or CH2.
\({{\text{C}}_{19}}{{\text{H}}_{39}}{\text{COOH}}\): 0
\({{\text{C}}_{19}}{{\text{H}}_{31}}{\text{COOH}}\): 4
\({{\text{C}}_{19}}{{\text{H}}_{29}}{\text{COOH}}\): 5
All three [2], any two [1], any one [0].
Examiners report
The vast majority of candidates were able to state the empirical formula of monosaccharides, but a good number were not able to state its structural features.
It was surprising to see that only about half could deduce the structure of the triester correctly and identify the ester linkage.
About half of the candidates were able to deduce the number of C=C bonds correctly from the list of fatty acids.
Explain what occurs at a molecular level during the absorption of infrared (IR) radiation by the sulfur dioxide molecule, \({\text{S}}{{\text{O}}_{\text{2}}}\).
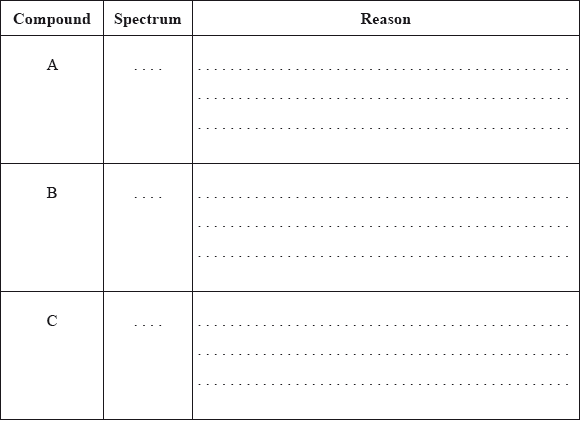
Consider the IR spectra of the following three compounds.
\[\begin{array}{*{20}{l}} {{\text{A}} = {\text{C}}{{\text{H}}_{\text{3}}}{{{\text{(C}}{{\text{H}}_{\text{2}}}{\text{)}}}_{\text{3}}}{\text{COOH}}} \\ {{\text{B}} = {\text{C}}{{\text{H}}_{\text{3}}}{\text{COOC(C}}{{\text{H}}_{\text{3}}}{{\text{)}}_{\text{3}}}} \\ {{\text{C}} = {{{\text{(C}}{{\text{H}}_{\text{3}}}{\text{C}}{{\text{H}}_{\text{2}}}{\text{)}}}_{\text{3}}}{\text{COH}}} \end{array}\]
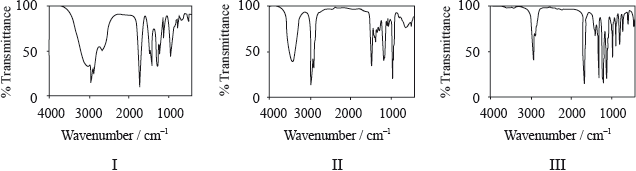
Determine which IR spectrum corresponds to each compound A, B and C. Explain your reasoning. IR data can be found in Table 17 of the Data Booklet.
Markscheme
(O–S–O) bond angle changes;
(S–O) bond (length) stretches;
Allow [1] for S–O bond vibrations if neither of the above points are scored.
A is Spectrum I and B is Spectrum III and C is Spectrum II;
A Spectrum I:
only spectrum with a (broad) peak in the range \({\text{2500–3300 (c}}{{\text{m}}^{ - 1}}{\text{)}}\) corresponding to the carboxylic acid functional group / –OH in carboxylic acid / H-bonding in carboxylic acid (so must be a carboxylic acid);
B Spectrum III:
peak in the range \({\text{1700–1750 (c}}{{\text{m}}^{ - 1}}{\text{)}}\) corresponding to the carbonyl/C=O group;
but no peak for O–H/no peak at \({\text{2500–3300 (c}}{{\text{m}}^{ - 1}}{\text{)}}\) or \({\text{3200–3600 (c}}{{\text{m}}^{ - 1}}{\text{)}}\);
C Spectrum II:
peak in the range \({\text{3200–3600 (c}}{{\text{m}}^{ - 1}}{\text{)}}\) corresponding to the alcohol functional group/OH / the only one without a peak at \({\text{1700–1750 (c}}{{\text{m}}^{ - 1}}{\text{)}}\) corresponding to a carbonyl/C=O group;
Examiners report
For part (b) candidates often missed discussing the change of dipole moment.
Part (d) illustrated candidates’ ability at linking wave numbers from IR spectra to correct bonds but they did not always provide adequate explanations for their choices.
Compound X has the molecular formula \({{\text{C}}_{\text{3}}}{{\text{H}}_{\text{6}}}{{\text{O}}_{\text{3}}}\) and is found in human perspiration.
Y is an isomer of X, which contains the same functional groups.
Its infrared (IR) spectrum is represented below.
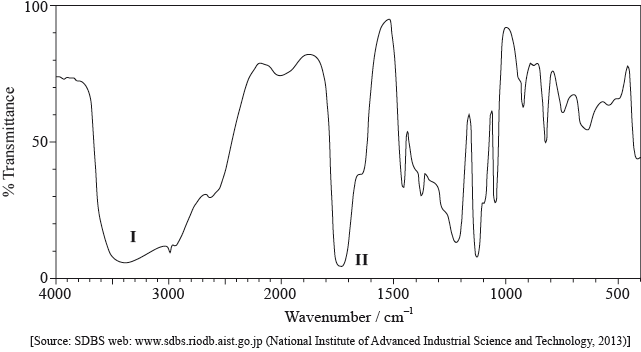
Deduce the bonds responsible for the absorptions labelled I and II.
I:
II:
The \(^{\text{1}}{\text{H}}\,{\text{NMR}}\) spectrum recorded showed four peaks with the following chemical shift values (in ppm):
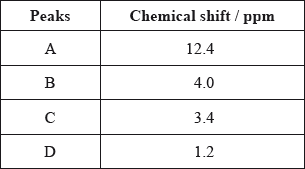
The integration trace for A:B:C:D was found to be 1:1:1:3.
Deduce what information can be obtained about the hydrogen atoms responsible for peak D at 1.2 ppm from the integration trace in the \(^{\text{1}}{\text{H}}\,{\text{NMR}}\) spectrum of X.
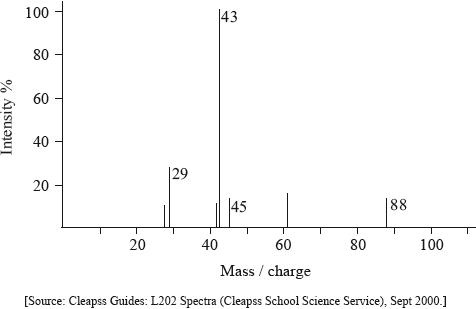
Deduce the fragments in the mass spectrum which correspond to the following m/z values.
m/z = 45:
m/z = 17:
m/z = 15:
Deduce the structural formula of X.
(i) Deduce the structural formula of Y.
(ii) Predict one difference between the \(^{\text{1}}{\text{H}}\,{\text{NMR}}\) spectrum of Y and X.
(i) Like X, 3-methylbutanoic acid is also a source of body odour. Deduce the m/z value for the molecular ion peak on the mass spectrum of this compound.
(ii) Deduce the number of different chemical environments of the hydrogen atoms in the \(^{\text{1}}{\text{H}}\,{\text{NMR}}\) spectrum of 3-methylbutanoic acid.
Markscheme
I: O–H and II: C=O;
Do not allow CO for C=O.
Allow OH for O–H.
three hydrogens in same (chemical) environment / \({\text{C}}{{\text{H}}_{\text{3}}}\)/methyl (group);
Award [2] for all three correct, [1] for any two correct.
m/z = 45:
\({\text{COO}}{{\text{H}}^ + }/{\text{C}}{{\text{O}}_2}{{\text{H}}^ + }/{{\text{C}}_2}{{\text{H}}_5}{{\text{O}}^ + }\);
m/z = 17:
\({\text{O}}{{\text{H}}^ - }\);
m/z = 15:
\({\text{CH}}_3^ + \);
Penalize missing + once only.
\({\text{C}}{{\text{H}}_{\text{3}}}{\text{CH(OH)COOH}}/{\text{C}}{{\text{H}}_{\text{3}}}{\text{CH(OH)C}}{{\text{O}}_{\text{2}}}{\text{H}}\);
Allow full or condensed structural formula.
(i) \({\text{C}}{{\text{H}}_{\text{2}}}{\text{(OH)C}}{{\text{H}}_{\text{2}}}{\text{COOH}}/{\text{HO(C}}{{\text{H}}_{\text{2}}}{{\text{)}}_{\text{2}}}{\text{C}}{{\text{O}}_{\text{2}}}{\text{H}}\);
Allow full or condensed structural formula.
(ii) different integration trace / integration trace 1:2:2:1 (in Y) / different chemical shift values / OWTTE;
(i) 102;
(ii) 4;
Examiners report
Most candidates scored this mark by identifying the bonds responsible for the absorptions.
About half the candidates were able to analyze the integration trace correctly and deduced that this was a methyl group.
Generally well answered. However, a few candidates are still forgetting to include the positive charge of the fragments of the mass spectrum.
About a third of the candidates were able to deduce the correct structural formula of X based on the evidence presented.
(i) Only few candidates deduced the correct structure for the isomer Y.
(ii) About half the candidates predicted a reasonable difference between the \(^{\text{1}}{\text{H}}\,{\text{NMR}}\) spectra of X and Y.
(i) More than half the candidates were able to deduce the molecular formula from the name and hence calculated the m/z value of the molecular ion peak correctly.
(ii) More than half of the candidates deduced the correct number of chemical environments in the \(^{\text{1}}{\text{H}}\,{\text{NMR}}\) spectrum of 3-methylbutanoic acid.
The mass spectrum of an unknown compound, X, of empirical formula C2H4O is shown below.
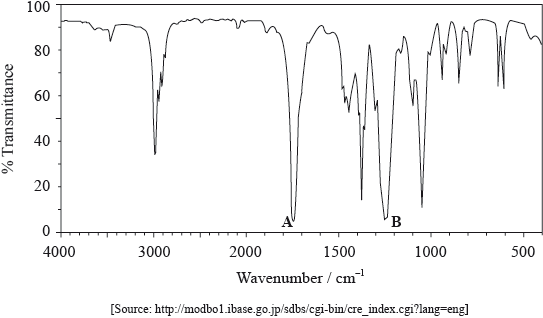
The IR spectrum of X is shown below.
Determine the relative molecular mass of X from the mass spectrum and deduce the formula of the molecular ion.
Identify a fragment which gives rise to the peak at m/z = 29.
Comment on the absence of a peak at m/z = 59.
Use Table 17 of the Data Booklet to identify the bonds which correspond to the absorptions A and B.
A:
B:
Deduce the name of the functional group present in X.
The \(^{\text{1}}{\text{H}}\,{\text{NMR}}\) spectrum of X shows three peaks. State the information that can be obtained from the number of peaks.
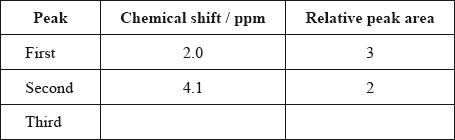
The \(^{\text{1}}{\text{H}}\,{\text{NMR}}\) spectrum of X includes peaks at 2.0 and 4.1 ppm. Use Table 18 of the Data Booklet to suggest the chemical shift of the third peak and state its relative peak area. Show your answers in the table below.
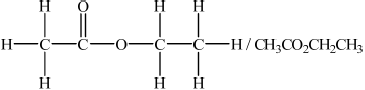
Deduce a possible structure for X that is consistent with the mass, IR and \(^{\text{1}}{\text{H}}\,{\text{NMR}}\) spectra.
Markscheme
88;
Do not award mark if units are given.
\({{\text{C}}_4}{{\text{H}}_8}{\text{O}}_2^ + \);
\({\text{C}}{{\text{H}}_3}{\text{CH}}_2^ + /{{\text{C}}_2}{\text{H}}_5^ + /{\text{CH}}{{\text{O}}^ + }\);
Only penalize once for missing charge in (a) (i) and (ii).
C2H3O2 produced has no charge / fragment produced after loss of C2H5 from molecular ion has no charge;
Accept fragment(s) too unstable, fragment breaks up etc.
Do not accept answers with reference to 13C/14C isotopes and peak at m/z = 61.
Do not accept C2H3O2+ / C3H7O+ does not exist.
A: C=O and B: C–O;
No mark if two bonds are given for A or B.
Ignore names if incorrect.
ester;
Do not accept COO.
the number of different hydrogen/proton environments / OWTTE;
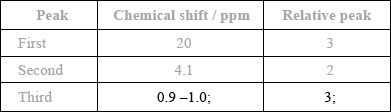
 ;
;
Examiners report
In (a), although most identified the formulas of the molecular ion in (i) and the fragment in (ii), the positive charge was often missing.
In (a), although most identified the formulas of the molecular ion in (i) and the fragment in (ii), the positive charge was often missing.
Very few candidates were able to explain the absence of a peak at m/z = 29 in (iii) in the mass spectrum. This is because the fragment produced after loss of C2H5+ has no charge.
A significant number referred to the C–F bond in (b), even though the empirical formula of X given in the question contained no fluorine.
A significant number referred to the C–F bond in (b), even though the empirical formula of X given in the question contained no fluorine.
Part (c) was generally well answered, although with some errors in the table in (ii) and the structure of a carboxylic acid in (iii).
Part (c) was generally well answered, although with some errors in the table in (ii) and the structure of a carboxylic acid in (iii).
Part (c) was generally well answered, although with some errors in the table in (ii) and the structure of a carboxylic acid in (iii).
The mass spectrum and infrared (IR) spectrum of a compound are shown below.
(i) State the information about this particular compound that can be derived from the mass spectrum and outline how it is found.
(ii) Suggest how the fragment with m/z = 43 is formed from the original molecule.
(i) Use the IR spectrum in the region 1600 – 1800 \({\text{c}}{{\text{m}}^{ - 1}}\) to deduce one functional group that is present in the compound and one group that is absent.
Present:
Absent:
(ii) The molecular formula of the compound is \({{\text{C}}_{\text{3}}}{{\text{H}}_{\text{6}}}{{\text{O}}_{\text{2}}}\). Explain, with reference to another region of the IR spectrum, why the compound could not be propanoic acid, \({\text{C}}{{\text{H}}_{\text{3}}}{\text{C}}{{\text{H}}_{\text{2}}}{\text{COOH}}\).
(iii) Deduce the structures of two possible isomers of propanoic acid consistent with the IR spectrum.
\(^{\text{1}}{\text{H}}\,{\text{NMR}}\) spectroscopy is often very useful in distinguishing between closely related compounds such as those above.
(i) State the region of the electromagnetic spectrum that is used in this technique.
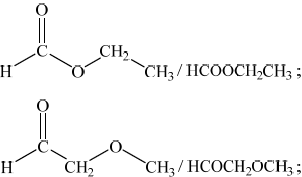
(ii) The structures of two other closely related compounds are shown below.
Discuss how you would expect the \(^{\text{1}}{\text{H}}\,{\text{NMR}}\) spectra of these two compounds to differ, using Table 18 of the Data Booklet.
Markscheme
(i) molar/molecular mass/\(M = 74{\text{ (g}}\,{\text{mo}}{{\text{l}}^{ - 1}}{\text{)}}\) / relative molecular mass/\({M_r} = 74\);
peak with highest m/z (ignoring any peak attributable to \(^{{\text{13}}}{\text{C}}\)) /
found from parent/molecular ion peak;
Allow mass for m/z.
OR
compound has methyl/\({\text{C}}{{\text{H}}_{\text{3}}}\);
m/z = 15 due to \({\text{CH}}_3^ + \);
OR
compound has propyl/\({{\text{C}}_{\text{3}}}{{\text{H}}_{\text{7}}}\)/isopropyl/\({\text{CH(C}}{{\text{H}}_{\text{3}}}{{\text{)}}_{\text{2}}}\)/acetyl/\({\text{C}}{{\text{H}}_{\text{3}}}{\text{CO}}\);
m/z = 43 due to \({{\text{C}}_{\text{3}}}{\text{H}}_7^ + {\text{/CH(C}}{{\text{H}}_{\text{3}}}{\text{)}}_2^ + {\text{/C}}{{\text{H}}_{\text{3}}}{\text{C}}{{\text{O}}^ + }\);
OR
compound has acetoxy/\({\text{C}}{{\text{H}}_{\text{3}}}{\text{COO}}\);
m/z = 59 due to \({\text{C}}{{\text{H}}_{\text{3}}}{\text{CO}}{{\text{O}}^ + }\);
Fragment must contain + sign in relevant marks above.
Penalize missing charges where relevant once only in (a)(i) and (ii).
(ii) loss of \({\text{C}}{{\text{H}}_3}\)–O / loss of radical with m/z = 31 / formation of \({{\text{C}}_{\text{2}}}{{\text{H}}_{\text{3}}}{{\text{O}}^ + }{\text{/}}{{\text{C}}_{\text{3}}}{\text{H}}_7^ + {\text{/CH(C}}{{\text{H}}_{\text{3}}}{\text{)}}_2^ + \);
Penalize missing charges where relevant once only in (a)(i) and (ii).
(i) Present: carbonyl/C=O;
Do not accept aldehyde / ketone.
Accept ester/alkanoate only if m/z = 59 given in (a)(i).
Absent: carbon-carbon double bond/C=C/alkene;
(ii) no (broad) absorption at 2500-3300 \({\text{(c}}{{\text{m}}^{ - 1}}{\text{)}}\);
no O–H bond;
Award [1 max] for just stating “absorption at 1050-1410 (cm–1) / C-O bond present of alcohol/ester/ether”.
Do not accept just "C-O bond present".
Accept “peak” for “absorption”.
(iii) Any two structures from:
Do not penalize CH3-C connectivity here.
(i) radio (wave);
(ii) I: one signal/H environment and (compound) II: three signals/H environments;
EITHER
Award [1 max] for any two of the following chemical shift ranges from the Data Booklet:
I: 2.2-2.7 (ppm) / II: 2.2-2.7 (ppm)
II: 0.9-1.0 (ppm)
II: 9.4-10.0 (ppm);
Ranges must be associated with the correct compound (I or II).
OR
II: signal at 0.9-1.0 (ppm) and I: no such signal;
OR
II: signal at 9.4-10.0 (ppm) and I: no such signal;
Accept answers that correctly discuss differences in splitting patterns (though not on SL syllabus).
Accept “peak” for “signal”.
Do not award M2 if any contradictory chemical shift ranges are given (eg, do not allow 0.9-1.0 (ppm) for compound I).
Examiners report
In (a) (i) many candidates associated the molecular ion peak with the molar mass of the compound. Some stated incorrectly that the mass was 74, instead of stating that the molar mass was \({\text{74 g}}\,{\text{mo}}{{\text{l}}^{ - 1}}\). (ii) proved problematic for a number of candidates and the difference between the loss of radicals and the positively charged fragments remaining was often lost. Greater emphasis on this difference in the teaching of this part of the curriculum on fragmentation might be worth exploring further with cohorts.
In (b) (i), most candidates identified the presence of the C=O and the absence of the C=C groups on the IR spectrum.
In (ii), although a large number of candidates stated that there is no broad absorption in the \({\text{2500 - 3300 c}}{{\text{m}}^{ - 1}}\) range, equating this to the absence of the OH bond in the IR spectrum, surprisingly some gave a more limited range of \({\text{3200 - 3600 c}}{{\text{m}}^{ - 1}}\) and associated this with the absence of hydrogen bonding. Although Table 17 of the Data Booklet does not refer specifically to the broad nature of the OH absorption in the \({\text{2500 - 3300 c}}{{\text{m}}^{ - 1}}\) range for carboxylic acids, it might be worth pointing this feature out in the teaching of IR spectroscopy, based on careful analysis of real spectral examples of carboxylic acids. In (iii), the most common mistake involved candidates drawing isomers including the OH group, which scored no marks. One G2 comment claimed that drawing an ester is not part of the syllabus. However, esters are mentioned explicitly in AS 10.1.11.
In (c) (i), nearly all identified the correct region of the EMS, namely radiowaves. (ii) proved to be a good discriminating question. Many knew that compound I had one hydrogen environment and compound II had three hydrogen environments, but only the better candidates scored the second mark. The most common mistake involved stating that compound I had a chemical shift range 0.9-1.0 ppm for the six methyl hydrogens. Many candidates clearly did not realise that the methyl groups in propanone are adjacent to the carbonyl, so hence have a higher value for the chemical shift, i.e. 2.2-2.7 ppm.
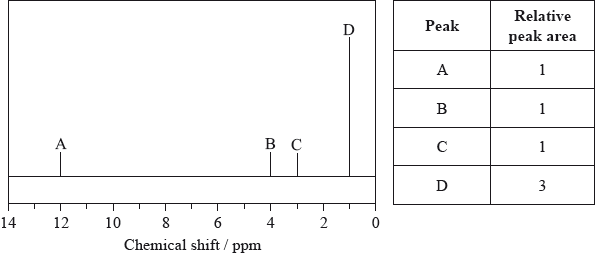
The mass spectrum of an unknown acidic compound, X, with empirical formula \({\text{C}}{{\text{H}}_{\text{2}}}{\text{O}}\), is shown below.
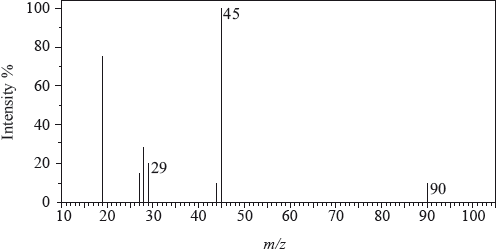
The low-resolution \(^{\text{1}}{\text{H}}\,{\text{NMR}}\) spectrum of X shows four peaks. A simplified representation is shown alongside a table with relative peak areas.
Determine the relative molecular mass, to the nearest integer, of the compound from the mass spectrum and deduce the formula of the molecular ion.
Deduce the formula of the fragment responsible for the peak at 45.
Deduce the formula of the fragment responsible for the peak at 29.
Identify the group responsible for the peak at D.
Suggest a possible structure for X.
Markscheme
90;
\({{\text{C}}_3}{{\text{H}}_6}{\text{O}}_3^ + \);
Penalize missing positive charge of ion only once in (a).
\({\text{COO}}{{\text{H}}^ + }\);
Accept C2H5O+.
Penalize missing positive charge of ion only once in (a).
\({\text{CH}}{{\text{O}}^ + }/{\text{CO}}{{\text{H}}^ + }\);
Accept C2H5+/CH3CH2+.
Penalize missing positive charge of ion only once in (a).
\({\text{C}}{{\text{H}}_3}\)/methyl;
\({\text{C}}{{\text{H}}_3}{\text{CH(OH)COOH}}\);
Allow full or condensed structural formula.
Examiners report
The Relative Molecular Mass was determined correctly but, curiously, the positive charge was omitted from the molecular ion even though it was given in parts (ii) and (iii). Part (b) was answered well although some candidates introduced a phenyl group in the structure. In part (c), the explanations were reasonable although candidates need to realize that the molecule is already vibrating; it now vibrates more. Many realized that there is a change in the dipole moment of the molecule.
As far as possible examiners use actual, rather than modified, spectra. The large peak at m/z = 19 is caused by the presence of \({{\text{H}}_{\text{3}}}{{\text{O}}^ + }\) and that at m/z = 15 is very unstable. Candidates, in general, had little difficulty interpreting the mass spectrum.
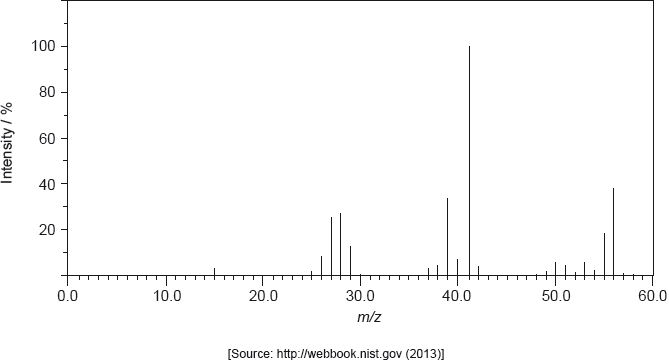
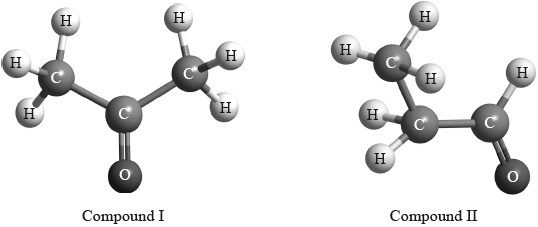
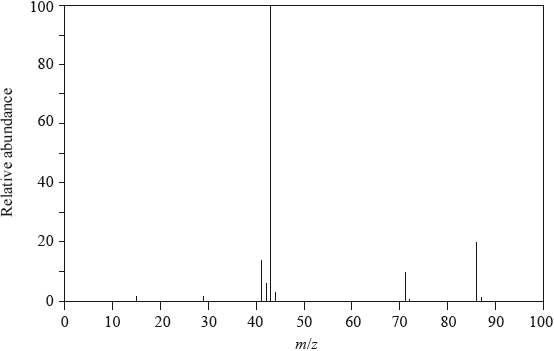
Compound P contains a carbonyl group (C=O) and has the molecular formula C3H6O.
Pentan-2-one has the following mass spectrum.
Draw the two possible structures of compound P.
Explain why the infrared spectra of the structures in (a) are very similar.
Explain how the mass spectra of the structures in (a) can be used to distinguish between them.
Deduce the formulas of the species with the m/z values at 86, 71 and 43.
\(m{\text{/}}z = 86\):
\(m{\text{/}}z = 71\):
\(m{\text{/}}z = 43\):
Suggest a reason for the peak at m/z = 43 having an exceptionally high relative abundance.
Markscheme
\({\text{C}}{{\text{H}}_{\text{3}}}{\text{COC}}{{\text{H}}_{\text{3}}}\) and \({\text{C}}{{\text{H}}_{\text{3}}}{\text{C}}{{\text{H}}_{\text{2}}}{\text{CHO}}\);
Accept full or condensed structural formulas.
Ignore incorrect names as long as structures are correct.
same/similar (types of) bonds / both contain the carbonyl group/C=O;
Do not accept same functional group.
(mass spectrum of) \({\text{C}}{{\text{H}}_{\text{3}}}{\text{C}}{{\text{H}}_{\text{2}}}{\text{CHO}}\) contains peak at \(m{\text{/}}z = 29\) / \({\text{C}}{{\text{H}}_{\text{3}}}{\text{COC}}{{\text{H}}_{\text{3}}}\) does not contain peak at \(m{\text{/}}z = 29\);
(corresponding to) loss of \({{\text{C}}_{\text{2}}}{{\text{H}}_{\text{5}}}\) / \({M_{\text{r}}} - {{\text{C}}_{\text{2}}}{{\text{H}}_{\text{5}}}\) / \({\text{CH}}{{\text{O}}^ + }\) / loss of CHO / \({M_{\text{r}}} - {\text{CHO}}\) / \({{\text{C}}_{\text{2}}}{\text{H}}_{\text{5}}^ + \);
OR
(mass spectrum of) \({\text{C}}{{\text{H}}_{\text{3}}}{\text{C}}{{\text{H}}_{\text{2}}}{\text{CHO}}\) contains a (strong) peak at \(m{\text{/}}z = 57\) / \({\text{C}}{{\text{H}}_{\text{3}}}{\text{COC}}{{\text{H}}_{\text{3}}}\) does not contain a (strong) peak at \(m{\text{/}}z = 57\);
(corresponding to) loss of H / \({M_{\text{r}}} - {\text{H}}\) / \({\text{C}}{{\text{H}}_{\text{3}}}{\text{C}}{{\text{H}}_{\text{2}}}{\text{C}}{{\text{O}}^ + }\);
Penalize missing + once only in A1.
m/z = 86: \({\text{C}}{{\text{H}}_{\text{3}}}{\text{C}}{{\text{H}}_{\text{2}}}{\text{C}}{{\text{H}}_{\text{2}}}{\text{COCH}}_{\text{3}}^ + {\text{/}}{{\text{C}}_{\text{3}}}{{\text{H}}_{\text{7}}}{\text{COCH}}_{\text{3}}^ + {\text{/}}{{\text{C}}_{\text{5}}}{{\text{H}}_{{\text{10}}}}{{\text{O}}^ + }\);
m/z = 71: \({\text{C}}{{\text{H}}_{\text{3}}}{\text{C}}{{\text{H}}_{\text{2}}}{\text{C}}{{\text{H}}_{\text{2}}}{\text{C}}{{\text{O}}^ + }{\text{/}}{{\text{C}}_{\text{3}}}{{\text{H}}_{\text{7}}}{\text{C}}{{\text{O}}^ + }{\text{/}}{{\text{C}}_{\text{4}}}{{\text{H}}_{\text{7}}}{{\text{O}}^ + }\);
Accept CH3COCH2CH2+
m/z = 43: \({\text{C}}{{\text{H}}_{\text{3}}}{\text{C}}{{\text{H}}_{\text{2}}}{\text{CH}}_{\text{2}}^ + {\text{ / C}}{{\text{H}}_{\text{3}}}{\text{C}}{{\text{O}}^ + }{\text{ / }}{{\text{C}}_{\text{3}}}{\text{H}}_{\text{7}}^ + {\text{ / }}{{\text{C}}_{\text{2}}}{{\text{H}}_{\text{3}}}{{\text{O}}^ + }\);
Penalize missing + once only in A1.
\({\text{C}}{{\text{H}}_{\text{3}}}{\text{C}}{{\text{H}}_{\text{2}}}{\text{CH}}_{\text{2}}^ + \) and \({\text{C}}{{\text{H}}_{\text{3}}}{\text{C}}{{\text{O}}^ + }\)/two species have this mass/m/z;
Do not penalize missing + in this part.
Examiners report
The majority of candidates was able to identify the two structures in (a) and recognized that IR spectroscopy could not distinguish them easily because they contained the same types of bonds in (b).
The majority of candidates was able to identify the two structures in (a) and recognized that IR spectroscopy could not distinguish them easily because they contained the same types of bonds in (b).
Answers to part (c) were often general and did not meet the requirements. Only few candidates predicted the peaks in the mass spectrum that could be used to distinguish the two compounds.
Part (d)(i) and (ii) were answered well by about half the candidates. However, some candidates are still forgetting to include a positive charge for fragments detected in the mass spectrometer.
Part (d)(i) and (ii) were answered well by about half the candidates. However, some candidates are still forgetting to include a positive charge for fragments detected in the mass spectrometer.
The \(^{\text{1}}{\text{H}}\,{\text{NMR}}\) spectrum of X with molecular formula \({{\text{C}}_{\text{3}}}{{\text{H}}_{\text{6}}}{\text{O}}\) is shown below.
The infrared and mass spectra for X were also recorded.
Deduce which of the following compounds is X and explain your answer.
\({\text{C}}{{\text{H}}_{\text{3}}}\)–CO–\({\text{C}}{{\text{H}}_{\text{3}}}\) \({\text{C}}{{\text{H}}_{\text{3}}}\)–\({\text{C}}{{\text{H}}_{\text{2}}}\)–CHO \({\text{C}}{{\text{H}}_{\text{2}}}\)–CH–\({\text{C}}{{\text{H}}_{\text{2}}}{\text{OH}}\)
Compound:
Explanation:
Deduce which one of the peaks in the \(^{\text{1}}{\text{H}}\,{\text{NMR}}\) spectrum of X would also occur in the spectrum of one of the other isomers, giving your reasoning.
Apart from absorptions due to C–C and C–H bonds, suggest one absorption, in wavenumbers, that would be present in the infrared spectrum.
Apart from absorptions due to C–C and C–H bonds, suggest one absorption, in wavenumbers, absent in this infrared spectrum but present in one of the other compounds shown in part (a).
Suggest the formulas and m/z values of two species that would be detected in the mass spectrum.
Species:
m/z:
Species:
m/z:
Markscheme
Compound:
\({\text{C}}{{\text{H}}_{\text{3}}}\)–\({\text{C}}{{\text{H}}_{\text{2}}}\)–CHO;
Explanation:
only this compound would give 3 peaks / OWTTE;
only this compound has H–atoms in 3 different chemical environments / OWTTE;
only this compound has protons in ratio 3:2:1 in each environment / OWTTE
only this compound would give a peak in the 9.4–10 ppm region / OWTTE;
2.5 ppm peak;
\({\text{C}}{{\text{H}}_{\text{3}}}\)–CO–\({\text{C}}{{\text{H}}_{\text{3}}}\) also has hydrogen atoms on a carbon next to the >C=O group;
1700–1750 \({\text{c}}{{\text{m}}^{ - 1}}\) (>C=O);
1610–1680 \({\text{c}}{{\text{m}}^{ - 1}}\) (>C=C<) / 3200–3600 \({\text{c}}{{\text{m}}^{ - 1}}\) (–O–H);
\({{\text{C}}_{\text{3}}}{{\text{H}}_{\text{6}}}{{\text{O}}^ + }\) and m/z = 58;
\({{\text{C}}_{\text{2}}}{\text{H}}_5^ + \) and m/z = 29;
\({\text{CH}}{{\text{O}}^ + }\) and m/z = 29;
\({\text{CH}}_3^ + \) and m/z = 15;
Penalize missing + sign once only.
Examiners report
Quite a few candidates demonstrated some skill in interpreting the nmr spectrum in terms of the groups present and could identify features that were likely to be present and absent in the in the infra-red and mass spectra, though in the latter many omitted the charges on the ions. Candidates gave too little thought to predicting features of the nmr spectra of the other compounds, concentrating on the hydrocarbon group without taking into account the neighbouring functional group.
Quite a few candidates demonstrated some skill in interpreting the nmr spectrum in terms of the groups present and could identify features that were likely to be present and absent in the in the infra-red and mass spectra, though in the latter many omitted the charges on the ions. Candidates gave too little thought to predicting features of the nmr spectra of the other compounds, concentrating on the hydrocarbon group without taking into account the neighbouring functional group.
Quite a few candidates demonstrated some skill in interpreting the nmr spectrum in terms of the groups present and could identify features that were likely to be present and absent in the in the infra-red and mass spectra, though in the latter many omitted the charges on the ions. Candidates gave too little thought to predicting features of the nmr spectra of the other compounds, concentrating on the hydrocarbon group without taking into account the neighbouring functional group.
Quite a few candidates demonstrated some skill in interpreting the nmr spectrum in terms of the groups present and could identify features that were likely to be present and absent in the in the infra-red and mass spectra, though in the latter many omitted the charges on the ions. Candidates gave too little thought to predicting features of the nmr spectra of the other compounds, concentrating on the hydrocarbon group without taking into account the neighbouring functional group.
Quite a few candidates demonstrated some skill in interpreting the nmr spectrum in terms of the groups present and could identify features that were likely to be present and absent in the in the infra-red and mass spectra, though in the latter many omitted the charges on the ions. Candidates gave too little thought to predicting features of the nmr spectra of the other compounds, concentrating on the hydrocarbon group without taking into account the neighbouring functional group.
The IR spectrum below represents one of the three organic compounds: propan-1-ol (CH3CH2CH2OH), propanal (CH3CH2CHO) or propanoic acid (CH3CH2COOH).
Analyse the spectrum and identify two bonds other than C–H that are present and one that is absent in this compound. Refer to Table 17 of the Data booklet to complete the table.
Bonds present:
Bond absent:
The mass spectrum of the same compound contains strong peaks of \({({M_{\text{r}}} - 15)^ + }\) and \({({M_{\text{r}}} - 17)^ + }\) ions. The first signal corresponds to the loss of a methyl group, \({\text{C}}{{\text{H}}_{\text{3}}}\), from the molecule. Deduce which fragment is lost to produce the second peak.
Using the information above, deduce the identity of the organic compound.
Predict the number of peaks in the \(^{\text{1}}{\text{H}}\,{\text{NMR}}\) spectrum of this compound.
Markscheme
Bonds present: [2 max]
Bonds absent: [1 max]
Accept other bonds/groups (C\(\equiv\)C/ alkyne, etc.) even if they do not present in any of the three molecules.
No credit if atoms other than C, H or O are involved.
Award marks for functional group/bond names and ignore wavenumbers.
OH/hydroxyl/alcohol;
Accept +OH.
propan-1-ol/CH3CH2CH2OH;
Accept “alcohol”.
4;
Accept ECF from (c) – if propanoic acid/propanal = 3 peaks.
Examiners report
In (a), the spectrum was well interpreted and few had little difficulty in gaining three marks. The three possible compounds were given in the stem so candidates did not score the last mark if the “absent” bond included an atom not present. One G2 respondent commented that asking students to locate bonds in the fingerprint region is questionable; as it turned out, the candidates had no difficulty with this.
Most were then able to progress through the rest of the question without difficulty although several gave compounds in (c) that were not in the stem of the question.
In (d) the answer given was generally consistent with the answer given in (c).
The mass spectrum of iodoethane, \({{\text{C}}_{\text{2}}}{{\text{H}}_{\text{5}}}{\text{I}}\), shows three prominent peaks with m/z values of 156, 127 and 29. Identify the ions responsible for each of these three prominent peaks.
Bromine contains two isotopes, \(^{{\text{79}}}{\text{Br}}\) and \(^{{\text{81}}}{\text{Br}}\), in approximately equal amounts. Predict the m/z values of the prominent peaks in the mass spectrum of bromoethane, \({{\text{C}}_{\text{2}}}{{\text{H}}_{\text{5}}}{\text{Br}}\).
Markscheme
\({{\text{C}}_2}{{\text{H}}_5}{{\text{I}}^ + }\);
\({{\text{I}}^ + }\) and \({{\text{C}}_2}{\text{H}}_5^ + \);
Penalize once only if the + sign is missing.
108 and 110;
79 and 81;
29;
Examiners report
Part (a), identification of the ions, was answered well by most candidates. Few missed charge or used incorrect charge on the ions e.g. \({{\text{I}}^ - }\). For part (b), most scored the point for 29. Prominent peaks values for bromine isotopes proved to be a little more challenging for the candidates, many gave average values of 109 and 80 as other answers.
Part (a), identification of the ions, was answered well by most candidates. Few missed charge or used incorrect charge on the ions e.g. \({{\text{I}}^ - }\). For part (b), most scored the point for 29. Prominent peaks values for bromine isotopes proved to be a little more challenging for the candidates, many gave average values of 109 and 80 as other answers.
Three isomers of \({{\text{C}}_{\text{3}}}{{\text{H}}_{\text{6}}}{{\text{O}}_{\text{2}}}\) are ethyl methanoate, methyl ethanoate and propanoic acid.
Explain which of the three compounds has an infrared spectrum with a broad absorption between 2500–3300 cm–1 and an absorption at 1730 cm–1.
Markscheme
propanoic acid;
only one with OH which accounts for (broad) absorption between 2500–3300 cm–1
region / OWTTE;
Examiners report
Many students could use the spectroscopic data provided to correctly identify the compounds, with the first part of the question, dealing with mass spectrometer data, probably proving the most challenging.
Nuclear magnetic resonance (NMR) and mass spectrometry are diagnostic techniques often used in the identification of organic compounds.
Deduce two similarities and one difference in the \(^{\text{1}}{\text{H}}\,{\text{NMR}}\) spectra of the two isomers \({\text{C}}{{\text{H}}_{\text{3}}}{\text{COOH}}\), a carboxylic acid, and \({\text{HCOOC}}{{\text{H}}_{\text{3}}}\), an ester. \(^{\text{1}}{\text{H}}\,{\text{NMR}}\) data are given in Table 18 of the Data Booklet.
Similarities:
Difference:
The mass spectrum of one of the two isomers above has significant peaks at mass to charge ratios of 15, 45 and 60, while the other isomer has peaks at 15, 29, 31 and 60. Analyse these fragmentation patterns in the two mass spectra in order to distinguish between the two isomers.
Markscheme
Similarities: [2 max]
both have two peaks;
in the same/1:3 ratio;
both have only singlet peaks;
Difference:
\({\text{C}}{{\text{H}}_3}{\text{COOH}}\) will have an absorption/chemical shift/\(\delta \) in the range 2.0–2.5, (\({\text{HCOOC}}{{\text{H}}_3}\) will not) / \({\text{HCOOC}}{{\text{H}}_3}\) will have an absorption in the range 3.8–4.1, (\({\text{C}}{{\text{H}}_3}{\text{COOH}}\) will not) / \({\text{C}}{{\text{H}}_3}{\text{COOH}}\) will have an absorption in the range 9.0–13.0, (\({\text{HCOOC}}{{\text{H}}_3}\) will not);
CH3COOH:
peak at 45 due to \({{\text{(COOH)}}^ + }\) / \({{\text{(}}{M_{\text{r}}} - 15{\text{)}}^ + }\) due to loss of \({\text{C}}{{\text{H}}_3}\);
HCOOCH3:
peak at 31 due to \({{\text{(OC}}{{\text{H}}_3}{\text{)}}^ + }\) / \({{\text{(}}{M_{\text{r}}} - 29{\text{)}}^ + }\) due to loss of HCO/CHO / peak at 29 due to \({{\text{(HCO)}}^ + }\)/\({{\text{(CHO)}}^ + }\) / \({{\text{(}}{M_{\text{r}}} - 31{\text{)}}^ + }\) due to loss of \({\text{OC}}{{\text{H}}_3}\);
Penalize missing + sign once only.
Brackets not required around fragments for marks.
Examiners report
(a) was generally answered well, the commonest errors being to include the 0.9-1.0 ppm chemical shift for the methyl group.
(b) was generally answered well, the commonest errors being omitting the charges on the ions.
Infrared (IR) spectroscopy is widely used as a technique in analytical chemistry.
The IR spectrum, mass spectrum and \(^{\text{1}}{\text{H}}\,{\text{NMR}}\) spectrum of an unknown compound, X, of molecular formula \({{\text{C}}_{\text{3}}}{{\text{H}}_{\text{6}}}{{\text{O}}_{\text{2}}}\) are as follows.
Explain what happens at a molecular level during the absorption of IR radiation by carbon dioxide, CO2.
(i) Identify the bonds responsible for the peaks A, B and C in the IR spectrum of X.
A:
B:
C:
(ii) In the mass spectrum of X, deduce which ions the m/z values at 74, 45 and 29 correspond to.
m/z = 74:
m/z = 45:
m/z = 29:
(iii) Identify the peak at 11.73 ppm in the \(^{\text{1}}{\text{H}}\,{\text{NMR}}\) spectrum.
(iv) Deduce the structure of X.
Markscheme
change in bond length / bond stretching / asymmetric stretch;
change in bond angle / bending (of molecule);
Allow [1 max] for only stating vibrations.
induces molecular polarity/dipole moment / OWTTE;
(i) A: O–H
B: C=O
C: C–O
Award [2] for three correct, [1] for two correct.
(ii) m/z = 74: \({{\text{C}}_2}{{\text{H}}_5}{\text{COO}}{{\text{H}}^ + }\) / \({{\text{C}}_3}{{\text{H}}_6}{\text{O}}_2^ + \);
m/z = 45: \({\text{COO}}{{\text{H}}^ + }\);
m/z = 29: \({{\text{C}}_2}{\text{H}}_5^ + \);
Penalize missing + charge once only.
Do not award mark for m/z = 29: CHO+.
(iii) –COOH
Accept –OH.
(iv) \({\text{C}}{{\text{H}}_3}{\text{C}}{{\text{H}}_2}{\text{COOH}}\) / \({\text{C}}{{\text{H}}_3}{\text{C}}{{\text{H}}_2}{\text{C}}{{\text{O}}_2}{\text{H}}\);
More detailed structural formula may be given.
Examiners report
In (b) the main misconception stated by candidates was that non-polar compounds do not absorb infrared radiation. Most candidates scored a mark for vibrations, but many misunderstood the difference between symmetric and asymmetric stretching.
Part (c)(i) was well answered by the great majority of candidates; giving C–H bond instead of O–H for A was a popular incorrect answer. In (ii) the most common mistake was missing the + sign. Most candidates answered (iii) and (iv) correctly.
\(^{\text{1}}{\text{H}}\,{\text{NMR}}\) and IR spectroscopy both involve the absorption of electromagnetic radiation.
Identify the region of the electromagnetic spectrum used in \(^{\text{1}}{\text{H}}\,{\text{NMR}}\) spectroscopy.
Identify which of these two techniques involves higher energy radiation.
Markscheme
radiowaves;
IR / infrared;
Examiners report
Candidates had few problems in (a), but although the correct selection of HCl was usually made in (b), many lost a mark as they did not refer to the change of dipole during the absorption of IR radiation.
Candidates had few problems in (a), but although the correct selection of HCl was usually made in (b), many lost a mark as they did not refer to the change of dipole during the absorption of IR radiation.
Two students were provided with three different isomers of \({{\text{C}}_{\text{3}}}{{\text{H}}_{\text{6}}}{{\text{O}}_{\text{2}}}\).
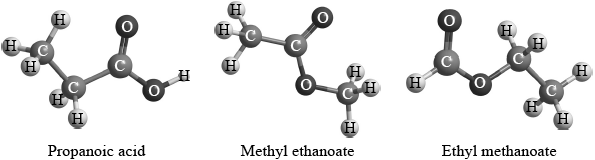
They were asked to suggest how the isomers could be distinguished and positively identified from each other using spectroscopic techniques. Student A said that they could be positively identified just from their infrared spectra. Student B said that they could be positively identified just from the number of peaks and the areas under each peak in their \(^{\text{1}}{\text{H}}\,{\text{NMR}}\) spectra.
Evaluate these two claims and suggest how any possible limitations could be overcome using the same spectroscopic technique.
Student A / Infrared:
Student B / \(^{\text{1}}{\text{H}}\,{\text{NMR}}\):
Markscheme
Student A / Infrared
propanoic acid can be distinguished from the other two by the (broad) absorption at \({\text{2500–3300 c}}{{\text{m}}^{ - 1}}\) /due to –OH absorption in carboxylic acids;
not easy to distinguish between methyl ethanoate and ethyl methanoate because all absorb at \({\text{1700–1750 c}}{{\text{m}}^{ - 1}}\) / C=O / \({\text{1050–1410 c}}{{\text{m}}^{ - 1}}\) / C–O / \({\text{2850–3100 c}}{{\text{m}}^{ - 1}}\) / C–H / because they have same functional groups;
can be distinguished from the pattern in the fingerprint region / by comparing with spectra of known samples;
Student B / 1H NMR
methyl ethanoate can be distinguished from the other two as it will have two peaks of equal area (due to the two –CH3 groups);
propanoic acid and ethyl methanoate cannot be distinguished as both have three peaks / peaks in the ratio of 1:2:3;
chemical shift is also required to distinguish them;
Absorption value or name of functional group required for M1 and M2.
Examiners report
This question proved to be very challenging for most candidates as majority were unable to evaluate the two claims. Candidates appeared to have some general understanding but were often lacking depth in understanding of the two analytical techniques. The answers were often too general and most did not suggest ways to overcome limitations using the same spectroscopic techniques. Limited understanding of the directive term ‘evaluate’ along with missing the ‘same’ spectroscopic technique in the question stem, penalized the most students from scoring even part marks.
Describe the essential difference between the emission spectrum of sodium and the absorption spectrum of sodium.
Identify the five missing components in the following table.
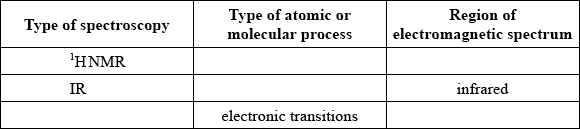
Markscheme
Emission spectrum: coloured lines and Absorption spectrum: black/dark lines;
OR
Emission spectrum: lines and Absorption spectrum: continuous;
Allow “Emission spectrum: electrons emit energy as they drop to lower energy levels and Absorption spectrum: electrons absorb energy as they are promoted to higher energy levels” / OWTTE.
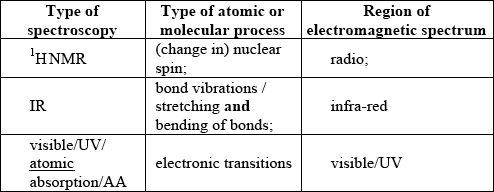 ;
;
For M4 both visible/UV/atomic absorption/AA for type of spectroscopy and region of EMS required.
Examiners report
Students found it difficult to explain clearly the difference between emission and absorption spectra for part (a). Most candidates successful in gaining the mark, described the difference in terms of energy released or absorbed by the electrons. There was lack of understanding however for the difference in the coloured and the dark lines produced by the two spectra. Candidates who described the difference in terms of coloured lines or continuous spectrum had difficulty attaining the mark. Very few students achieved all 4 points for part (b). Most had difficulty completing the information for \(^{\text{1}}{\text{H}}\,{\text{NMR}}\). Many stated a number for what was measured instead of the atomic/molecular process e.g. chemical shift as opposed to nuclear spin. Candidates were well prepared for answering part (c) often, stating concentration of the element as the answer.
Students found it difficult to explain clearly the difference between emission and absorption spectra for part (a). Most candidates successful in gaining the mark, described the difference in terms of energy released or absorbed by the electrons. There was lack of understanding however for the difference in the coloured and the dark lines produced by the two spectra. Candidates who described the difference in terms of coloured lines or continuous spectrum had difficulty attaining the mark. Very few students achieved all 4 points for part (b). Most had difficulty completing the information for \(^{\text{1}}{\text{H}}\,{\text{NMR}}\). Many stated a number for what was measured instead of the atomic/molecular process e.g. chemical shift as opposed to nuclear spin. Candidates were well prepared for answering part (c) often, stating concentration of the element as the answer.
Three isomers of \({{\text{C}}_{\text{3}}}{{\text{H}}_{\text{6}}}{{\text{O}}_{\text{2}}}\) are ethyl methanoate, methyl ethanoate and propanoic acid.
Explain which of the three compounds has a \(^{\text{1}}{\text{H}}\,{\text{NMR}}\) spectrum showing two peaks with equal areas under each peak.
Markscheme
methyl ethanoate;
the only one with (the six H atoms in) two different chemical environments / the two CH3 groups give equal areas / OWTTE;
Award [1] for correct second marking point in (a)–(c) even if compound is wrongly identified.
Examiners report
Many students could use the spectroscopic data provided to correctly identify the compounds, with the first part of the question, dealing with mass spectrometer data, probably proving the most challenging.
A class was determining the concentration of aqueous sodium hydroxide by titrating it with hydrochloric acid, whilst monitoring the pH of the solution. The sodium hydroxide solution was added into a glass beaker from a measuring cylinder and the hydrochloric acid added using a burette. One group of students accidentally used a temperature probe rather than a pH probe. Their results are given below.
Volume of aqueous NaOH = 25.0 ± 0.5 cm3
Concentration of HCl = 1.00 ± 0.01 mol dm−3

State and explain how the graph would differ if 1 mol\(\,\)dm−3 sulfuric acid had been used instead of 1 mol\(\,\)dm−3 hydrochloric acid.
Markscheme
graph would peak/maximum at 17.5 cm3
OR
smaller volume of acid «needed to reach equivalence»
sulfuric acid is dibasic/diprotic
higher temperature would be reached
Accept “gradient/slope «of graph» is greater/steeper” for M1.
Accept “one mole of sulfuric acid neutralizes two moles of NaOH” for M2.
[2 marks]
Examiners report
A class was determining the concentration of aqueous sodium hydroxide by titrating it with hydrochloric acid, whilst monitoring the pH of the solution. The sodium hydroxide solution was added into a glass beaker from a measuring cylinder and the hydrochloric acid added using a burette. One group of students accidentally used a temperature probe rather than a pH probe. Their results are given below.
Volume of aqueous NaOH = 25.0 ± 0.5 cm3
Concentration of HCl = 1.00 ± 0.01 mol dm−3
Calculate the percentage uncertainty of the volume of the aqueous sodium hydroxide.
Suggest how the precision of this measurement could be improved.
Markscheme
«\(\frac{{0.5}}{{25.0}} \times 100\)» = 2 «%»
[1 mark]
pipette/pipet «rather than a measuring cylinder»
Accept “using a burette/buret”.
Accept “using a volumetric/measuring flask”.
Do not accept “use of a more precise measuring cylinder”.
[1 mark]
Examiners report
Opiates have been used for thousands of years to alleviate pain. The structures of opiates are found in section 37 of the data booklet.
Diamorphine (heroin) can be synthesized from morphine. Identify the reagent necessary for this reaction and the by-product of this reaction.

The reaction can be monitored by infrared spectroscopy. Using section 26 of the data booklet, identify two IR absorbance ranges that would help distinguishing the two compounds.
Present in morphine but not in diamorphine:
Present in diamorphine but not in morphine:
Discuss how the differences in structure between morphine and diamorphine affect their absorption in the body.
Markscheme

Accept names or structural formulas for reagent and by-product.
Accept IUPAC or alternative names of compounds e.g. acetic acid.
Award M2 only if the by-product corresponds to the reagent.
Present in morphine but not in diamorphine:
«has OH and absorbance at» 3200–3600 «cm–1»
Present in diamorphine but not in morphine:
«has C=O and absorbance at» 1700–1750 «cm–1»
morphine has «two» hydroxyl «groups» AND diamorphine/heroin has «two»
ester/ethanoate/acetate «groups»
morphine is more polar than diamorphine/heroin
diamorphine/heroin crosses the blood-brain barrier «easily»
morphine is <more> soluble in blood «plasma»
OR
diamorphine/heroin is «more» soluble in lipids
Accept converse argument throughout. Accept “alcohol/hydroxy” for “hydroxyl” but not “hydroxide”.
Do not accept “diamorphine/heroin is non-polar” for M2.
Examiners report
A class was determining the concentration of aqueous sodium hydroxide by titrating it with hydrochloric acid, whilst monitoring the pH of the solution. The sodium hydroxide solution was added into a glass beaker from a measuring cylinder and the hydrochloric acid added using a burette. One group of students accidentally used a temperature probe rather than a pH probe. Their results are given below.
Volume of aqueous NaOH = 25.0 ± 0.5 cm3
Concentration of HCl = 1.00 ± 0.01 mol dm−3
The graph of temperature against titre can be used to calculate the concentration of alkali without knowing the concentration of the hydrochloric acid, using the enthalpy of neutralization.
Explain how the concentration may be calculated in this way.
Heat losses would make this method less accurate than the pH probe method. Outline why the thermometric method would always give a lower, not a higher, concentration.
Suggest how heat loss could be reduced.
State one other assumption that is usually made in the calculation of the heat produced.
Suggest why scientists often make assumptions that do not correspond to reality.
Outline why the thermochemical method would not be appropriate for 0.001 mol\(\,\)dm−3 hydrochloric acid and aqueous sodium hydroxide of a similar concentration.
Markscheme
heat change/evolved can be calculated from the «maximum» temperature increase and the mass of solution
OR
q = mcΔT
heat «evolved» gives the number of moles «of both acid and alkali present when neutralisation occurs»
OR
\(n = \frac{q}{{\Delta {H_{neut}}}}\)
volume «of acid and the volume of alkali required to just neutralise each other» can be used to calculate the concentration«s of both»
OR
\(\left[ {{\text{NaOH}}} \right] = \frac{n}{V}\)
[2 marks]
smaller temperature increase/ΔT
OR
heat released would «appear to» be less
amount of substance/n calculated is smaller
[2 marks]
using «expanded» polystyrene cup
OR
insulating beaker
OR
putting a lid on beaker
Do not accept calorimeter by itself.
Accept any other reasonable suggestion.
[1 mark]
«specific» heat capacity of the beaker/container/thermometer is ignored
OR
density of the solutions is assumed as 1.00 g\(\,\)cm–3/same as water
OR
specific heat capacity of the solutions is assumed as 4.18 J g–1\(\,\)K–1/same as water
Accept “reaction goes to completion”.
Accept “reaction is conducted under standard conditions”.
Accept “no evaporation occurs”.
Accept any other relevant valid assumption.
Do not accept “heat is not released from other reactions”.
[1 mark]
allows simple theories to be applied to real life situations
OR
enables us to start to understand complex situations
OR
gives answers that are accurate to the required order of magnitude
OR
simplifies the calculations involved
Do not accept “to simplify the situation” without further detail.
Accept “errors do not have a major impact on the results”.
[1 mark]
temperature rise would be too small «to be accurately measured»
Accept “heat released would be too small «to be accurately measured»”.
[1 mark]
Examiners report
Antacids react with hydrochloric acid in the stomach to relieve indigestion. A student investigated different brands of antacid to see which caused the largest increase in pH in a given time. She added the antacids to hydrochloric acid, and recorded the change in pH over five minutes.

State an equation for the reaction of magnesium hydroxide with hydrochloric acid.
Suggest two variables, besides the time of reaction, which the student should have controlled in the experiment to ensure a fair comparison of the antacids.
Calculate the uncertainty in the change in pH.
The student concluded that antacid B was the most effective, followed by A then C and finally D. Discuss two arguments that reduce the validity of the conclusion.
Markscheme
Mg(OH)2 (s) + 2HCl (aq) → MgCl2 (aq) + 2H2O (l)
Accept full or net ionic equation.
Any two from:
volume «of HCl»
concentration «of HCl»/[HCl]
temperature «of HCl»
mass of antacid/tablets
size of antacid particles/tablets
OR
surface area of antacid «particles»/tablets
Accept “number of tablets/different doses”.
Do not accept “same pH meter” OR “initial pH” OR “concentration of antacid/[antacid]”.
A variable must be given so do not accept answers such as “stirring”, “whether tablets are whole or crushed” etc.
[Max 2 Marks]
(±) 0.04
OR
(±) 0.03
Any two of:
uncertainty «(±)0.04/(±)0.03» means A and C cannot be distinguished
each measurement was conducted once
stomach pH should not be raised a lot «so antacid B is not necessarily effective»
mass/number of tablets/dose «of antacid» used was not controlled
actual environment in stomach is different
Accept “amount of tablets” for “dose”.
Do not accept “nature/composition of tablets differs”.
Accept an answer such as “time frame is too short since some antacids could be long-acting drugs if they contain a gelatinisation/delaying agent” but not just “time frame is too short since some antacids could be long-acting drugs”.
[Max 2 Marks]
Examiners report
A class was determining the concentration of aqueous sodium hydroxide by titrating it with hydrochloric acid, whilst monitoring the pH of the solution. The sodium hydroxide solution was added into a glass beaker from a measuring cylinder and the hydrochloric acid added using a burette. One group of students accidentally used a temperature probe rather than a pH probe. Their results are given below.
Volume of aqueous NaOH = 25.0 ± 0.5 cm3
Concentration of HCl = 1.00 ± 0.01 mol dm−3
Suggest how the end point of the titration might be estimated from the graph.
Markscheme
volume «found by extrapolation of the two best fit lines» required to give the highest temperature
OR
extrapolate «two best fit» lines to the point where they meet
Accept “where lines through the points meet”.
Accept “at maximum temperature”.
Accept “at 35 cm3 of HCl”.
[1 mark]
Examiners report
Solubility plays an important role in the bioavailability of drugs in the body.
Suggest why aspirin is slightly soluble in water. Refer to section 37 of the data booklet.
Formulate an equation for the conversion of aspirin to a more water soluble derivative.
A student prepares aspirin from salicylic acid in the laboratory, extracts it from the reaction mixture, ensures the sample is dry and determines its melting point.

Suggest why the melting point of the student’s sample is lower and not sharp compared to that of pure aspirin.
Organic molecules can be characterized using infrared (IR) spectroscopy.
Compare and contrast the infrared peaks above 1500 cm−1 in pure samples of aspirin and salicylic acid using section 26 of the data booklet.


The pharmaceutical industry is one of the largest producers of waste solvents.
State a green solution to the problem of organic solvent waste.
Markscheme
presence of «large» benzene/arene ring AND non-polar/hydrophobic
OR
presence of «large» benzene/arene ring AND cannot form H-bond with water
contain COOH/carboxyl/–OH/hydroxyl «and ester group» AND polar/hydrophilic
OR
contain COOH/carboxyl/–OH/hydroxyl «and ester group» AND can form H-bonds with water
Accept “phenyl” for “benzene ring”.
Accept "carboxylic acid" for "carboxyl".
Do not accept "alcohol" for "hydroxyl".
[2 marks]

OR
C6H4(OCOCH3)COOH + NaOH → C6H4(OCOCH3)COONa + H2O
Charges (O– and Na+) not necessary to score the mark.
Accept net ionic equation.
Accept any strong base in place of NaOH.
[1 mark]
«student’s» sample impure
lattice disrupted/not uniform «due to presence of impurities»
OR
fewer interparticle/intermolecular forces «due to presence of impurities»
Accept converse arguments.
[2 marks]
One similarity:
peak at 2500–3000 «cm–1»/peak due to O–H/hydroxyl in carboxylic acids
OR
peak at 1700–1750 «cm–1»/peak due to C=O/carbonyl
OR
peak at 2850–3090 «cm–1»/peak due to C–H of arene
One difference:
peak at 3200–3600 «cm–1» in salicylic acid/ peak due to O–H in phenol in salicylic acid
OR
«two» peaks at 1700–1750 «cm–1» in aspirin AND one peak «in the same area» in salicylic acid
Accept “peak at 1600 cm–1 for arene/benzene ring” – not in the data booklet.
Accept “2500–3600 cm–1 «overlapping absorptions of two O–H» in salicylic acid”.
Accept “stronger/broader/split peak at 1700–1750 cm–1 in aspirin”.
[2 marks]
«use of» alternative solvents such as supercritical/liquid CO2
OR
use of water «as solvent»
OR
solvent-free reactions «for example, polymerization of propene»
OR
solid-state chemistry
OR
recycle «waste» solvents
OR
catalysis that leads to better/higher yield
OR
reducing number of steps
Do not accept political/regulatory solutions.
“catalysis” not sufficient for mark.
[1 mark]
Examiners report
Disposable plastic lighters contain butane gas. In order to determine the molar mass of butane, the gas can be collected over water as illustrated below:

List the data the student would need to collect in this experiment.
Explain why this experiment might give a low result for the molar mass of butane.
Suggest one improvement to the investigation.
Markscheme
mass/m of lighter before AND after the experiment
volume of gas/Vgas «collected in the cylinder»
«ambient» pressure/P «of the room»
temperature/T
Accept “change in mass of lighter”.
Accept “weight” for “mass”.
Do not accept just “mass of lighter/gas”.
Accept “volume of water displaced”.
Do not accept “amount” for “volume” or “mass”.
[4 marks]
Any two of:
pressure of gas not equalized with atmospheric/room pressure
too large a recorded volume «of gas produces a lower value for molar mass of butane»
OR
cylinder tilted
difficult to dry lighter «after experiment»
OR
higher mass of lighter due to moisture
OR
smaller change in mass but same volume «produces lower value for molar mass of butane»
using degrees Celcius/°C instead of Kelvin/K for temperature
Accept “vapour pressure of water not accounted for” OR “incorrect vapour pressure of water used” OR “air bubbles trapped in cylinder”. Do not accept “gas/bubbles escaping «the cylinder»” or other results leading to a larger molar mass.
Accept “lighter might contain mixture of propane and butane”.
Do not accept only “human errors” OR “faulty equipment” (without a clear explanation given for each) or “mistakes in calculations”.
[2 marks]
record vapour pressure of water «at that temperature»
OR
equalize pressure of gas in cylinder with atmospheric/room pressure
OR
tap cylinder before experiment «to dislodge trapped air»
OR
collect gas using a «gas» syringe/eudiometer/narrower/more precise graduated tube
OR
collect gas through tubing «so lighter does not get wet»
OR
dry lighter «before and after experiment»
OR
hold «measuring» cylinder vertical
OR
commence experiment with cylinder filled with water
Accept “adjust cylinder «up or down» to ensure water level inside cylinder matches level outside”.
Accept “repeat experiment/readings «to eliminate random errors»”.
Accept “use pure butane gas”.
[1 mark]
Examiners report
The development of materials with unique properties is critical to advances in industry.
Low density polyethene (LDPE) and high density polyethene (HDPE) are both addition polymers.
Outline two properties a substance should have to be used as liquid-crystal in a liquid-crystal display.
Describe how the structures of LDPE and HDPE affect one mechanical property of the plastics.
One of the two infrared (IR) spectra is that of polyethene and the other of polytetrafluoroethene (PTFE).

Deduce, with a reason, which spectrum is that of PTFE. Infrared data is given in section 26 of the data booklet.
Many plastics used to be incinerated. Deduce an equation for the complete combustion of two repeating units of PVC, (–C2H3Cl–)2.
Markscheme
Any two of:
ability to form a LC phase
chemically stable
«LC phase that is» stable over suitable temperature range
polar
OR
being able to change orientation with applied electric field
rapid switching speed «responds to changes of voltage quickly»
Accept “ability of molecules to transmit light under certain conditions” OR “rodshaped molecules” OR “stable to light/not light sensitive”.
[Max 2 Marks]
branching in LDPE prevents close packing «of chains»
LDPE is more flexible/less rigid
OR
LDPE has lower «tensile» strength
Do not accept “difference in density”.
Award [1 max] for stating “branching in LDPE AND little/no branching in HDPE”.
B AND absence «of absorption of» C–H at 2850–3090 «cm–1»
OR
B AND presence of «absorption of» C–F at 1000–1400 «cm–1»
(–C2H3Cl–)2 (s) + 5O2 (g) → 4CO2 (g) + 2H2O (l) + 2HCl (g)
correct species in reactants and products
balanced
Accept “(–C2H3Cl–)2 (s) + 5.5O2 (g) → 4CO2 (g) + 3H2O (l) + Cl2 (g)”.
Award M2 only if M1 correct.
Examiners report
In order to provide safe drinking water, a water supply is often treated with disinfectants, which aim to inactivate disease-causing bacteria in the water.
To compare the effectiveness of different disinfectants, a CT value is used as a measure of the dosage of disinfectant needed to achieve a certain level of inactivation of specific bacteria.
CT value (mg min dm−3) = C (mg dm−3) concentration of disinfectant × T (min) contact time with water
The table below compares the CT values of different disinfectants necessary to achieve 99% inactivation of two types of bacteria, listed as A and B.

(i) Deduce the oxidation state of chlorine in the following disinfectants.

(ii) From the data on CT values, justify the statement that bacterium B is generally more resistant to disinfection than bacterium A.
(iii) CT values can be used to determine whether a particular treatment process is adequate. Calculate the CT value, in mg min dm−3, when 1.50 × 10⁻⁵ g dm−3 of chlorine dioxide is added to a water supply with a contact time of 9.82 minutes.
(iv) From your answer to (a) (iii) and the data in the table, comment on whether this treatment will be sufficient to inactivate 99% of bacterium A.
CT values are influenced by temperature and by pH. The table below shows the CT values for chlorine needed to achieve 99% inactivation of a specific bacterium at stated values of pH and temperature.

(i) With reference to the temperature data in the table, suggest why it may be more difficult to treat water effectively with chlorine in cold climates.
(ii) Sketch a graph on the axes below to show how the CT value (at any temperature) varies with pH.

(iii) Comment on the relative CT values at pH 6.0 and pH 9.0 at each temperature.
(iv) Chlorine reacts with water as follows:
Cl2 (g) + H2O (l) \( \rightleftharpoons \) HOCl (aq) + HCl (aq)
HOCl (aq) \( \rightleftharpoons \) OCl− (aq) + H+ (aq)
Predict how the concentrations of each of the species HOCl (aq) and OCl− (aq) will change if the pH of the disinfected water increases.

Despite widespread improvements in the provision of safe drinking water, the sale of bottled water has increased dramatically in recent years. State one problem caused by this trend.
Markscheme
i
HOCl: +1
AND
ClO2: +4
Accept “I” and “IV” but not “1+/1” and “4+/4” notations.
ii
«most» CT values are higher for «bacterium» B
OR
«generally» higher dosage needed for «bacterium» B
Accept converse arguments. Accept “concentration” for “dosage”
iii
«CT = 1.50 × 10–5 × 103 mg dm–3 × 9.82 min =» 1.47 × 10⁻¹ «mg min dm–3»
iv
lower than CT value/minimum dosage/1.8 × 10–1 «mg min dm–3»
AND
no/insufficient
Accept “concentration” for “dosage”.
i
higher CT value at lower temperature
OR
higher dosage «of chlorine» needed at low temperature
Accept “effectiveness decreases at lower temperature”.
Accept “concentration” for “dosage”.
Accept converse arguments.
ii
labeled axes ( y: CT and x: pH)
AND
curve with increasing gradient
Do not accept axes the wrong way round.
Accept a linear sketch.
iii
values at pH 9.0 approximately 3 times values at pH 6.0
OR
increase in CT values in same ratio
The exact ratio is 2.9 times
Do not accept just “increase in value”.
iv
[HOCl] decreases AND [OCl−] increases
plastic disposal/pollution
OR
plastic bottles use up petroleum/non-renewable raw material
OR
chemicals in plastic bottle can contaminate water
OR
«prolonged» storage in plastic can cause contamination of water
OR
plastic water bottles sometimes reused without proper hygiene considerations
Accept other valid answers.
Accept economic considerations such as “greater production costs”, “greater transport costs” or “bottled water more expensive than tap water”
Examiners report
Infrared (IR) spectra can be used to distinguish between various types of plastics. Some simplified IR spectra are given here.

Explain, with a reference to molecular structure, which two of the plastics can not be distinguished by IR spectroscopy.
Markscheme
HDPE AND LDPE «have similar IR»
both are polyethene/polyethylene
OR
only branching differs
OR
same bonds
OR
same bending/stretching/vibrations
Accept “water bottle AND water bottle cap” for M1.
[2 marks]
Examiners report
Infrared (IR) spectroscopy is often used for the identification of polymers, such as PETE, for recycling.
LDPE and high density polyethene (HDPE) have very similar IR spectra even though they have rather different structures and physical properties.
Below are the IR spectra of two plastics (A and B); one is PETE, the other is low density polyethene (LDPE).

Deduce, giving your reasons, the identity and resin identification code (RIC) of A and B using sections 26 and 30 of the data booklet.

Describe the difference in their structures.
Explain why the difference in their structures affects their melting points.
Markscheme
A RIC: 1 AND B RIC: 4
ALTERNATIVE 1:
«only» PETE contains carbonyl/C=O/ester/COO groups
carbonyl groups absorb at 1700–1750 «cm–1»
ALTERNATIVE 2:
LDPE contains more C–H bonds «than PETE»
C–H bonds absorb at 2850–3090 «cm–1»
For either, accept specific frequencies in these ranges (eg 1735 «cm–1» or 2900 «cm–1»).
[3 marks]
HDPE less branched
OR
LDPE more branched
Accept “no branching in HDPE AND branching in LDPE”.
[1 mark]
HDPE «polymer» chains/molecules can pack together more closely «than LDPE chains»
OR
HDPE «polymer» chains/molecules have a higher contact surface area «than LDPE chains»
stronger intermolecular/dispersion/London/van der Waals’ forces in HDPE AND higher melting point
Accept converse arguments.
[2 marks]
Examiners report
A student set up a simple voltaic cell consisting of a copper electrode and a zinc electrode dipped in sodium chloride solution.

The student gradually increased the distance, d, between the electrodes to study the effect on the initial current, I, passing through the light bulb.
The student hypothesized that the initial current would be inversely proportional to the distance between the electrodes.
The following data was collected over five trials.

The data did not support the student’s hypothesis. He investigated other possible relationships by plotting a graph of the average current against the distance between the electrodes. He obtained the following best-fit line with a correlation coefficient (r) of −0.9999.

Sketch a graph that would support the student’s hypothesis.

Suggest what the correlation coefficient of −0.9999 indicates.
State the equation of the straight line obtained using the data.
Outline how current flows in the sodium chloride solution.
Markscheme

OR

OR

Correct labels of axes required for mark.
Accept d–1 instead of \(\frac{1}{d}\).
Accept I–1 instead of \(\frac{1}{I}\).
Plot of I vs d should not be linear.
negative correlation
OR
model/prediction matches results
OR
99% of variance accounted for
I = – 0.001631 d + 0.09939
OR
y = – 0.001631 x + 0.09939
Accept correctly rounded values for m and b in equation.
Do not accept “y = mx + b”.
ions move «across electrolyte»
Examiners report
The absorption of infrared (IR) radiation by molecules in the atmosphere affects global temperatures.

Using the graph, state, giving your reasons, whether or not oxygen and ozone are greenhouse gases.
Markscheme
Ozone: yes because it absorbs IR/is IR active
Oxygen: no because it does not absorb IR/is IR inactive
Award [1 max] for stating “ozone/O3 is a greenhouse gas but oxygen/O2 is not”.
Award [1 max] for stating “ozone/O3 absorbs IR/is IR active but oxygen/O2 does not/is IR inactive”.
Accept “oxygen/O2 is not a greenhouse gas because it absorbs UV”.
Examiners report
There is a link between world energy consumption and carbon dioxide production.
Climate induced changes in the ocean can be studied using measurements such as the Atmospheric Potential Oxygen (APO). Trends in APO concentration from two stations, one in each hemisphere, are shown below.

Trends in atmospheric potential oxygen (APO) based on monthly averages between 1990 and 2010.
[Source: www.ioos.noaa.gov]
The following graph represents world energy consumption by type for the years 1988–2013.

Estimate the percentage of energy consumption which did not directly produce CO2 in 2013.
O2 is consumed in producing CO2 for electricity generation. The graph shows the relationship between the world’s electricity generation and CO2 production between 1994 and 2013.

Calculate the mass, in million tonnes, of oxygen gas ultimately found in CO2 which is consumed in generating 18\(\,\)000 terawatts of electricity using the equation given for the best fit line. Give your answer to 2 significant figures.
Assume coal is the only energy source.
The equilibrium expression for O2 exchange between the atmosphere and ocean is O2(g) \( \rightleftharpoons \) O2(aq). Identify one factor which shifts the equilibrium to the right.
Factors such as photosynthesis and respiration are excluded so that APO is influenced by oceanic changes only. Suggest why the seasonal cycles from Alert station and Cape Grim observatory are different.
The change in APO O2/N2 ratio, per meg, is measured relative to an O2/N2 reference.
\[\Delta {\text{(}}{{\text{O}}_{\text{2}}}{\text{/}}{{\text{N}}_{\text{2}}}{\text{)}} = \left( {\frac{{{{({{\text{O}}_2}/{{\text{N}}_2})}_{{\text{sample}}}}}}{{{{({{\text{O}}_2}/{{\text{N}}_2})}_{{\text{reference}}}}}} - 1} \right) \times {10^6}\]
Calculate the APO Δ(O2/N2) value for an oxygen concentration of 209\(\,\)400 ppm assuming that any change in N2 concentration is negligible. Reference values for O2 and N2 are 209 460 and 790 190 ppm respectively.
Suggest a reason for the general negative gradient of the APO curve given in (c).
Markscheme
«\(\frac{{\sum {({\text{renewables}} + {\text{hydroelectricity}} + {\text{nuclear)}}} }}{{{\text{total}}}}\)»
«\(\left( {\frac{{8800 - 7200}}{{12600}}} \right) \times 100 = \)» 13 «%»
Accept range of “11–16%”.
[1 mark]
«18000 = 0.54x – 2000»
x = 37037 «million tonnes of CO2»
«\(\frac{{32.00}}{{44.01}}\) x 37037 = 26930»
27000/2.7 x 104 «million tonnes of O2»
Accept “37000 «million tonnes of CO2»” for M1.
Award [2] for correct final answer with two significant figures.
Award [1] for non rounded answers in range 26903–26936 «million tonnes of O2».
[2 marks]
increase in «atmospheric» pressure
OR
increase in [O2(g)]/concentration of O2(g)
OR
decrease in [O2(aq)]/concentration of O2(aq)
OR
decrease in temperature
Accept “increase in volume of oceans «due to polar ice cap melting»” OR “consumption of O2 in oceans/O2(aq)
«by living organisms»”.
State symbols required for oxygen concentration.
[1 mark]
summer in one station while winter in other
OR
stations are at different latitudes
oxygen dissolves better in colder water
Accept “opposite seasons «in each hemisphere»”.
Do not accept “different locations with different temperatures” OR “stations are in different hemispheres”.
[2 marks]
«\({\text{(}}\frac{{209400}}{{209460}} - 1{\text{)}} \times {10^6}\) =» − 286.5 «per meg»
The nitrogen cancels so is not needed in the calculation.
Negative sign required for mark.
[1 mark]
decrease in [O2]/concentration of O2
OR
increasing combustion of fossil fuels «consumes more O2 so [O2]/concentration of O2 decreases»
OR
warmer oceans/seas/water «as oxygen dissolves better in colder water»
OR
deforestation
Accept “decrease in level of O2”.
Accept "increasing CO2 production «consumes more O2 so [O2]/concentration of O2 decreases»".
Do not accept “decrease in amount of O2” OR “increase in greenhouse gases”.
[1 mark]
Examiners report
Sodium chloride, NaCl, can be spread on icy roads to lower the freezing point of water.
The diagram shows the effects of temperature and percentage by mass of NaCl on the composition of a mixture of NaCl and H2O.

Estimate the lowest freezing point of water that can be reached by adding sodium chloride.
Estimate the percentage by mass of NaCl dissolved in a saturated sodium chloride solution at +10 ºC.
Calculate the percentage of water by mass in the NaCl•2H2O crystals. Use the data from section 6 of the data booklet and give your answer to two decimal places.
Suggest a concern about spreading sodium chloride on roads.
Markscheme
–21 «ºC»

28 «%»
Accept any specific answer in the range 27 to 29 «%».
Mr = 94.48
«\(2\frac{{\left( {1.01 \times 2 + 16.00} \right)}}{{94.48}} \times 100 = \)» 38.15 «%»
Award M2 only if answer is to 2 decimal places.
Award [2] for correct final answer.
Award [1 max] for 38.10 %.
rust/corrosion «of cars and bridges»
OR
waste of important raw material
OR
soil/water salination/pollution «from run off»
OR
erosion of/damage to the road surface
OR
specific example of damage to the ecosystem
OR
«outdoor» temperatures may go below effective levels for NaCl «to lower freezing point» so NaCl could be wasted
OR
roads can refreeze causing hazards
Do not accept “tyre damage”.
Do not accept “economic issues” OR “environmental issues” unless specified (eg accept “increase in costs for local councils road budgets” but not “cost” alone).
Do not accept “makes roads more slippery”.