HL Paper 3
Infrared (IR) spectroscopy is widely used as a technique in analytical chemistry.
The IR spectrum, mass spectrum and \(^{\text{1}}{\text{H}}\,{\text{NMR}}\) spectrum of an unknown compound, Y, of molecular formula \({{\text{C}}_{\text{2}}}{{\text{H}}_{\text{4}}}{{\text{O}}_{\text{2}}}\) are as follows.
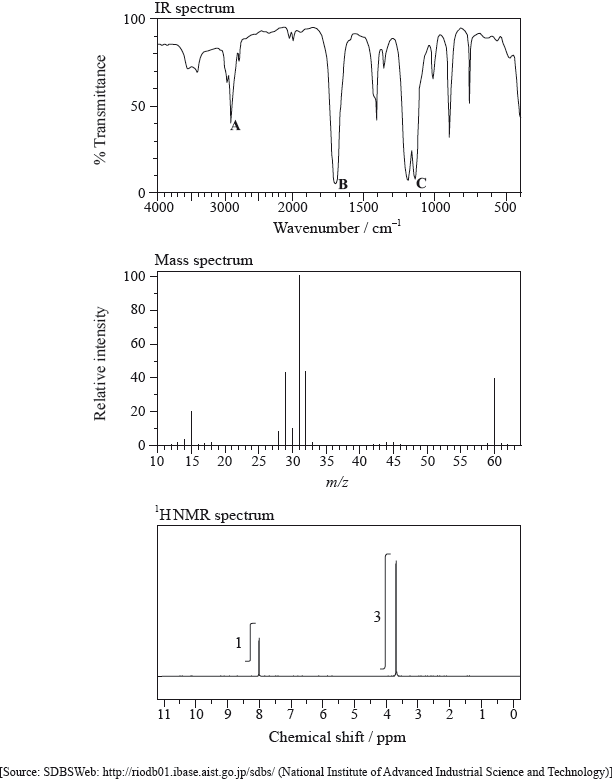
(i) Identify the bonds responsible for the peaks A, B and C in the IR spectrum of Y.
A:
B:
C:
(ii) In the mass spectrum of Y, deduce which ions the m/z values at 31 and 29 correspond to.
m/z = 31:
m/z = 29:
(iii) Identify the peaks at 3.76 and 8.07 ppm in the \(^{\text{1}}{\text{H}}\,{\text{NMR}}\) spectrum.
3.76 ppm:
8.07 ppm:
(iv) State what information can be obtained from the integration trace about the hydrogen atoms responsible for the peak at 3.76 ppm in the \(^{\text{1}}{\text{H}}\,{\text{NMR}}\) spectrum.
(v) Deduce the structure of Y.
(vi) Explain why tetramethylsilane (TMS) is suitable as a reference standard.
Another structural isomer of \({{\text{C}}_{\text{4}}}{{\text{H}}_{\text{9}}}{\text{Br}}\) is 2-bromo-2-methylpropane. Deduce the number of peaks and the splitting pattern in the \(^{\text{1}}{\text{H}}\,{\text{NMR}}\) spectrum of this isomer.
Number of peaks:
Splitting pattern:
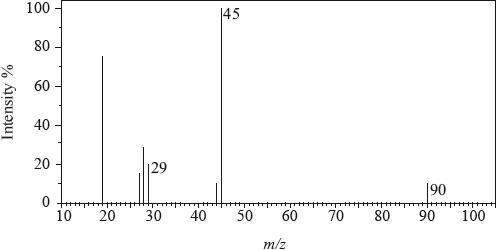
The mass spectrum of an unknown acidic compound, X, with empirical formula \({\text{C}}{{\text{H}}_{\text{2}}}{\text{O}}\), is shown below.
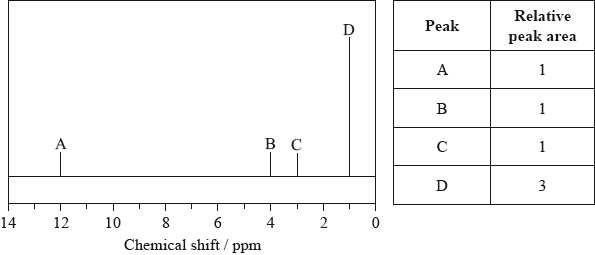
The low-resolution \(^{\text{1}}{\text{H}}\,{\text{NMR}}\) spectrum of X shows four peaks. A simplified representation is shown alongside a table with relative peak areas.
Determine the relative molecular mass, to the nearest integer, of the compound from the mass spectrum and deduce the formula of the molecular ion.
Deduce the formula of the fragment responsible for the peak at 45.
Deduce the formula of the fragment responsible for the peak at 29.
Identify the group responsible for the peak at D.
Suggest a possible structure for X.
Peak B shows the following splitting pattern in the high-resolution spectrum.

Explain the splitting pattern, indicating the hydrogen responsible for peak B.
Compound X has the molecular formula \({{\text{C}}_{\text{3}}}{{\text{H}}_{\text{6}}}{{\text{O}}_{\text{3}}}\) and is found in human perspiration.
Its infrared (IR) spectrum is represented below.
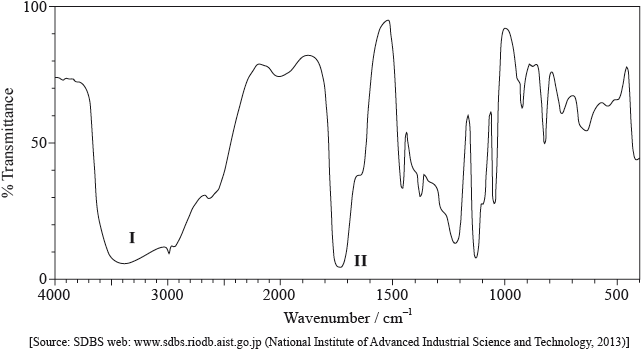
Deduce the bonds responsible for the absorptions labelled I and II.
I:
II:
The \(^{\text{1}}{\text{H}}\,{\text{NMR}}\) spectrum recorded showed four peaks with the following chemical shift values (in ppm):
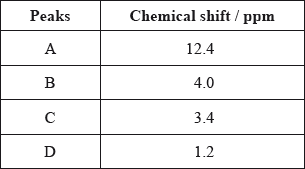
The integration trace for A:B:C:D was found to be 1:1:1:3.
Deduce what information can be obtained about the hydrogen atoms responsible for peak D at 1.2 ppm from the integration trace in the \(^{\text{1}}{\text{H}}\,{\text{NMR}}\) spectrum of X.
Deduce the fragments in the mass spectrum which correspond to the following \(m{\text{/}}z\) values.
\(m{\text{/}}z = 45\):
\(m{\text{/}}z = 17\):
\(m{\text{/}}z = 15\):
Deduce the structural formula of X.
Y is an isomer of X, which contains the same functional groups. Deduce the structural formula of Y.
(i) Like X, 3-methylbutanoic acid is also a source of body odour. Deduce the \(m{\text{/}}z\) value for the molecular ion peak on the mass spectrum of this compound.
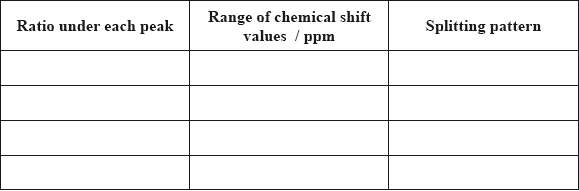
(ii) Ethyl propanoate (ethyl propionate) is an isomer of 3-methylbutanoic acid. Its \(^{\text{1}}{\text{H}}\,{\text{NMR}}\) spectrum consists of four peaks.
Deduce the ratios of the areas under each peak in the \(^{\text{1}}{\text{H}}\,{\text{NMR}}\) spectrum of ethyl propanoate. For each peak, deduce the range of chemical shift values (in ppm), using Table 18 of the Data Booklet, and predict the splitting pattern.
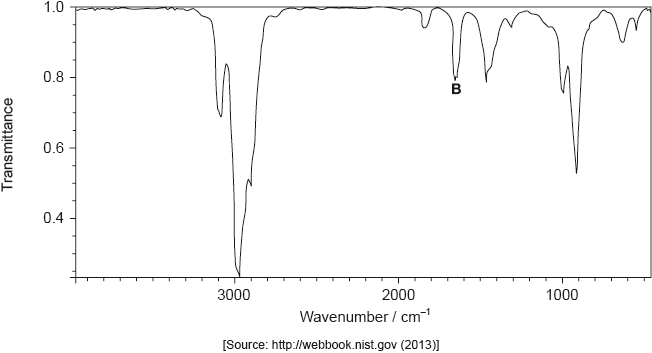
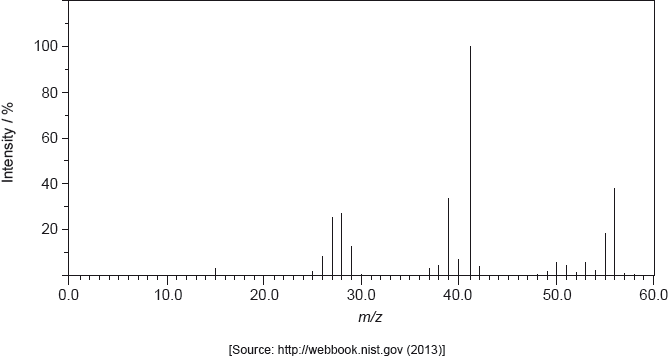
The mass spectrum and infrared (IR) spectrum of a compound are shown below.
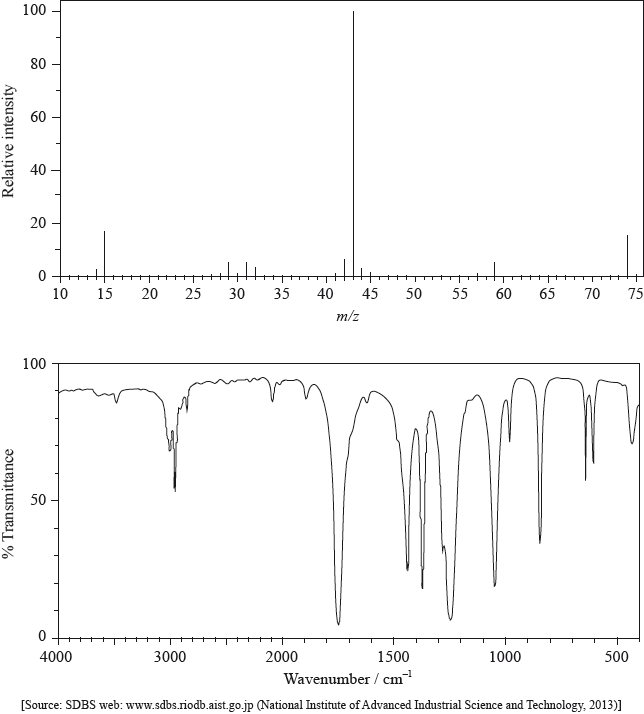
(i) State the information about this particular compound that can be derived from the mass spectrum and outline how it is found.
(ii) Suggest how the fragment with m/z = 43 is formed from the original molecule.
(i) Use the IR spectrum in the region 1600 – 1800 \({\text{c}}{{\text{m}}^{ - 1}}\) to deduce one functional group that is present in the compound and one group that is absent.
Present:
Absent:
(ii) The molecular formula of the compound is \({{\text{C}}_{\text{3}}}{{\text{H}}_{\text{6}}}{{\text{O}}_{\text{2}}}\). Explain, with reference to another region of the IR spectrum, why the compound could not be propanoic acid, \({\text{C}}{{\text{H}}_{\text{3}}}{\text{C}}{{\text{H}}_{\text{2}}}{\text{COOH}}\).
(iii) Deduce the structures of two possible isomers of propanoic acid consistent with the IR spectrum.
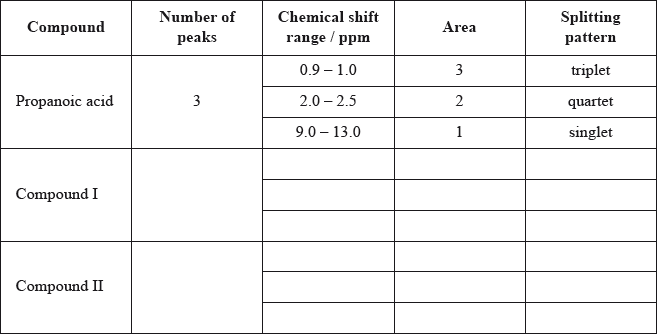
\(^{\text{1}}{\text{H}}\,{\text{NMR}}\) spectroscopy is often very useful in distinguishing between closely related compounds such as the ones shown below.
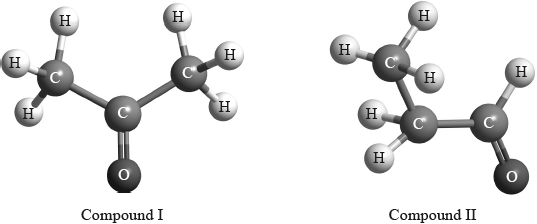
Deduce the \(^{\text{1}}{\text{H}}\,{\text{NMR}}\) spectra you would expect for each compound and complete the table below. (The answers for propanoic acid are given as a guide.)
Note that some of the boxes may be blank.
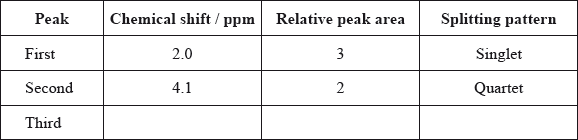
Typical proton chemical shift values are given in Table 18 of the Data Booklet. The \(^{\text{1}}{\text{H}}\,{\text{NMR}}\) spectrum of X contains three peaks. Details of two of these are shown in the table below.
Deduce a possible structure for X that is consistent with the mass, IR and \(^{\text{1}}{\text{H}}\,{\text{NMR}}\) spectra.
Complete the table above by suggesting the chemical shift of the third peak, and state its relative peak area and splitting pattern.
Explain the splitting pattern of the peak at chemical shift 4.1 ppm.
The structure of an unknown compound A with empirical formula \({\text{C}}{{\text{H}}_{\text{2}}}\) can be determined using information from a variety of analytical techniques.
The infrared (IR) spectrum of A is shown below.
The mass spectrum of A is shown below.
Deduce the formula of the molecular ion from the mass spectrum.
Explain the presence of a doublet in the high-resolution proton nuclear magnetic resonance (1H NMR) spectrum of A.
One isomer of A has only one signal in its \(^{\text{1}}{\text{H}}\) NMR spectrum. Deduce the structural formula of this isomer.
Biological pigments include a variety of chemical structures with diverse functions.
The graph shows the conversion of hemoglobin to oxyhemoglobin.
Hb(aq) + 4O2(g) \( \rightleftharpoons \) Hb(O2)4(aq)
The partial pressure of oxygen gas, p(O2) is proportional to its concentration.
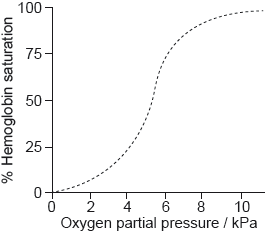
Explain the shape of the curve at low oxygen partial pressure up to about 5 kPa.
Sketch a graph on the axes above to show the effect of decreasing pH on the binding of oxygen to hemoglobin (the Bohr Effect).
Outline the effect of decreasing pH on the oxygen saturation of hemoglobin.
Aspirin is one of the most widely used drugs in the world.
Aspirin was synthesized from 2.65 g of salicylic acid (2-hydroxybenzoic acid) (Mr = 138.13) and 2.51 g of ethanoic anhydride (Mr = 102.10).

Suggest two absorbances, other than the absorbances due to the ring structure and C–H bonds, that would be present in the infrared (IR) spectrum of aspirin.
State two techniques, other than IR spectroscopy, which could be used to confirm the identity of aspirin.
The molecule of an unknown straight-chain compound consists of 4 carbon, 8 hydrogen, and 1 oxygen atoms. The 1H NMR spectrum of the compound is given below (the numbers next to integration traces correspond to areas under each peak).
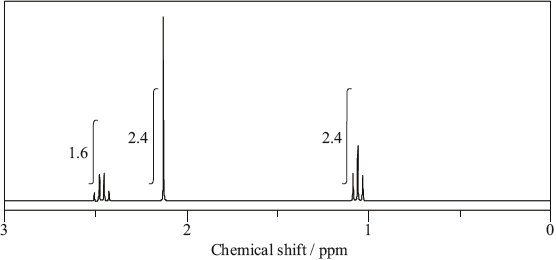
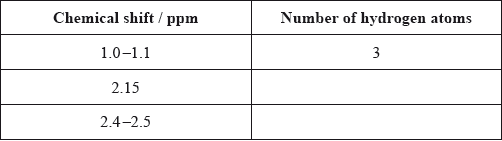
Calculate the number of hydrogen atoms for peaks with chemical shifts of 2.15 and 2.4–2.5 ppm. An example for the peak at 1.0–1.1 ppm is given.
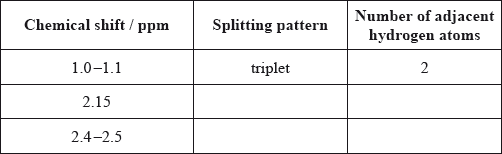
Analyse the splitting pattern of each peak and determine the relative positions of hydrogen atoms in the molecule. One example is given.
Using the information from (a) and (b), deduce the structural formula of the organic compound.
The structures of morphine, diamorphine and codeine are given in section 37 of the data booklet.
Methadone is used to treat heroin addiction. 1H NMR spectroscopy can be used to study its structure.

Predict the number of different hydrogen environments in the molecule ignoring the benzene rings.
Predict the chemical shift and the splitting pattern seen for the hydrogens on the carbon atom circled in the diagram. Use section 27 of the data booklet.

Ibuprofen and paracetamol are mild analgesics. One of the IR spectra below belongs to ibuprofen and the other to paracetamol. The structures of both compounds are given in section 37 of the data booklet.

Both spectra show a peak at wavenumber 1700 cm–1. Identify the bond responsible for this peak.
Deduce which spectrum belongs to paracetamol, giving two reasons for your choice. Use section 26 of the data booklet.

Describe how mild analgesics function.
In recent years several antiviral medications have been produced. One of these medications is oseltamivir (Tamiflu).
Identify the functional group circled in the structure of oseltamivir.

Predict the number of signals and relative integration you would expect to see in the nuclear magnetic resonance spectroscopy (1H NMR) spectrum for the circled portion in the structure.

Number of signals:
Relative integration:
Oseltamivir is a chiral compound.
(i) Identify an apparatus that can be used to distinguish between its enantiomers.
(ii) Explain how the differentiation between the enantiomers is obtained using this apparatus.